. 2019 Jul 24;5(7):eaaw4358.
doi: 10.1126/sciadv.aaw4358. eCollection 2019 Jul.

Emotion schemas are embedded in the human visual system

Affiliations

Emotion schemas are embedded in the human visual system

Philip A Kragel et al. Sci Adv. .

Abstract

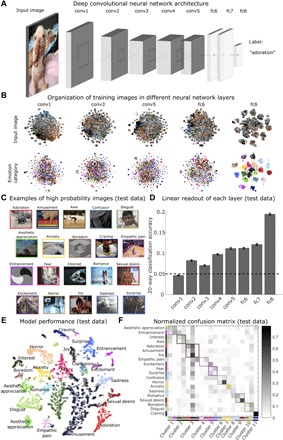
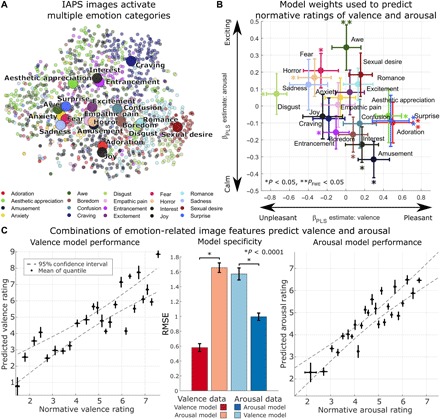
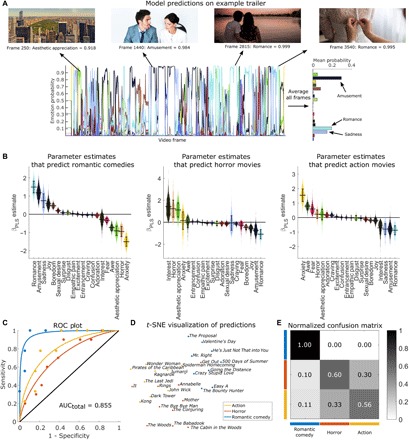
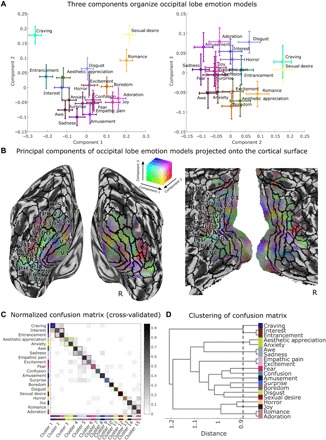
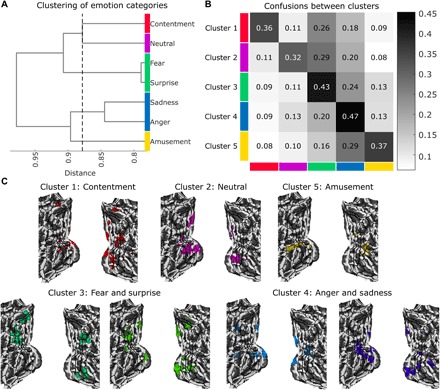
Theorists have suggested that emotions are canonical responses to situations ancestrally linked to survival. If so, then emotions may be afforded by features of the sensory environment. However, few computational models describe how combinations of stimulus features evoke different emotions. Here, we develop a convolutional neural network that accurately decodes images into 11 distinct emotion categories. We validate the model using more than 25,000 images and movies and show that image content is sufficient to predict the category and valence of human emotion ratings. In two functional magnetic resonance imaging studies, we demonstrate that patterns of human visual cortex activity encode emotion category-related model output and can decode multiple categories of emotional experience. These results suggest that rich, category-specific visual features can be reliably mapped to distinct emotions, and they are coded in distributed representations within the human visual system.


Figures

Fig. 1
Fig. 1. Predicting emotional responses to images with a deep CNN.
(A) Model architecture follows that of AlexNet (five convolutional layers followed by three fully connected layers); only the last fully connected layer has been retrained to predict emotion categories. (B) Activation of artificial neurons in three convolutional layers (1, 3, and 5) and two fully connected layers (6 and 8) of the network. Scatterplots depict t-distributed stochastic neighbor embedding (t-SNE) plots of activation for a random selection of 1000 units in each layer. The first four layers come from a model developed to perform object recognition (25), and the last layer was retrained to predict emotion categories from an extensive database of video clips. (C) Examples of randomly selected images assigned to each class in holdout test data (images from videos that were not used for training the model). Pictures were not chosen to match target classes. Some examples show contextually driven prediction, e.g., an image of a sporting event is classified as empathic pain, although no physical injury is apparent. (D) Linear classification of activation in each layer of EmoNet shows increasing emotion-relation information in later layers, particularly in the retrained layer fc8. Error bars indicate SEM based on binomial distribution. (E) t-SNE plot shows model predictions in test data. Colors indicate the predicted class, and circled points indicate that the ground truth label was in the top 5 predicted categories. Although t-SNE does not preserve global distances, the plot does convey local clustering of emotions such as amusement and adoration. (F) Normalized confusion matrix shows the proportion of test data that are classified into the 20 categories. Rows correspond to the correct category of test data, and columns correspond to predicted categories. Gray colormap indicates the proportion of predictions in the test dataset, where each row sums to a value of 1. Correct predictions fall on the diagonal of the matrix, whereas erroneous predictions comprise off-diagonal elements. Categories the model is biased toward predicting, such as amusement, are indicated by dark columns. Data-driven clustering of errors shows 11 groupings of emotions that are all distinguishable from one another (see Materials and Methods and fig. S3). Images were captured from videos in the database developed by Cowen and Keltner (25).
Fig. 2
Fig. 2. Emotion-related image features predict normative ratings of valence and arousal.
(A) Depiction of the full IAPS, with picture locations determined by t-SNE of activation of the last fully connected layer of EmoNet. The color of each point indicates the emotion category with the greatest score for each image. Large circles indicate mean location for each category. Combinations of loadings on different emotion categories are used to make predictions about normative ratings of valence and arousal. (B) Parameter estimates indicate relationships identified using PLS regression to link the 20 emotion categories to the dimensions of valence (x axis) and arousal (y axis). Bootstrap means and SE are shown by circles and error bars. For predictions of valence, positive parameter estimates indicate increasing pleasantness, and negative parameter estimates indicate increasing unpleasantness; for predictions of arousal, positive parameter estimates indicate a relationship with increasing arousal and negative estimates indicate a relationship with decreasing arousal. *P < 0.05, **PFWE < 0.05. (C) Cross-validated model performance. Left and right: Normative ratings of valence and arousal, plotted against model predictions. Individual points reflect the average rating for each of 25 quantiles of the full IAPS set. Error bars indicate the SD of normative ratings (x axis; n = 47) and the SD of repeated 10-fold cross-validation estimates (y axis; n = 10). Middle: Bar plots show overall RMSE (lower values indicate better performance) for models tested on valence data (left bars, red hues) and arousal data (right bars, blue hues). Error bars indicate the SD of repeated 10-fold cross-validation. *P < 0.0001, corrected resampled t test. The full CNN model and weights for predicting valence and arousal are available at https://github.com/canlab for public use.
Fig. 3
Fig. 3. Identifying the genre of movie trailers using emotional image features.
(A) Emotion prediction for a single movie trailer. Time courses indicate model outputs on every fifth frame of the trailer for the 20 emotion categories, with example frames shown above. Conceptually related images from the public domain (CC0) are displayed instead of actual trailer content. A summary of the emotional content of the trailer is shown on the right, which is computed by averaging predictions across all analyzed frames. (B) PLS parameter estimates indicate which emotions lead to predictions of different movie genres. Violin plots depict the bootstrap distributions (1000 iterations) for parameter estimates differentiating each genre from all others. Error bars indicate bootstrap SE. (C) Receiver operator characteristic (ROC) plots depict 10-fold cross-validation performance for classification. The solid black line indicates chance performance. (D) t-SNE plot based on the average activation of all 20 emotions. (E) Confusion matrix depicting misclassification of different genres; rows indicate the ground truth label, and columns indicate predictions. The grayscale color bar shows the proportion of trailers assigned to each class. Analysis was performed on a trailer for The Proposal, ©2009 Disney.
Fig. 4
Fig. 4. Visualization of the 20 occipital lobe models, trained to predict EmoNet categories from brain responses to emotional images.
Visualization based on PCA reveals three important emotion-related features of the visual system. (A) Scatterplots depict the location of 20 emotion categories in PCA space, with colors indicating loadings onto the first three principal components (PCs) identified from 7214 voxels that retain approximately 95% of the spatial variance across categories. The color of each point is based on the component scores for each emotion (in an additive red-green-blue color space; PC1 = red, PC2 = green, PC3 = blue). Error bars reflect bootstrap SE. (B) Visualization of group average coefficients that show mappings between voxels and principal components. Colors are from the same space as depicted in (A). Solid black lines indicate boundaries of cortical regions based on a multimodal parcellation of the cortex (41). Surface mapping and rendering were performed using the CAT12 toolbox (42). (C) Normalized confusion matrix shows the proportion of data that are classified into 20 emotion categories. Rows correspond to the correct category of cross-validated data, and columns correspond to predicted categories. Gray colormap indicates the proportion of predictions in the dataset, where each row sums to a value of 1. Correct predictions fall on the diagonal of the matrix; erroneous predictions comprise off-diagonal elements. Data-driven clustering of errors shows 15 groupings of emotions that are all distinguishable from one another. (D) Visualization of distances between emotion groupings. Dashed line indicates minimum cutoff that produces 15 discriminable categories. Dendrogram was produced using Ward’s linkage on distances based on the number of confusions displayed in (C). See Supplementary Text for a description and validation of the method.
Fig. 5
Fig. 5. Multiclass classification of occipital lobe activity reveals five discriminable emotion clusters.
(A) Dendrogram illustrates hierarchical clustering of emotion categories that maximizes discriminability. The x axis indicates the inner squared distance between emotion categories. The dashed line shows the optimal clustering solution; cluster membership is indicated by color. (B) Confusion matrix for the five-cluster solution depicts the proportion of trials that are classified as belonging to each cluster (shown by the column) as a function of ground truth membership in a cluster (indicated by the row). The overall five-way accuracy is 40.54%, where chance is 20%. (C) Model weights indicate where increasing brain activity is associated with the prediction of each emotion category. Maps are thresholded at a voxel-wise threshold of P < 0.05 for display.

References

    1. J. Tooby, L. Cosmides, The evolutionary psychology of the emotions and their relationship to internal regulatory variables, in Handbook of Emotions, M. Lewis, J. M. Haviland-Jones, L. F. Barrett, Eds. (The Guilford Press, 2008), pp. 114–137.
    1. R. S. Lazarus, Emotions and adaptation: Conceptual and empirical relations, in Nebraska Symposium on Motivation (University of Nebraska Press, 1968), pp. 175–266.
    1. K. R. Scherer, On the nature and function of emotion: A component process approach, in Approaches to Emotion, K. R. Scherer, P. Ekman, Eds. (Erlbaum, 1984), pp. 293–317.
    1. Ekman P., An argument for basic emotions. Cogn. Emot. 6, 169–200 (1992).
    1. Russell J. A., Core affect and the psychological construction of emotion. Psychol. Rev. 110, 145–172 (2003). - PubMed

Publication types