. 2019 Jul 29;129(9):3625-3639.
doi: 10.1172/JCI126363.

IFN-I response timing relative to virus replication determines MERS coronavirus infection outcomes

Affiliations

IFN-I response timing relative to virus replication determines MERS coronavirus infection outcomes

Rudragouda Channappanavar et al. J Clin Invest. .

Abstract

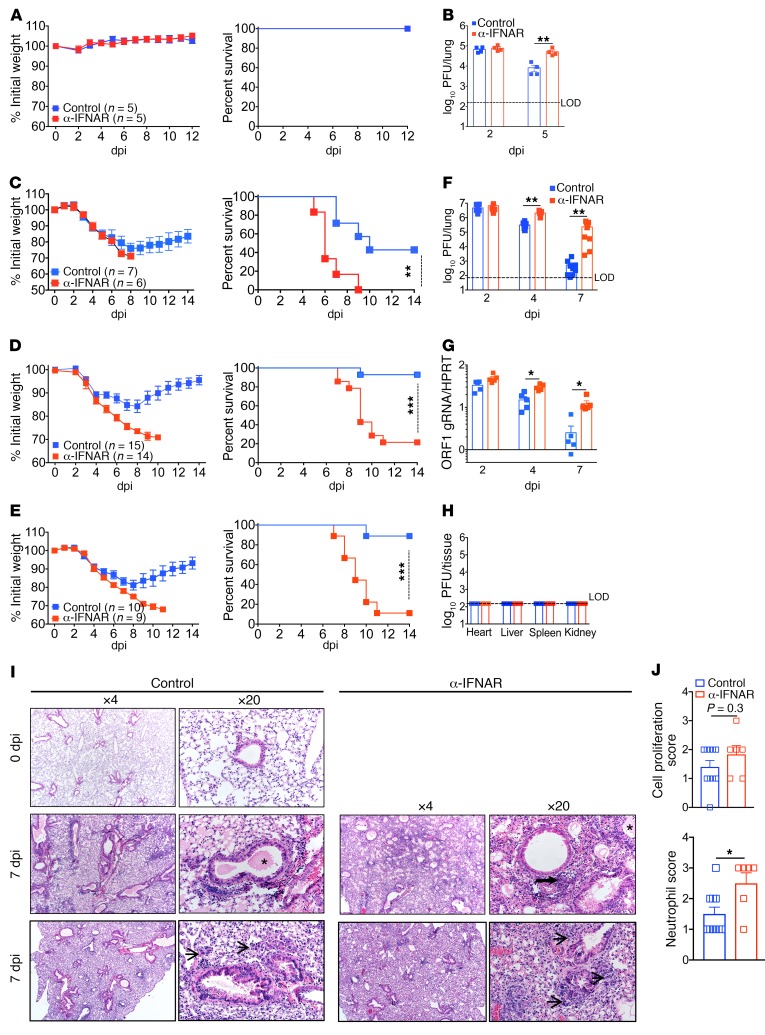
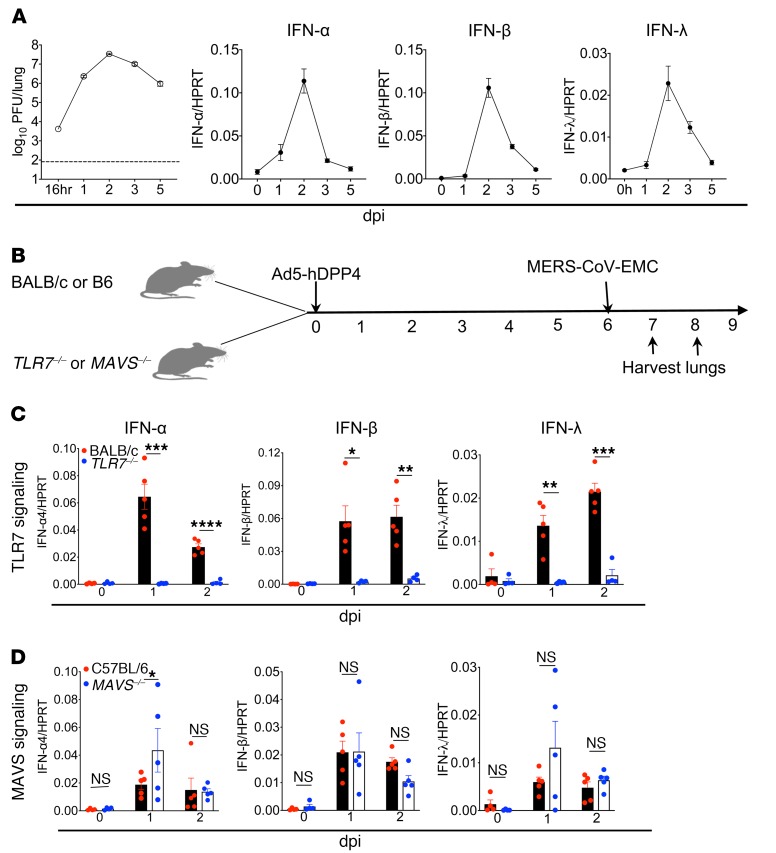
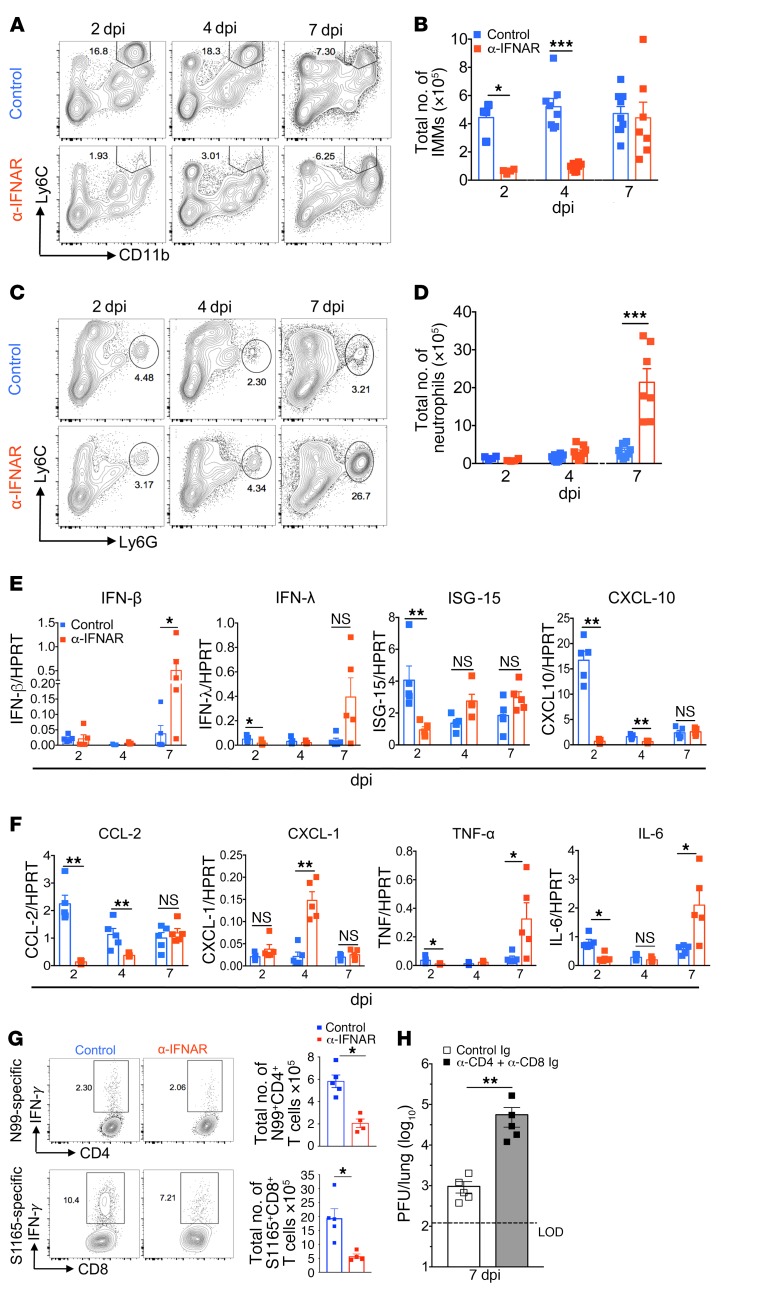
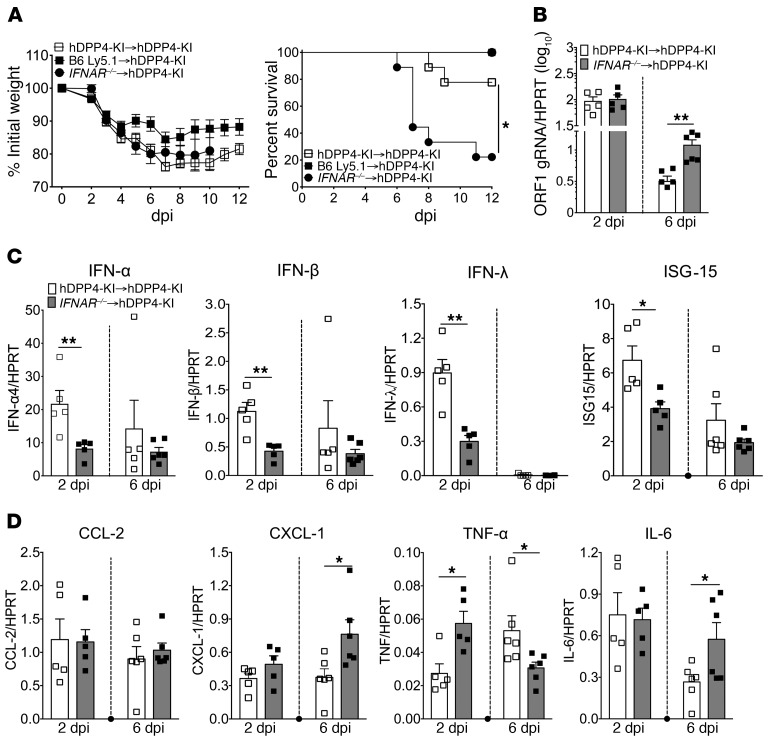
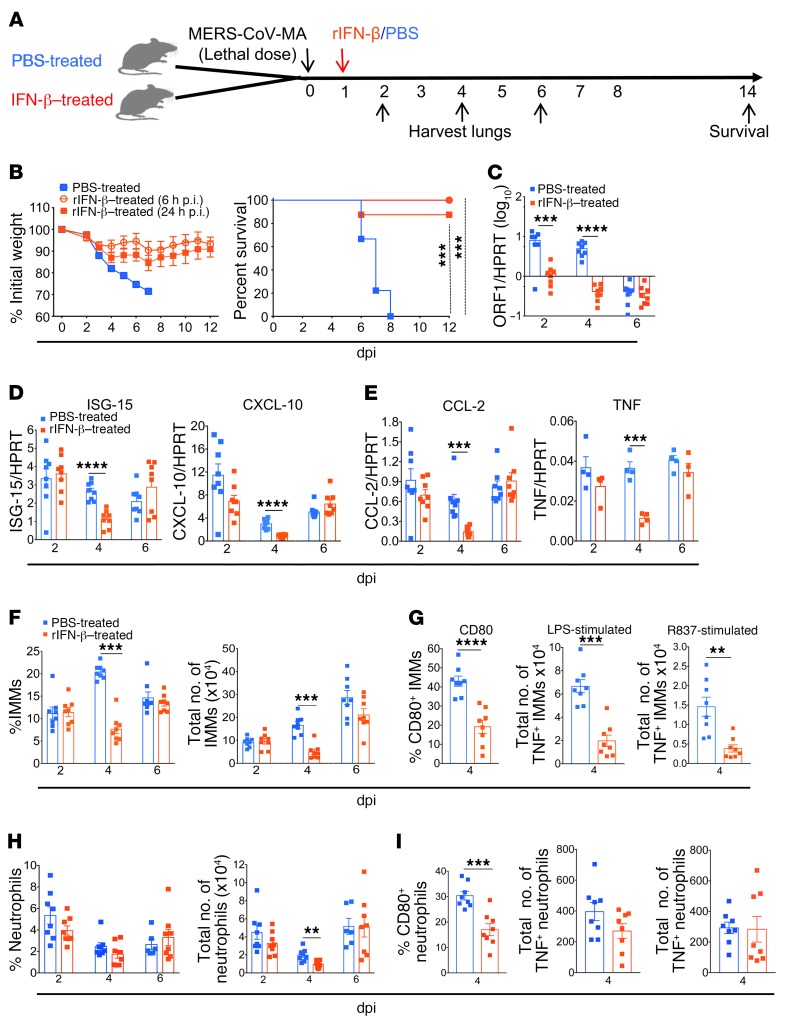
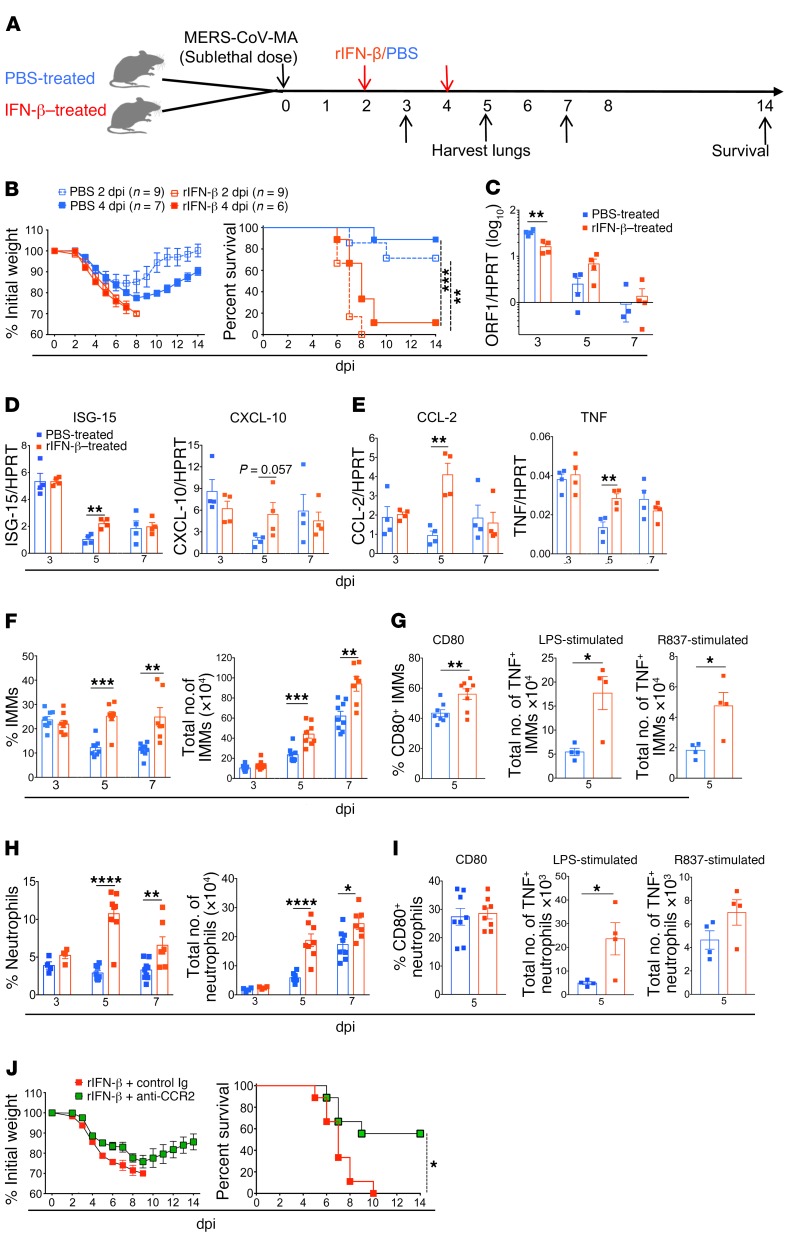
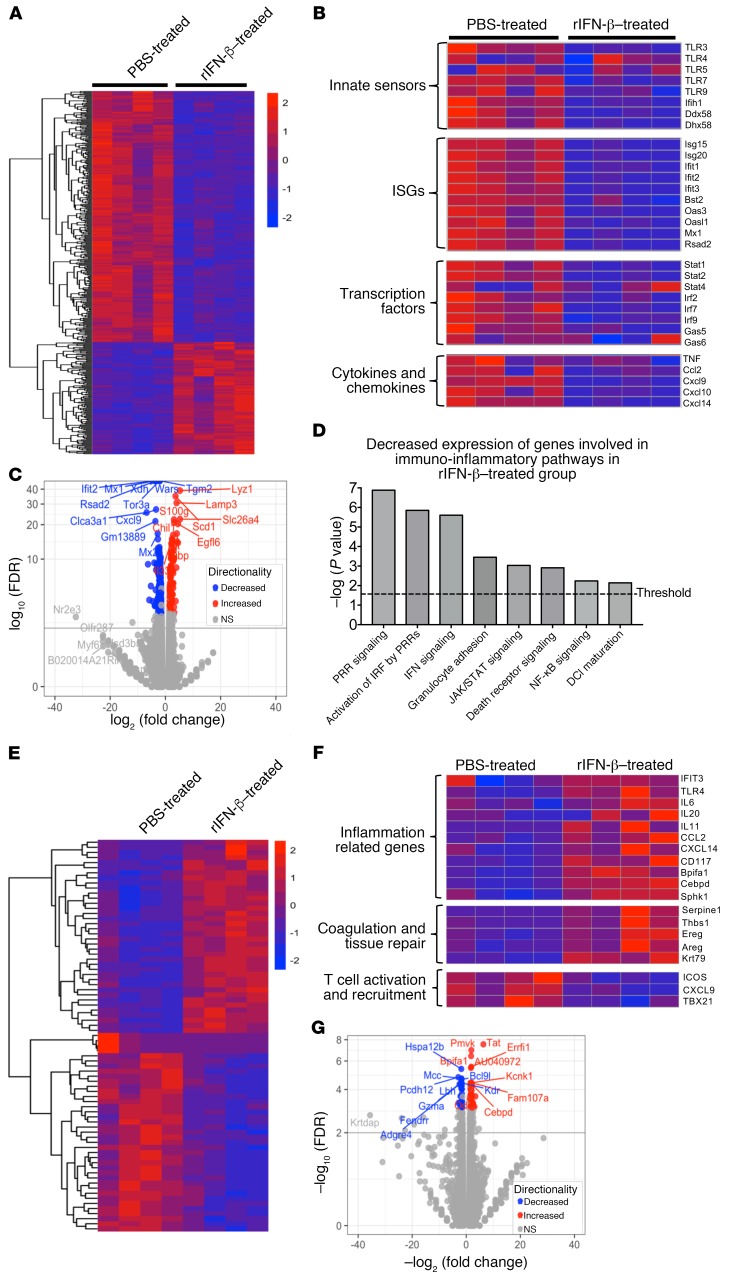
Type 1 IFNs (IFN-I) generally protect mammalian hosts from virus infections, but in some cases, IFN-I is pathogenic. Because IFN-I is protective, it is commonly used to treat virus infections for which no specific approved drug or vaccine is available. The Middle East respiratory syndrome-coronavirus (MERS-CoV) is such an infection, yet little is known about the role of IFN-I in this setting. Here, we show that IFN-I signaling is protective during MERS-CoV infection. Blocking IFN-I signaling resulted in delayed virus clearance, enhanced neutrophil infiltration, and impaired MERS-CoV-specific T cell responses. Notably, IFN-I administration within 1 day after infection (before virus titers peak) protected mice from lethal infection, despite a decrease in IFN-stimulated gene (ISG) and inflammatory cytokine gene expression. In contrast, delayed IFN-β treatment failed to effectively inhibit virus replication, increased infiltration and activation of monocytes, macrophages, and neutrophils in the lungs, and enhanced proinflammatory cytokine expression, resulting in fatal pneumonia in an otherwise sublethal infection. Together, these results suggest that the relative timing of the IFN-I response and maximal virus replication is key in determining outcomes, at least in infected mice. By extension, IFN-αβ or combination therapy may need to be used cautiously to treat viral infections in clinical settings.

Keywords: Infectious disease; Innate immunity; Monocytes; Mouse models; Virology.


Conflict of interest statement

Conflict of interest: The authors have declared that no conflict of interest exists.

Figures

Figure 1
Figure 1. IFN-I signaling is protective during MERS-CoV infection.
(A) Percentage of initial weight and survival of control- and α-IFNAR–treated mice after i.n. infection with 1 × 10⁵ PFU MERS-CoV-EMC. (B) MERS-CoV-EMC titers in the lungs determined by plaque assay at 2 and 5 dpi. (CE) Percentage of initial weight and survival of control and α-IFNAR–treated mice after i.n. infection with 500 PFU (C) or 200–250 PFU (D, female mice; E, male mice) MERS-CoV-MA. (F and G) MERS-CoV titers as determined by plaque assays (F) and gRNA levels (G) in the lungs of control and α-IFNAR–treated mice infected with 200 to 250 PFU MERS-CoV-MA. (H) MERS-CoV-MA titers in the indicated organs at 4 dpi as determined by plaque assay. (I) Representative H&E staining of lungs collected from naive (top panel) and MERS-CoV-MA–challenged mice at 7 dpi, demonstrating lung edema and neutrophil infiltration (middle panels) and cellular proliferation (bottom panels). Original magnification, ×4 and ×20. Arrows point to neutrophils; arrowheads show cell proliferation; asterisk indicates edema. (J) Summary scores for cellular proliferation and neutrophil distribution. Data are representative of 2 independent experiments (AC, and GI) or were pooled from 2 independent experiments (DF and J) (n = 3 to 5 mice/group). *P ≤ 0.05, **P ≤ 0.01, and ***P ≤ 0.001 (B, FH, and J), by 2-tailed Student’s t test. Statistical significance for survival studies (A and CE) was calculated using a log-rank (Mantel-Cox) test with a 95% CI and a P value of less than 0.05 considered significant.
Figure 2
Figure 2. Viral RNA sensing and IFN-I production in MERS-CoV–infected mice.
(A) Lung virus titers and IFN mRNA levels in lungs from hDPP4-KI mice at different time points after MERS-CoV-MA infection (200–250 PFU). (B) Schematic diagram demonstrating the experimental plan to examine MERS-CoV-MA RNA sensing and IFN induction. (C and D) Transcript levels of IFN-α4, IFN-β, and IFN-λ relative to the housekeeping gene HPRT in the lungs at 0, 1, and 2 dpi with MERS-CoV-EMC infection (1 × 10⁵ PFU) in Ad5-hDPP4–transduced WT and TLR7–/– mice (C) and Ad5-hDPP4–transduced WT and MAVS–/– mice (D). Data are representative of 2 independent experiments, with 4 to 5 mice/group/experiment. *P ≤ 0.05, **P ≤ 0.01, and ***P ≤ 0.001, ****P ≤ 0.0001 by 2-tailed Student’s t test.
Figure 3
Figure 3. Immune cell and cytokine and chemokine responses to MERS-CoV-MA infection.
(A) Representative FACS plots and (B) quantification of CD11b+Ly6Chi IMMs in the lungs of control- and α-IFNAR–treated mice following MERS-CoV-MA infection (200–250 PFU). (C) Representative FACS plots and (D) quantification of Ly6Chi Ly6G+ neutrophils in the lungs of control and α-IFNAR–treated mice following MERS-CoV-MA infection. (E and F) mRNA levels of IFNs, ISGs, and cytokines and chemokines on different days after MERS-CoV-MA infection in control and α-IFNAR lungs. (G) MERS-CoV–specific CD4+ and CD8+ T cells in lungs from control and α-IFNAR–treated mice were identified on the basis of IFN-γ production in response to stimulation with either N99 or S1165 peptide 7 dpi. (H) MERS-CoV-MA titers in control and CD4+ and CD8+ T cell–depleted lungs 7 dpi. Data were either pooled from 2 independent experiments (B and D) or are representative of 2 independent experiments (EH) with 3 to 5 mice/group/experiment. *P ≤ 0.05, **P ≤ 0.01, and ***P ≤ 0.001, by 2-tailed Student’s t test.
Figure 4
Figure 4. IFNAR signaling on hematopoietic cells is essential for host protection from MERS-CoV-MA infection.
(A) Percentage of initial weight and survival of BM chimeric mice after MERS-CoV-MA challenge (500 PFU, i.n.). Data were pooled from 2 independent experiments with 3 to 5 mice/group/experiment. (B) MERS-CoV gRNA levels in lungs from BM chimeric mice at 2 and 6 dpi. (C and D) mRNA levels of IFNs and ISGs (C) and inflammatory cytokines and chemokines (D) in lungs from MERS-CoV–infected BM chimeric mice (hDPP4-KI hDPP4-KI and IFNAR–/– hDPP4-KI). (A) Weight loss and survival curves show pooled data from 2 independent experiments (n = 4 to 5 mice/group/experiment). Statistical significance for survival studies in A was calculated using the log-rank (Mantel-Cox) test with a 95% CI and a P value of less than 0.05 considered significant. (BD) Graphs show pooled data from 2 independent experiments (n = 2–3 mice/group/experiment). *P ≤ 0.05 and **P ≤ 0.01, by 2-tailed Student’s t test.
Figure 5
Figure 5. Early treatment with rIFN-β protects the host by inhibiting MERS-CoV-MA replication and reducing inflammation.
(A) Schematic diagram of the experimental plan to examine the effects of early rIFN-β treatment following MERS-CoV-MA infection. (B) Percentage of initial weight and survival of MERS-CoV-MA–infected hDPP4-KI mice that received PBS or rIFN-β treatment 6 hours p.i. or 1 dpi. (C) MERS-CoV gRNA levels in the lungs of mice treated with PBS or rIFN-β (1 dpi, early treatment) at 2, 4, and 6 dpi. (D and E) mRNA levels of ISGs (D) and inflammatory cytokines and chemokines (E) in PBS- or rIFN-β–treated (1 dpi) mice. (F and H) Percentage and total number of IMMs and neutrophils in the lungs of PBS- or rIFN-β–treated mice determined at 4 dpi. (G and I) Percentage of CD80-expressing and total number of TNF+ IMMs and neutrophils in lungs from PBS- and rIFN-β–treated mice (1 dpi) at 4 dpi. Data were pooled from 2 separate experiments (BI) or are representative of 2 separate experiments (E, right panel) (n = 4–5 mice/group/experiment). **P ≤ 0.01, ***P ≤ 0.001, and ****P ≤ 0.0001, by 2-tailed Student’s t test. Statistical significance for survival studies in B was calculated using a log-rank (Mantel-Cox) test with a 95% CI and a P value of less than 0.05 considered significant.
Figure 6
Figure 6. Delayed IFN treatment promotes inflammation and mortality in MERS-CoV-MA–infected mice.
(A) Schematic of the experimental plan to examine the effect of delayed rIFN-β treatment. (B) Percentage of initial weight and survival of MERS-CoV-MA–infected hDPP4-KI mice treated with PBS or rIFN-β at 2 or 4 dpi. (C) MERS-CoV titers in the lungs at 3, 5, and 7 dpi in mice treated with PBS or rIFN-β (2 dpi, delayed treatment). (D and E) mRNA levels of ISGs and inflammatory cytokines and chemokines in the lungs of PBS- or rIFN-β–treated (2 dpi, delayed treatment) mice. (F and H) Frequency and number of IMMs and neutrophils in the lungs of PBS- or rIFN-β–treated mice (2 dpi). (G and I) Percentage of CD80-expressing and total number of TNF+ IMMs and neutrophils at 5 dpi in PBS- and rIFN-β–treated mice (2 dpi). (J) Percentage of initial weight and survival of MERS-CoV-MA–infected (200 PFU) hDPP4-KI mice treated with rIFN-β (2 dpi) and either α-CCR2 antibody or a control antibody (2 dpi and 4 dpi). Data were pooled from 2 separate experiments (B and FH, left panels, I, left panel, and J) or are representative of 2 separate experiments (E, G, and I, right 2 panels) (n = 3–5 mice/group/experiment). Data were analyzed using a 2-tailed Student’s t test with *P ≤ 0.05, **P ≤ 0.01, ***P ≤ 0.001, and ****P ≤ 0.0001. Statistical significance for survival studies (B, right) was calculated using the log-rank (Mantel-Cox) test, with a 95% CI and a P value of less than 0.05 considered significant.
Figure 7
Figure 7. RNA-Seq analyses of gene expression profile in MERS-CoV-MA–infected lungs with early or delayed rIFN-β treatment.
hDPP4-KI mice infected with MERS-CoV-MA (200 PFU) were treated with 750 U rIFN-β at 1 dpi (early, AD) or 2 dpi (delayed, EH). Mice were euthanized 2 days after rIFN-β treatment (3 dpi for mice in the early rIFN-β treatment and 4 dpi for mice in the delayed rIFN-β treatment groups). RNA isolated from total lungs was used for RNA-Seq studies. (A and B) Heatmaps of differential gene expression profiles in lungs from PBS-treated compared with early rIFN-β–treated mice display all transcripts (A) and selected innate immune pathways (B). (C) Volcano plot with log2 fold change and log10 P values for differentially expressed genes in lungs from mice treated with PBS compared with mice treated early with rIFN-β. (D) Major innate immune pathways differentially regulated in control and early rIFN-β treatment groups identified by pathway analysis. Results show decreased expression of several proinflammatory mediators after rIFN-β treatment. (E and F) Heatmaps of differential gene expression in lungs from mice treated with PBS compared with mice that received delayed rIFN-β treatment, displaying all transcripts (E) and selected innate immune genes (F). (G) Volcano plot with log2 fold change and log10 P values for differentially expressed genes in lungs from PBS-treated compared with delayed rIFN-β–treated mice. Red indicates upregulation; blue indicates downregulation. Data were derived from 4 mice per group, with a FDR-adjusted P value of less than 0.001 and a log2 fold change of greater than 1.5.

References

    1. Bloom DE, Black S, Rappuoli R. Emerging infectious diseases: a proactive approach. Proc Natl Acad Sci U S A. 2017;114(16):4055–4059. doi: 10.1073/pnas.1701410114. - DOI - PMC - PubMed
    1. Assiri A, et al. Hospital outbreak of Middle East respiratory syndrome coronavirus. N Engl J Med. 2013;369(5):407–416. doi: 10.1056/NEJMoa1306742. - DOI - PMC - PubMed
    1. Peiris JS, et al. Coronavirus as a possible cause of severe acute respiratory syndrome. Lancet. 2003;361(9366):1319–1325. doi: 10.1016/S0140-6736(03)13077-2. - DOI - PMC - PubMed
    1. Su S, et al. Epidemiology, genetic recombination, and pathogenesis of coronaviruses. Trends Microbiol. 2016;24(6):490–502. doi: 10.1016/j.tim.2016.03.003. - DOI - PMC - PubMed
    1. Assiri A, et al. Epidemiological, demographic, and clinical characteristics of 47 cases of Middle East respiratory syndrome coronavirus disease from Saudi Arabia: a descriptive study. Lancet Infect Dis. 2013;13(9):752–761. doi: 10.1016/S1473-3099(13)70204-4. - DOI - PMC - PubMed

Publication types

MeSH terms