

Deformable abdominal phantom for the validation of real-time image guidance and deformable dose accumulation
- PMID: 31355997
- PMCID: PMC6698755
- DOI: 10.1002/acm2.12687
Deformable abdominal phantom for the validation of real-time image guidance and deformable dose accumulation
Abstract
Purpose: End-to-end testing with quality assurance (QA) phantoms for deformable dose accumulation and real-time image-guided radiotherapy (IGRT) has recently been recommended by American Association of Physicists in Medicine (AAPM) Task Groups 132 and 76. The goal of this work was to develop a deformable abdominal phantom containing a deformable three-dimensional dosimeter that could provide robust testing of these systems.
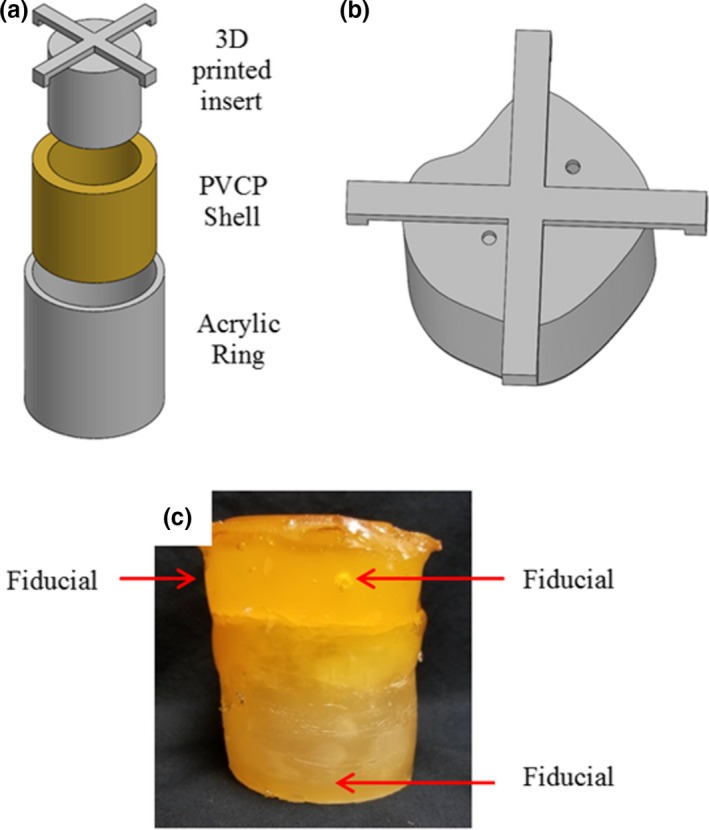
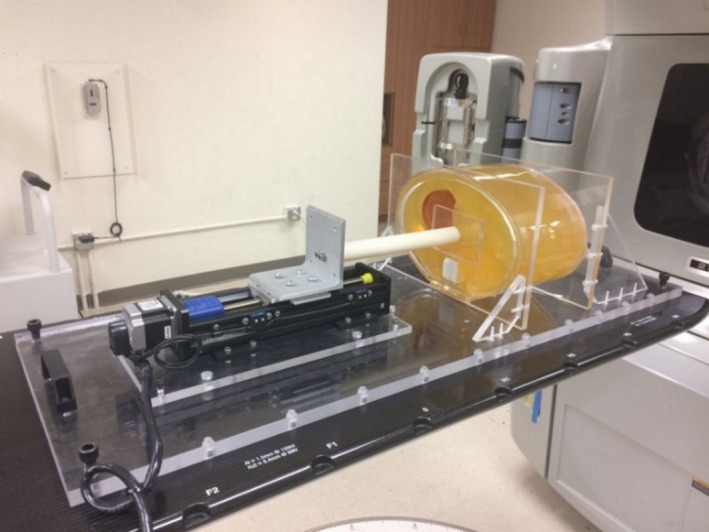
Methods: The deformable abdominal phantom was fabricated from polyvinyl chloride plastisol and phantom motion was simulated with a programmable motion stage and plunger. A deformable normoxic polyacrylamide gel (nPAG) dosimeter was incorporated into the phantom apparatus to represent a liver tumor. Dosimeter data were acquired using magnetic resonance imaging (MRI). Static measurements were compared to planned dose distributions. Static and dynamic deformations were used to simulate inter- and intrafractional motion in the phantom and measurements were compared to baseline measurements.
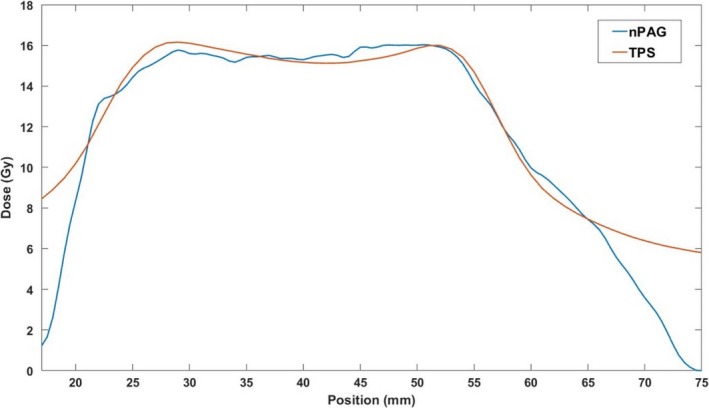
Results: The statically irradiated dosimeters matched the planned dose distribution with an average γ pass rates of 97.0 ± 0.5% and 97.5 ± 0.2% for 3%/5 mm and 5%/5 mm criteria, respectively. Static deformations caused measured dose distribution shifts toward the phantom plunger. During the dynamic deformation experiment, the dosimeter that utilized beam gating showed an improvement in the γ pass rate compared to the dosimeter that did not.
Conclusions: A deformable abdominal phantom apparatus which incorporates a deformable nPAG dosimeter was developed to test real-time IGRT systems and deformable dose accumulation algorithms. This apparatus was used to benchmark simple static irradiations in which it was found that measurements match well to the planned distributions. Deformable dose accumulation could be tested by directly measuring the shifts and blurring of the target dose due to interfractional organ deformation and motion. Dosimetric improvements were achieved from the motion management during intrafractional motion.
Keywords: Deformable dose accumulation; motion management; phantoms; three-dimensional dosimetry.
© 2019 The Authors. Journal of Applied Clinical Medical Physics published by Wiley Periodicals, Inc. on behalf of American Association of Physicists in Medicine.
Conflict of interest statement
This work was partially funded by NIH grant R01CA190298. Bryan Bednarz is a Co‐Founder and CSO of Voximetry, LLC, but this did not affect the work presented in this manuscript. None of the other authors have any other conflicts of interest to disclose.
Figures


References
-
- Jaffray DA. Image‐guided radiotherapy: from current concept to future perspectives. Nat Rev Clin Oncol. 2012;9:688–699. - PubMed
-
- von Siebenthal M, Székely G, Lomax A, Cattin P. Inter‐subject modelling of liver deformation during radiation therapy. Med Image Comput Comput Assist Interv. 2007;10:659–666. - PubMed
-
- Balter JM, Ten Haken RK, Lawrence TS, Lam KL, Robertson JM. Uncertainties in CT‐based radiation therapy treatment planning associated with patient breathing. Int J Radiat Oncol Biol Phys. 1996;36:167–174. - PubMed
-
- Suramo I, Päivänsalo M, Myllylä V. Cranio‐caudal movements of the liver, pancreas and kidneys in respiration. Acta Radiol Diagn (Stockh). 1984;25:129–131. - PubMed
-
- Brock KK, Dawson LA, Sharpe MB, Moseley DJ, Jaffray DA. Feasibility of a novel deformable image registration technique to facilitate classification, targeting, and monitoring of tumor and normal tissue. Int J Radiat Oncol Biol Phys. 2006;64:1245–1254. - PubMed
MeSH terms
Grants and funding
LinkOut - more resources
Full Text Sources
Other Literature Sources
