. 2019 Nov;33(11):11682-11695.
doi: 10.1096/fj.201900662R. Epub 2019 Aug 7.

Evidence for shared molecular pathways of dysregulated decidualization in preeclampsia and endometrial disorders revealed by microarray data integration

Affiliations

Evidence for shared molecular pathways of dysregulated decidualization in preeclampsia and endometrial disorders revealed by microarray data integration

Maria Belen Rabaglino et al. FASEB J. 2019 Nov.

Abstract

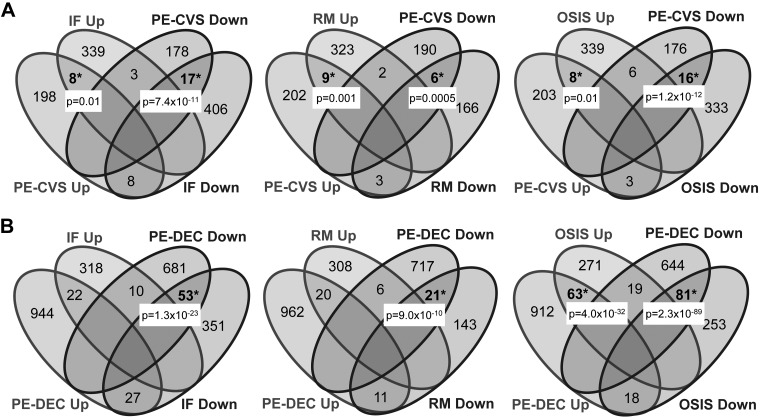
Microarray data of chorionic villous samples (CVSs) obtained from women of ∼11.5 gestational weeks who developed preeclampsia with severe features (sPE; PE-CVS) revealed a molecular signature of impaired endometrial maturation (decidualization) before and during early pregnancy. Because endometrial disorders are also associated with aberrant decidualization, we asked whether they share molecular features with sPE. We employed microarray data integration to compare the molecular pathologies of PE-CVS and endometrial disorders, as well as decidua obtained postpartum from women with sPE. Eight public databases were reanalyzed with R software to determine differentially expressed genes (DEGs) in pathologic tissues relative to normal controls. DEGs were then compared to explore overlap. Shared DEGs were examined for enriched Kyoto Encyclopedia of Genes and Genomes (KEGG) pathways. Principal component and network analyses were subsequently applied to selected DEGs. There was significant overlap of DEGs changing in the same direction for PE-CVS and endometrial disorders, suggesting common molecular pathways. Shared DEGs were enriched for cytokine-cytokine receptor interaction. Genes in this pathway revealed expression patterns forming 2 distinct clusters, one for normal and the other pathologic endometrium. The most affected hub genes were related to decidualization and NK cell function. Few DEGs were shared by PE-CVS, and PE decidua obtained postpartum. sPE may be part of a biologic continuum of "endometrial spectrum disorders."-Rabaglino, M. B., Conrad, K. P. Evidence for shared molecular pathways of dysregulated decidualization in preeclampsia and endometrial disorders revealed by microarray data integration.

Keywords: endometriosis; implantation failure; pregnancy; recurrent miscarriage; transcriptomics.


Conflict of interest statement

The authors acknowledge Dr. Matthew Dyson (Feinberg School of Medicine, Northwestern University, Chicago, IL, USA), for providing the microarray data set on endometriosis. This work was partly supported by U.S. Institutes of Health, Eunice Kennedy Shriver National Institute of Child Health and Human Development Grant P01 HD065647 (to K.P.C.). Portions were published in abstract form (70, 71). The authors declare no conflicts of interest.

Figures

Figure 1
Figure 1
Overview of the methodology. The flowchart presents an overview of the major procedures employed in this study, and their purpose.
Figure 2
Figure 2
DEGs between PE-CVSs relative to NP-CVSs (A), PE-DEC relative to NP-DEC (B), compared to DEGs associated with normal (pre)decidualization and PE-CVSs relative to NP-CVSs compared to PE-DEC relative to NP-DEC (C). The Venn diagrams show significant overlap between up-regulated DEGs in PE-CVSs (A) and PE-DEC (B) and down-regulated DEGs in LSE (relative to PrE) and ∼9 wk gestational endometrium with DEC (relative to non-DEC). The opposite is also observed. Taken together, many DEGs observed between PE-CVSs and NP-CVSs and between PE-DEC and NP-DEC changed in the opposite direction to DEGs associated with normal endometrial maturation. The Venn diagram shows significant overlap between DEGs changing in the same direction in PE-CVSs relative to NP-CVSs and PE-DEC relative to NP-DEC (C). *P < 0.05 (Pearson’s χ2 test).
Figure 3
Figure 3
DEGs between PE-CVSs relative to NP-CVSs (A) and PE-DEC relative to NP-DEC (B) compared to DEGs associated with endometrial disorders relative to healthy endometrium. The Venn diagrams show significant overlap between up-regulated or down-regulated DEGs in PE-CVSs relative to NP-CVSs (A) and PE-DEC relative to NP-DEC (B), with DEGs up-regulated or down-regulated in secretory endometrium from women with recurrent IF and secretory endometrium from women with RM—both relative to FCs, and ESCs isolated from ovarian OSIS that were cultured and decidualized in vitro in comparison to ESCs from normal endometrial tissues. Taken together, many DEGs observed between PE-CVSs and NP-CVSs and between PE-DEC and NP-DEC changed in the same direction as DEGs associated with endometrial pathologies. For other abbreviations, see Fig. 1. *P < 0.05 (Pearson’s χ2 test).
Figure 4
Figure 4
DEGs between PE-CVSs relative to NP-CVSs (A) and PE-DEC relative to NP-DEC (B) compared to DEGs associated with late gestation decidua in women who developed sPE relative to normal pregnancy. The Venn diagrams show no significant overlap between up-regulated or down-regulated DEGs in PE-CVSs relative to NP-CVSs (A) and PE-DEC relative to NP-DEC (B), with DEGs up-regulated or down-regulated in decidua basalis or basal plate obtained after delivery from women who experienced either sPE or normal pregnancy. PE- and NP-DB tissues were obtained by placental bed biopsy after cesarean section. PE- and NP-BP tissues were harvested from delivered placentas. For other abbreviations, see Fig. 1.
Figure 5
Figure 5
PCA of endometrial samples using the expression of genes belonging to the cytokine-cytokine receptor interaction pathway. Principal component plots show that normal endometrial samples obtained from healthy women (shades of green, n = 36) and late gestation endometrium from women with PE (shades of pink, n = 8) or normal pregnancies (shades of yellow, n = 8) formed a distinct cluster, whereas endometrial samples from women with pathologic endometrium (shades of red, n = 25) and samples from non-DEC or PrE (shades of blue, n = 9) formed another distinct cluster. The analysis was applied to 264 genes belonging to the cytokine-cytokine receptor interaction pathway. PE- and NP-DB tissues were obtained by placental bed biopsy after cesarean section. PE- and NP-BP tissues were harvested from delivered placentas.
Figure 6
Figure 6
Genes that are part of the 20 top hub genes from each of the networks shown in Supplemental Fig. S3, appearing in at least 2 conditions, presented as list (A) or network (B). Genes are classified according to the direction of change in healthy or pathologic endometrial conditions compared to their respective controls regardless of the statistical significance. Genes highlighted in yellow are those whose direction of change is down-regulated in the healthy endometrial conditions (LSE and DEC) but up-regulated in pathologic endometrial conditions (IF, RM, OSIS, PE-CVSs, and PE-DEC). Genes highlighted in blue are those that are up-regulated in the healthy endometrial conditions but down-regulated in the pathologic endometrial conditions. Genes highlighted in orange are those changing in opposite direction between LSE/DEC and IF/RM, whereas those in purple are changing in opposite direction between LSE/DEC and OSIS/PE-CVSs/PE-DEC. Genes highlighted in red are those changing in opposite directions between LSE and IF/RM. Gray genes are those that couldn’t be classified in the categories above. A) The first column lists the gene symbols, whereas the remaining columns (one for each comparison) show the corresponding fold change vs. respective control fold changes greater or <1 are shaded in green and red, respectively. Bold-typed numbers indicate that the fold change is significant at P < 0.1. Cells in black indicate that the gene was not represented in the array. B) Genes are visualized as nodes in a network. Nodes (genes) were associated according to whether they had genetic (blue edges) or physical interactions (purple edges). ESCs were subsequently isolated, cultured and decidualized in vitro. PE- and NP-DB tissues were obtained by placental bed biopsy after cesarean section. PE- and NP-BP tissues were harvested from delivered placentas.

References

    1. Backes C. H., Markham K., Moorehead P., Cordero L., Nankervis C. A., Giannone P. J. (2011) Maternal preeclampsia and neonatal outcomes. J. Pregnancy 2011, 214365 - PMC - PubMed
    1. Ghulmiyyah L., Sibai B. (2012) Maternal mortality from preeclampsia/eclampsia. Semin. Perinatol. 36, 56–59 - PubMed
    1. Hutcheon J. A., Lisonkova S., Joseph K. S. (2011) Epidemiology of pre-eclampsia and the other hypertensive disorders of pregnancy. Best Pract. Res. Clin. Obstet. Gynaecol. 25, 391–403 - PubMed
    1. Page E. W. (1972) On the pathogenesis of pre-eclampsia and eclampsia. J. Obstet. Gynaecol. Br. Commonw. 79, 883–894 - PubMed
    1. Pijnenborg R., Vercruysse L., Hanssens M., Brosens I. (2011) Endovascular trophoblast and preeclampsia: a reassessment. Pregnancy Hypertens. 1, 66–71 - PubMed

Publication types