. 2019 Jan 15;3(1):13-25.
doi: 10.4049/immunohorizons.1800083.

IL-27 and TCR Stimulation Promote T Cell Expression of Multiple Inhibitory Receptors

Affiliations

IL-27 and TCR Stimulation Promote T Cell Expression of Multiple Inhibitory Receptors

Jonathan H DeLong et al. Immunohorizons. .

Abstract

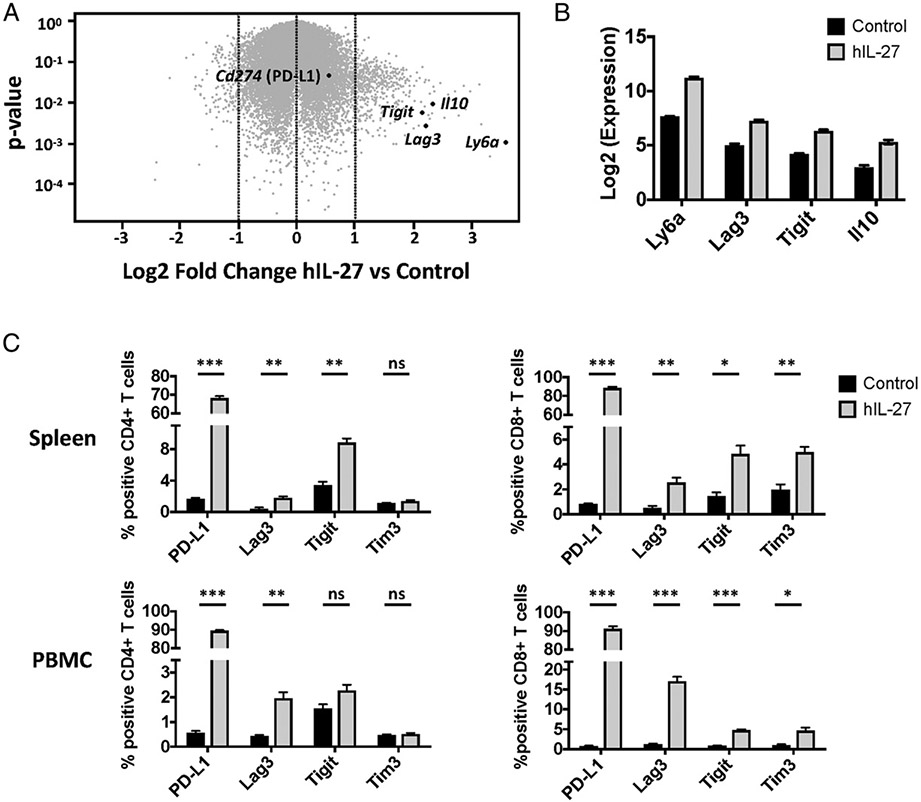
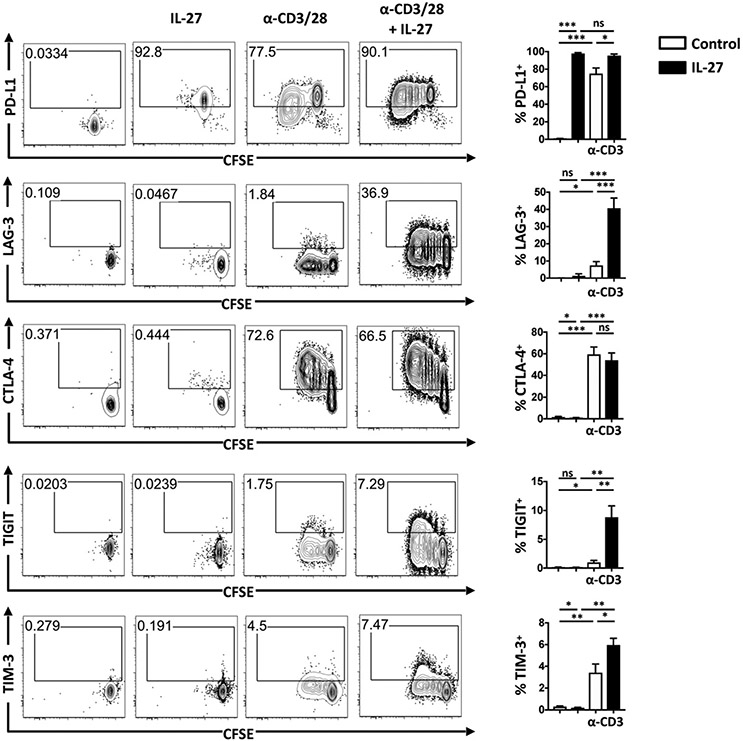
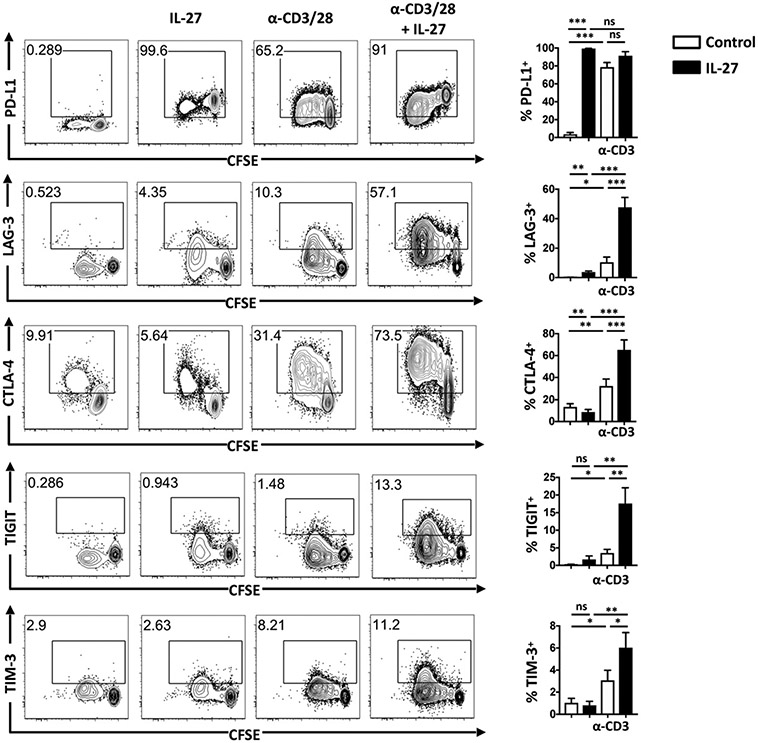
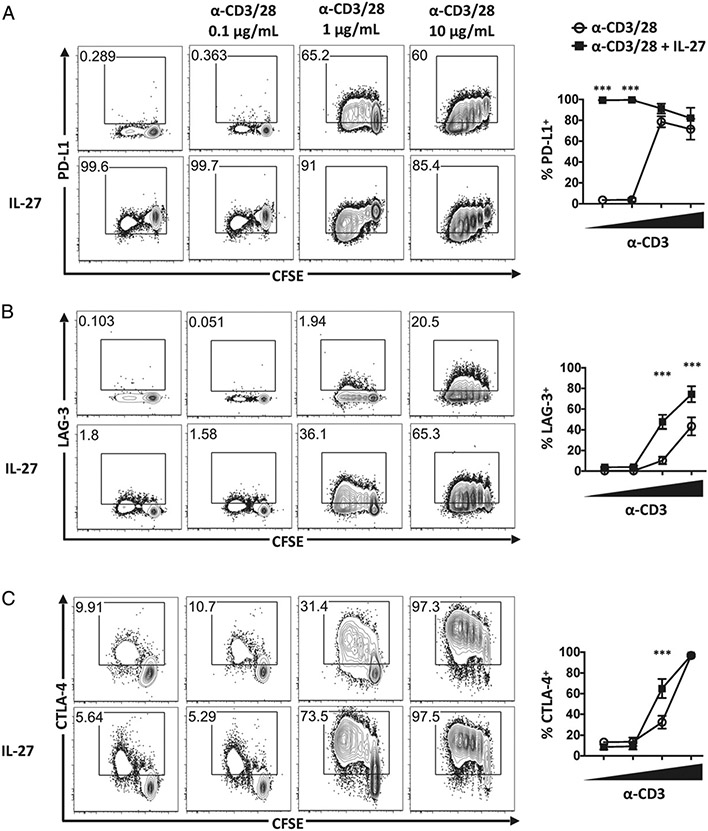
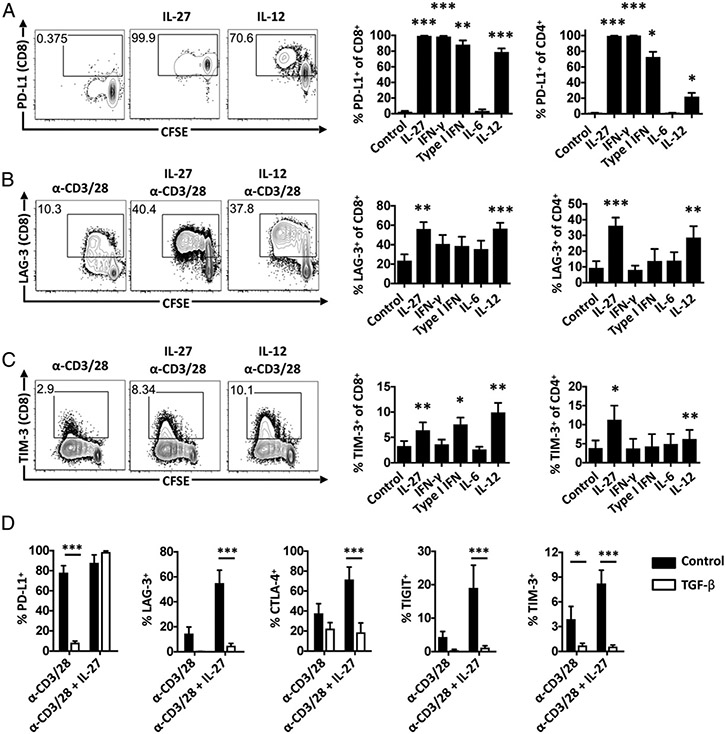
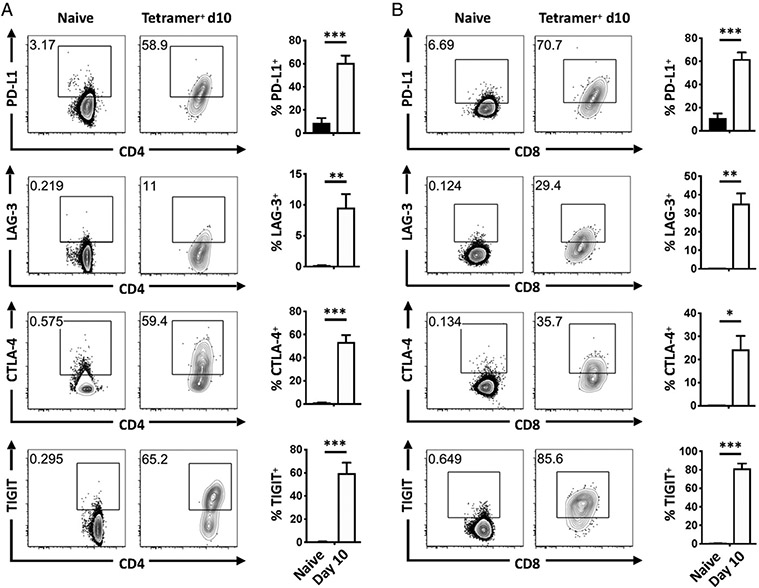
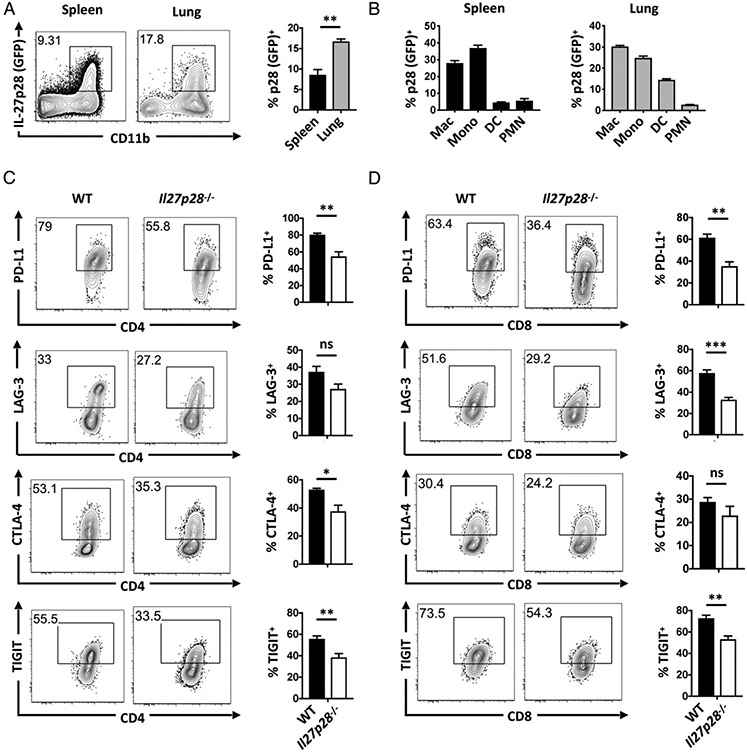
Inhibitory receptors (IR) are a diverse group of cell surface molecules that modulate T cell activation, but there are gaps in our knowledge of the cell-extrinsic factors that regulate their expression. The present study found that in vivo overexpression of IL-27 in mice led to increased T cell expression of PD-L1, LAG-3, TIGIT, and TIM-3. In vitro, TCR stimulation alone promoted expression of multiple IRs, whereas IL-27 alone induced expression of PD-L1. However, the combination of intermediate TCR stimulation and IL-27 resulted in synergistic induction of LAG-3, CTLA-4, and TIGIT. In vivo, infection with Toxoplasma gondii resulted in parasite-specific effector T cells that expressed high levels of IR, and at local sites of infection where IL-27 production was highest, IL-27 was required for maximal effector cell expression of PD-L1, LAG-3, CTLA-4, and TIGIT. Together, these results affirm the critical role of TCR signals in the induction of IR expression but find that during infection, IL-27 promotes T cell expression of IR.


Conflict of interest statement

DISCLOSURES

C.A.H. is a member of the Scientific Advisory Board and Scientific Founder of Surface Oncology. The other authors have no financial conflicts of interest.

Figures

FIGURE 1.
FIGURE 1.. Overexpression of IL-27 upregulates expression of multiple IR by T cells in vivo.
(AC) Mice were treated with IL-27 minicircles, and then splenocytes were analyzed by microarray. (A) Volcano plot showing cutoff of genes modulated by log2 fold change >1.0. Genes of interest are highlighted in red. (B) Expression of select immunomodulatory genes. (C) Mice were treated with IL-27 minicircles and IR expression by CD4+ and CD8+ T cells from spleens, and PBMC was assessed by flow cytometry. Three mice per group. Error bars indicate SEM. Statistical significance was determined by using Student t test. ns; p > 0.05, *p < 0.05, **p < 0.01,***p < 0.001.
FIGURE 2
FIGURE 2. IL-27 induces expression of multiple IR by CD4+ T cells.
Naive Ly6CSca-1 CD4+ and T cells were sort purified and cultured in the presence or absence of α-CD3/28, in the presence or absence of IL-27. After an 85-h culture, cells were analyzed for expression of PD-L1, PD-1, LAG-3, and CTLA-4. Representative FACS plots (left). Bar charts (right) show combined results from four independent experiments. Error bars indicate SEM. Statistical significance was determined by using Student t test. ns; p > 0.05, *p < 0.05, **p < 0.01, ***p < 0.001.
FIGURE 3.
FIGURE 3.. IL-27 induces expression of multiple IR by CD8+ T cells.
Naive, Ly6CSca-1 CD8+ and T cells were sort purified and cultured in the presence or absence of α-CD3/28, in the presence or absence of IL-27. After an 85-h culture, cells were analyzed for expression of PD-L1, PD-1, LAG-3, and CTLA-4. Representative FACS plots (left). Bar charts (right) show combined results from four independent experiments. Error bars indicate SEM. Statistical significance was determined by using Student t test. ns; p > 0.05, *p < 0.05, **p < 0.01, ***p < 0.001.
FIGURE 4.
FIGURE 4.. Role of IL-27 in expression of PD-L1, LAG-3, and CTLA-4 depends on strength of α-CD3/28 signaling.
Naive Ly6C Sca-1 CD8+ T cells were sorted and cultured in the absence of α-CD3/CD28 or stimulated with 0, 0.1, 1, or 10 μg/ml plate-bound α-CD3 and 1 μg/ml soluble α-CD28 for 84 h. Cells were assessed for expression of PD-L1 (A), LAG-3 (B), and CTLA-4 (C). Representative flow plots (left). Graphs display the results of three to five independent experiments (right). Error bars indicate SEM. Statistical significance of differences between IL-27–treated and non–IL-27–treated cells was determined using a paired Student t test. *p < 0.05, **p < 0.01, ***p < 0.001.
FIGURE 5.
FIGURE 5.. Modulation of IR by multiple cytokines.
(A) Sorted naive CD4+ and CD8+ T cells were cultured with the indicated cytokines and assessed for expression of PD-L1. (B and C) Sorted naive CD4+ and CD8+ T cells were cultured with anti-CD3/28 stimulation and the indicated cytokines and were assessed for expression of LAG-3 (B) and TIM-3 (C). Representative flow plots for control, IL-27, and IL-12 conditions (left). Summary bar charts (right). (D) TGF-β inhibits IL-27–mediated IR expression in naive CD8+ T cells. Bar charts summarize results of two to four independent experiments. Error bars indicate SEM. Statistical significance of cytokine versus control determined by paired Student t test. ns; p > 0.05, *p < 0.05, **p < 0.01, ***p < 0.001.
FIGURE 6.
FIGURE 6.. IR expression is upregulated during toxoplasmosis.
(A and B) IR expression by splenic CD4+ (A) and CD8+ (B) T cells in naive mice (gated LFA-1lo) or at day 10 of infection (gated LFA-1hi tetramer+). Representative flow plots (left) and bar charts (right) showing pooled data from four to six independent experiments, one mouse per experiment. Error bars indicate SEM. *p < 0.05, **p < 0.01, ***p < 0.001.
FIGURE 7.
FIGURE 7.. IL-27 contributes to IR expression by lung T cells during toxoplasmosis.
(A) Il27p28-GFP reporter mice were infected with 20 Me49 cysts i.p. for 10 d. p28-GFP was examined on nonlymphocytes (CD3NK1.1B220 CD19) within the spleen (black bars) and lung (gray bars). (B) Within nonlymphocytes, p28-GFP expression was examined in macrophages (CD11b+CD64+Ly6GloF4/80+Ly6Clo), monocytes (CD11b+CD64+Ly6GloLy6Chi), DC (CD64CD11c+MHCII+), and polymorphonuclear cells (CD11b+CD11cCD64Ly6cintLy6G+) in the spleen (left) and lung (right). (C and D) WT and Il27p28−/− mice were infected with 20 Me49 cysts i.p. for 11–12 d. IR expression by WT (black bars) and Il27p28−/− (white bars) lung tetramer+ CD4+ (B) and CD8+ (C) T cells. Three to five mice per group. Data representative of one (A) or four (B and C) independent experiments. Error bars indicate SEM. *p < 0.05, **p < 0.01, ***p < 0.001.

References

    1. Chen L, and Flies DB. 2013. Molecular mechanisms of T cell co-stimulation and co-inhibition. [Published erratum appears in 2013 Nat. Rev. Immunol. 13: 542.] Nat. Rev. Immunol 13: 227–242. - PMC - PubMed
    1. Blackburn SD, Shin H, Haining WN, Zou T, Workman CJ, Polley A, Betts MR, Freeman GJ, Vignali DA, and Wherry EJ. 2009. Coregulation of CD8+ T cell exhaustion by multiple inhibitory receptors during chronic viral infection. Nat. Immunol 10: 29–37. - PMC - PubMed
    1. Odorizzi PM, and Wherry EJ. 2012. Inhibitory receptors on lymphocytes: insights from infections. J. Immunol 188: 2957–2965. - PMC - PubMed
    1. Pardoll DM 2012. The blockade of immune checkpoints in cancer immunotherapy. Nat. Rev. Cancer 12: 252–264. - PMC - PubMed
    1. Latchman YE, Liang SC, Wu Y, Chernova T, Sobel RA, Klemm M, Kuchroo VK, Freeman GJ, and Sharpe AH. 2004. PD-L1-deficient mice show that PD-L1 on T cells, antigen-presenting cells, and host tissues negatively regulates T cells. Proc. Natl. Acad. Sci. USA 101: 10691–10696. - PMC - PubMed

Publication types

MeSH terms