. 2019 Dec;160(12):2751-2765.
doi: 10.1097/j.pain.0000000000001666.

Brain dysfunction in chronic pain patients assessed by resting-state electroencephalography

Affiliations

Brain dysfunction in chronic pain patients assessed by resting-state electroencephalography

Son Ta Dinh et al. Pain. 2019 Dec.

Erratum in

Abstract

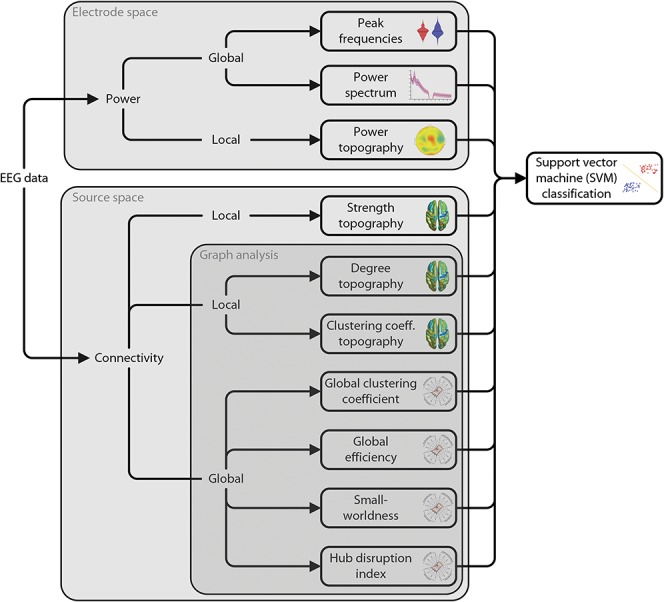
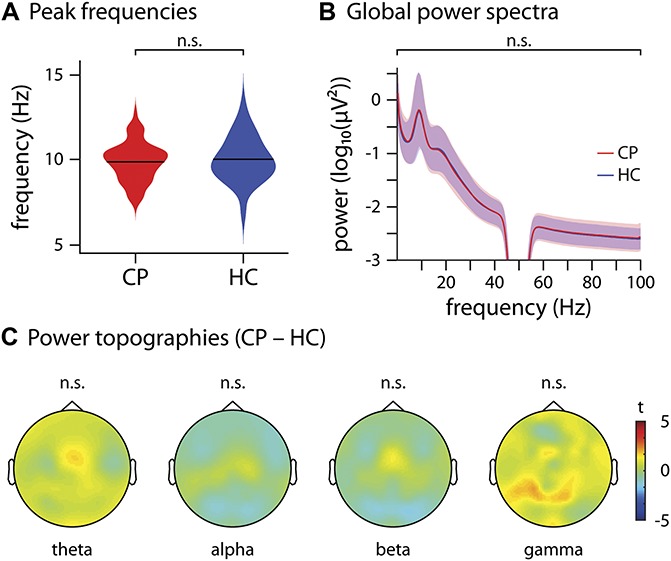
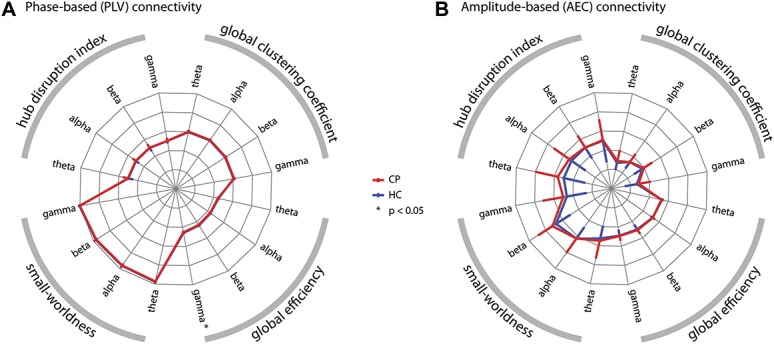
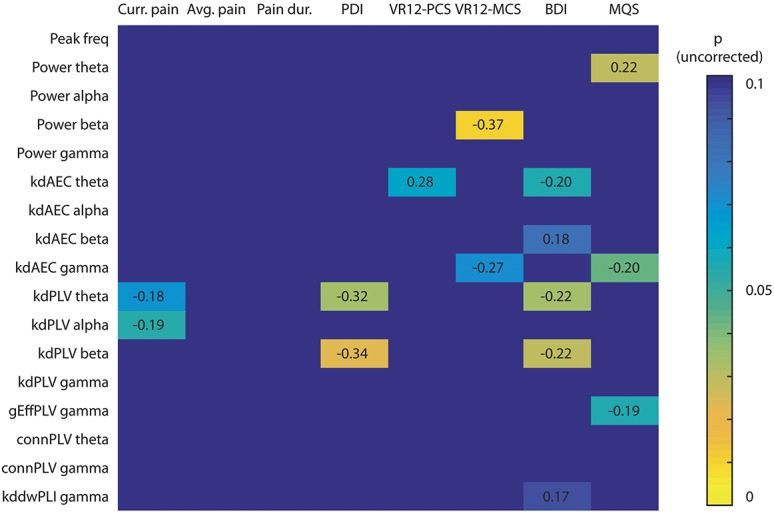
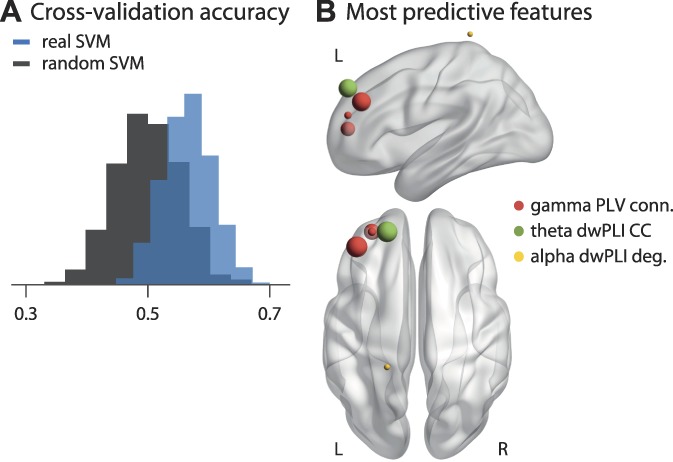
Chronic pain is a common and severely disabling disease whose treatment is often unsatisfactory. Insights into the brain mechanisms of chronic pain promise to advance the understanding of the underlying pathophysiology and might help to develop disease markers and novel treatments. Here, we systematically exploited the potential of electroencephalography to determine abnormalities of brain function during the resting state in chronic pain. To this end, we performed state-of-the-art analyses of oscillatory brain activity, brain connectivity, and brain networks in 101 patients of either sex suffering from chronic pain. The results show that global and local measures of brain activity did not differ between chronic pain patients and a healthy control group. However, we observed significantly increased connectivity at theta (4-8 Hz) and gamma (>60 Hz) frequencies in frontal brain areas as well as global network reorganization at gamma frequencies in chronic pain patients. Furthermore, a machine learning algorithm could differentiate between patients and healthy controls with an above-chance accuracy of 57%, mostly based on frontal connectivity. These results suggest that increased theta and gamma synchrony in frontal brain areas are involved in the pathophysiology of chronic pain. Although substantial challenges concerning the reproducibility of the findings and the accuracy, specificity, and validity of potential electroencephalography-based disease markers remain to be overcome, our study indicates that abnormal frontal synchrony at theta and gamma frequencies might be promising targets for noninvasive brain stimulation and/or neurofeedback approaches.


Conflict of interest statement

The authors have no conflicts of interest to declare.

Sponsorships or competing interests that may be relevant to content are disclosed at the end of this article.

Figures

Figure 1.
Figure 1.
Analysis pipeline. Electroencephalography data were analyzed with regards to power and connectivity, which quantify neural activity and neural communication, respectively. Power analyses were performed in electrode space. Analyses of functional connectivity were performed in source space. Connectivity analyses comprised phase-based (PLV, dwPLI) and amplitude-based (AEC) connectivity measures. Graph–theoretical network analysis was applied to further characterize functional connectivity. All measures were compared between chronic pain patients and healthy controls. In addition, a purely data-driven machine learning approach was adopted, using SVMs. The SVM was trained on all power and connectivity measures to distinguish between chronic pain patients and healthy controls. dwPLI, debiased weighted phase lag index; PLV, phase locking value; SVM, support vector machine.
Figure 2.
Figure 2.
Global and local measures of brain activity. (A) Violin plot of the dominant peak frequencies computed on the average across all electrodes of chronic pain patients (CP, red) and healthy controls (HC, blue). A nonparametric permutation test showed no significant difference (P = 0.20) between the 2 groups. (B) Global power spectra of CP (red) and HC (blue), averaged across all electrodes and shown for the frequencies 1 to 100 Hz, with a bandstop filter at 45 to 55 Hz to remove line noise. A cluster-based permutation test clustered across frequencies did not show any significant differences (t_max/min = 1.7/−1.5). (C) Scalp topographies of power differences between CP and HC at theta, alpha, beta, and gamma frequencies, averaged across frequencies in each band. The colormap shows the t-values of a cluster-based permutation test. No significant clusters were found in any frequency band (theta t_max/min = 1.5/−0.6, alpha t_max/min = 0.62/−1.2, beta t_max/min = 1.0/−1.4, gamma t_max/min = 2.1/−0.7).
Figure 3.
Figure 3.
Local measures of functional connectivity. Brain topographies of the comparison of connectivity strength between chronic pain patients (CP) and healthy controls (HC) in the theta, alpha, beta, and gamma band frequencies, averaged across frequencies in each band, are shown. Connectivity strength was calculated as the average connectivity of one voxel to all other voxels of the brain. The colormaps show the t-values. Significant results are masked, ie, all voxels but the ones belonging to a significant cluster are grayed out. When no significant clusters are found, nothing is grayed out to show potential trends. (A) Phase-based connectivity (phase locking value, PLV). A significant increase of chronic pain patients' connectivity strength was observed in the theta band (P [corrected/uncorrected] = 0.045/0.011, t_max = 3.8, Cohen's d = 0.40) and the gamma band (P [corrected/uncorrected] = 0.0072/0.0018, t_max = 5.1, Cohen's d = 0.59). (B) Amplitude-based connectivity (orthogonalized amplitude envelope correlation, AEC). No significant differences were found in any frequency band (theta t_max/min = 0.4/−0.6, alpha t_max/min = 0.1/−0.7, beta t_max/min = −0.3/−1.2, gamma t_max/min = 0.0/−1.1).
Figure 4.
Figure 4.
Global graph theoretical measures of functional connectivity. The radar plots show 4 global graph measures in 4 frequency bands based on (A) phase-based and (B) amplitude-based connectivity measures. The clockwise arrangement follows the following pattern: theta, alpha, beta, and gamma repeated for the 4 graph measures: global clustering coefficient, global efficiency, small-worldness, and absolute values of the hub disruption index. The red lines show the chronic pain patients' (CP) values, whereas the blue lines represent the healthy controls' (HC) values. Error bars show the SD. For visualization purposes, the symmetric error bars are only drawn in a single radial direction. Axes run from the center (=0) to the outside (=1). For visualization purposes, the small-worldness and hub disruption index were scaled with a factor of 0.2. (A) Phase-based connectivity (phase locking value, PLV). The global efficiency in the gamma band was significantly decreased in chronic pain patients (nonparametric permutation test, P [corrected/uncorrected] = 0.013/0.0032, Cohen's d = 0.44). No other measure revealed a significant difference when compared between groups, see Table 3 for details. (B) Amplitude-based connectivity (orthogonalized amplitude envelope correlation, AEC). No significant difference between groups was observed, Table 3 for statistical details.
Figure 5.
Figure 5.
Correlations between clinical/behavioral parameters and brain activity/functional connectivity measures. The cell values show the strength and direction of the correlations (Pearson's r) and the color depicts the uncorrected P values. Only correlations showing a trend (P < 0.1) are shown. No correlation was statistically significant after Holm–Bonferroni correction for multiple comparisons across the 4 frequency bands. AEC, measure is based on the orthogonalized amplitude envelope correlation; Avg. pain, average pain intensity in the past 4 weeks; BDI, Beck Depression Inventory II; conn, connectivity strength; Curr. pain, current pain intensity; dwPLI, measure is based on the debiased weighted phase lag index; gEff, global efficiency; kd, hub disruption index; Pain dur., pain duration; peak freq, peak frequency; PDI, pain disability index; PLV, measure is based on the phase locking value; VR12-MCS, Veterans's RAND mental component score; MQS, medication quantification scale; VR12-PCS, Veterans's RAND physical component score.
Figure 6.
Figure 6.
Multivariate machine learning approach to classify chronic pain patients and healthy controls. (A) Distribution of mean accuracies resulting from a 10-fold cross-validation. The blue histogram shows the results trained on the actual data including all features of brain activity and connectivity. The gray histogram shows a support vector machine (SVM) trained on data with randomly permuted labels. The SVM trained on the real data shows an accuracy of 57 ± 4%, significantly higher than the accuracy of the SVM trained on randomly permuted data, 50 ± 5% (P < 0.001). (B) The 5 most predictive features, ie, those selected most consistently by the SVMs. Specific measures are color-coded, and the size of the spheres represents how often a specific feature was selected. The most frequently selected features were phase locking value (PLV)-based connectivity of the prefrontal cortex (MNI: −40, 30, 40 and −30, 50, 10) in the gamma band, which were selected in 15% and 12% of SVMs, respectively, and debiased weighted phase lag index (dwPLI) based clustering coefficient of the prefrontal cortex (MNI: −20, 50, 40) in the theta band, which was selected in 15% of SVMs. All other features were selected with a frequency of less than 10%. MNI, Montreal Neurological Institute.

References

    1. Achard S, Delon-Martin C, Vértes PE, Renard F, Schenck M, Schneider F, Heinrich C, Kremer S, Bullmore ET. Hubs of brain functional networks are radically reorganized in comatose patients. Proc Natl Acad Sci USA 2012;109:20608–13. - PMC - PubMed
    1. Baliki MN, Apkarian AV. Nociception, pain, negative moods, and behavior selection. Neuron 2015;87:474–91. - PMC - PubMed
    1. Baliki MN, Petre B, Torbey S, Herrmann KM, Huang L, Schnitzer TJ, Fields HL, Apkarian AV. Corticostriatal functional connectivity predicts transition to chronic back pain. Nat Neurosci 2012;15:1117–9. - PMC - PubMed
    1. Bauer G, Bauer R. EEG, drug effects, and central nervous system poisoning. In: Schomer DL, da Silva FHL, editors. Niedermeyer's electroencephalography: basic principles, clinical applications, and related fields. Philadelphia: Oxford University Press, 2011. pp. 901–22.
    1. Bazanova OM, Vernon D. Interpreting EEG alpha activity. Neurosci Biobehav Rev 2014;44:94–110. - PubMed

Publication types