. 2019 Jul 29;14(7):e0219592.
doi: 10.1371/journal.pone.0219592. eCollection 2019.

Elimination of protein aggregates prevents premature senescence in human trisomy 21 fibroblasts

Affiliations

Elimination of protein aggregates prevents premature senescence in human trisomy 21 fibroblasts

Nobutoshi Nawa et al. PLoS One. .

Abstract

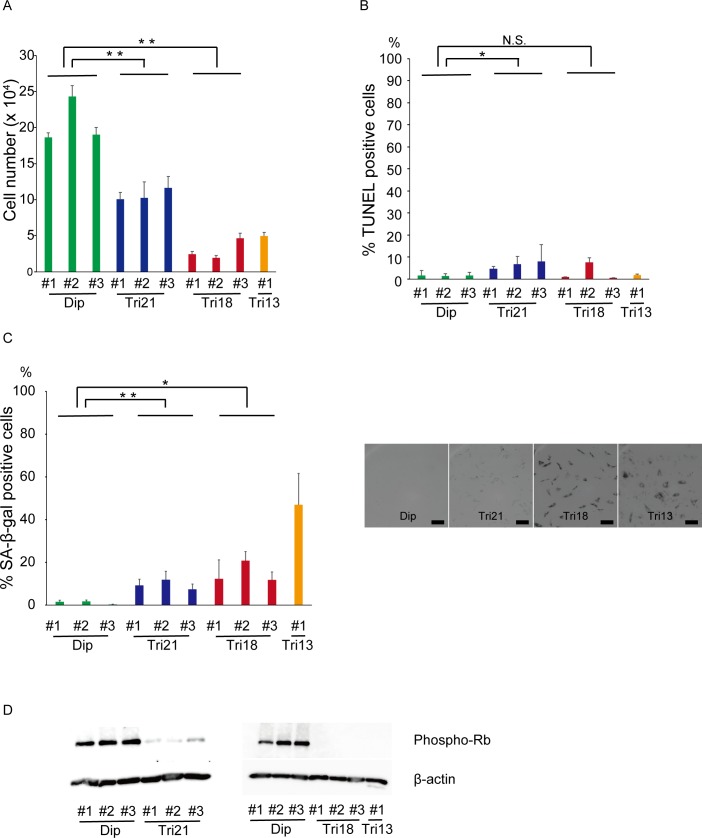
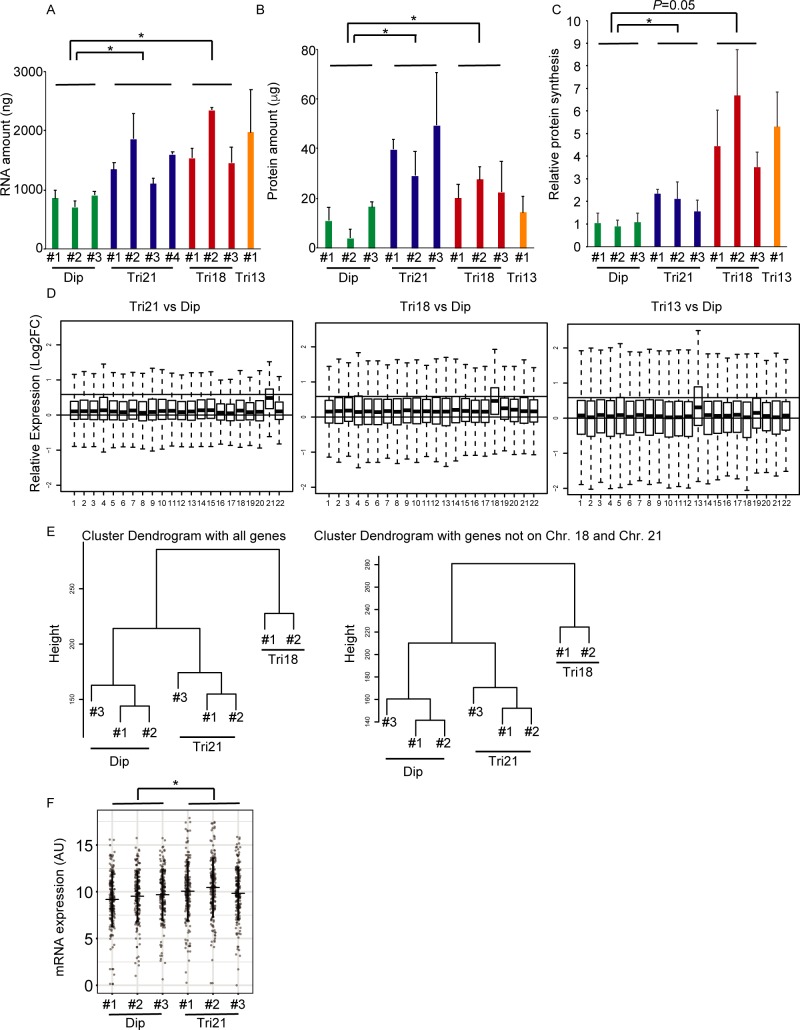
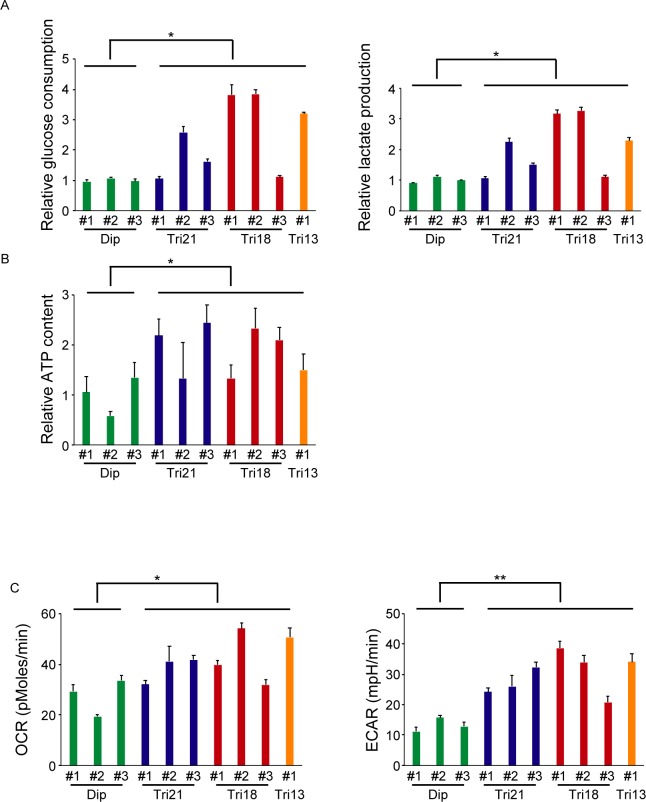
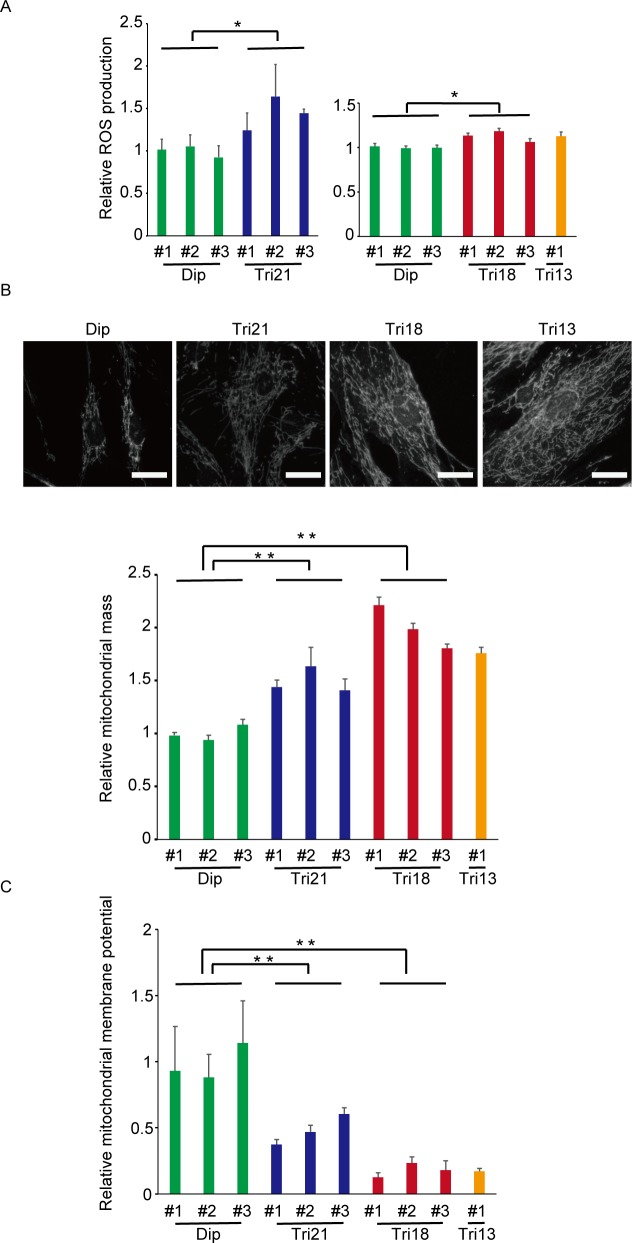
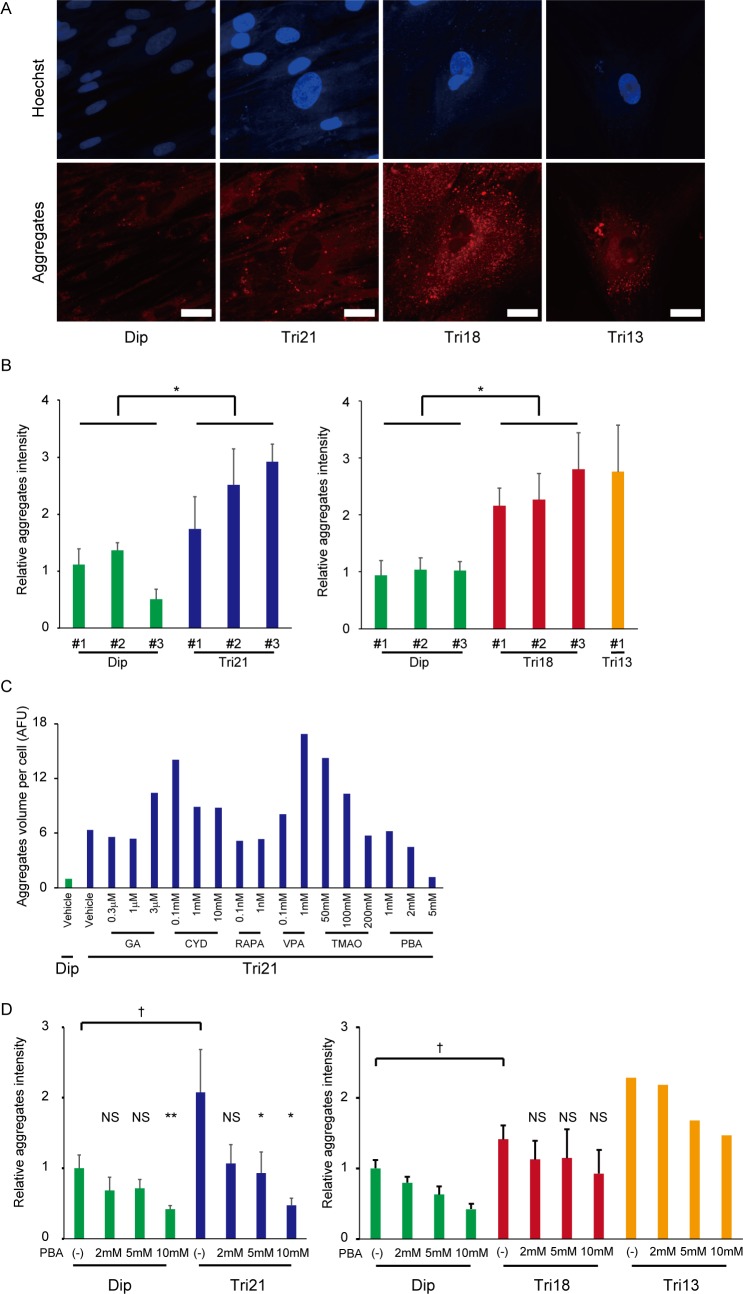
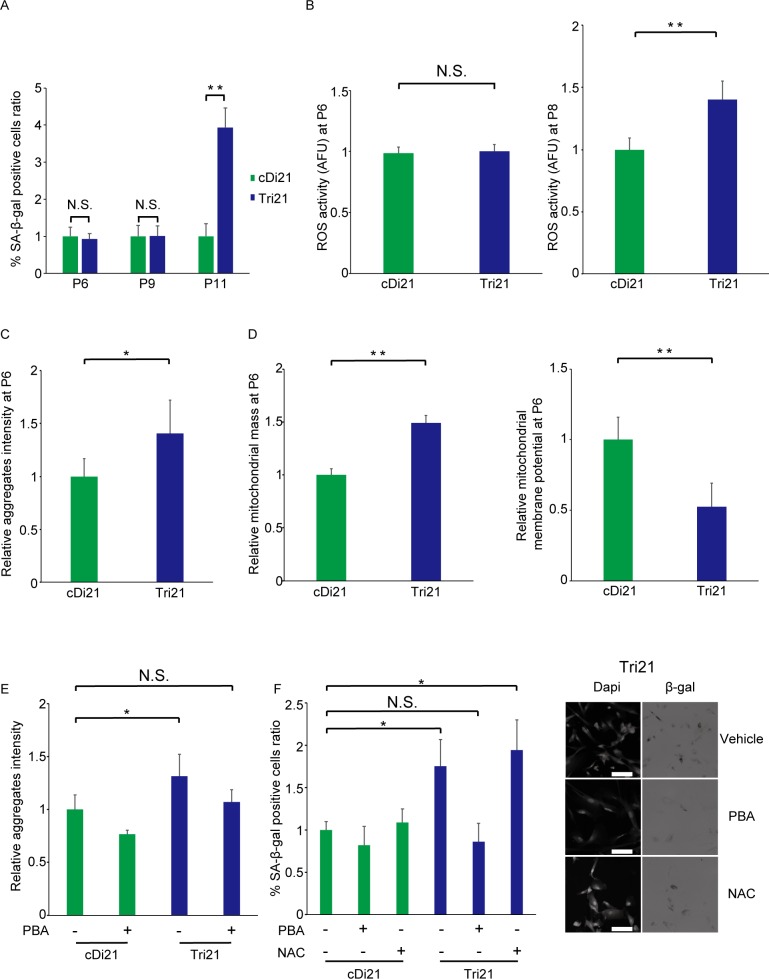
Chromosome abnormalities induces profound alterations in gene expression, leading to various disease phenotypes. Recent studies on yeast and mammalian cells have demonstrated that aneuploidy exerts detrimental effects on organismal growth and development, regardless of the karyotype, suggesting that aneuploidy-associated stress plays an important role in disease pathogenesis. However, whether and how this effect alters cellular homeostasis and long-term features of human disease are not fully understood. Here, we aimed to investigate cellular stress responses in human trisomy syndromes, using fibroblasts and induced pluripotent stem cells (iPSCs). Dermal fibroblasts derived from patients with trisomy 21, 18 and 13 showed a severe impairment of cell proliferation and enhanced premature senescence. These phenomena were accompanied by perturbation of protein homeostasis, leading to the accumulation of protein aggregates. We found that treatment with sodium 4-phenylbutyrate (4-PBA), a chemical chaperone, decreased the protein aggregates in trisomy fibroblasts. Notably, 4-PBA treatment successfully prevented the progression of premature senescence in secondary fibroblasts derived from trisomy 21 iPSCs. Our study reveals aneuploidy-associated stress as a potential therapeutic target for human trisomies, including Down syndrome.


Conflict of interest statement

The authors have read the journal's policy and have the following competing interests: This study received funding from Mitsui Life Social Welfare Foundation, and Shionogi & Co., Ltd. Dr. Mahito Nakanishi is the founder and chief technology officer (CTO) of Tokiwa-Bio, Inc. Method to generate iPS cells with SeVdp vector installing reprogramming genes is protected by following patents: JP 4936482; JP 5633075; JP 5963309; US 9145564; US 8496941 B2; US 9365866 B2; EP 2434012; EP 2639297. This does not alter our adherence to all the PLOS ONE policies on sharing data and materials.

Figures

Fig 1
Fig 1. Trisomy fibroblasts showed severe proliferative impairment owing to premature senescence.
(A) Absolute cell numbers three days after seeding 3×10⁴ cells (n = 3 per cell line). **P < 0.01. Dip, diploid; Tri, trisomy. (B) Percentage of TUNEL-positive cells (n = 3–7 per cell line). *P < 0.05. Dip, diploid; Tri, trisomy; N.S., not significant. (C) Percentage of SA-β-gal-positive cells (n = 3 per cell line). The right panel shows representative phase contrast images. Bar = 100 μm. **P < 0.01; *P < 0.05. Dip, diploid; Tri, trisomy. (D) Expression of phospho-Rb by western blotting analysis. Comparisons were made by Student’s t-test or Welch’s two-sample t-test.
Fig 2
Fig 2. Senescent trisomy fibroblasts showed increased cellular RNA and protein contents.
(A) Cellular RNA content in 1×10⁵ cells (n = 3–16 per cell line). *P < 0.05. Dip, diploid; Tri, trisomy. (B) Cellular protein content in 1×10⁵ cells (n = 3–6 per cell line). *P < 0.05. Dip, diploid; Tri, trisomy. (C) Relative protein synthesis ratio per cell, as assessed by the Click-iT AHA Alexa Fluor 488 Protein Synthesis HCS Assay Kit (n = 6–12 per cell line). *P < 0.05. Dip, diploid; Tri, trisomy. (D) Boxplots of relative log expression ratios for the genes on each chromosome using microarray data without the spike-in control. The left panel shows data for trisomy 21 fibroblasts compared with control fibroblasts. The middle panel shows data for trisomy 18 fibroblasts compared with the controls. The right panel shows data for trisomy 13 fibroblasts compared with the controls. The upper horizontal lines indicate a ratio of 1.5 (= 0.58 in log2 scale), while the lower horizontal lines indicate a ratio of 1.0 (= 0 in log2 scale). Dip, diploid; Tri, trisomy. (E) Hierarchical cluster analysis of microarray data with the spike-in control. The left panel shows a cluster dendrogram using all genes. The right panel shows a cluster dendrogram using only genes on the disomic chromosomes. Dip, diploid; Tri, trisomy. (F) Gene expression levels as assessed by NanoString’s nCounter analysis system. *P < 0.05. Dip, diploid; Tri, trisomy. Comparisons were made by Student’s t-test or Welch’s two-sample t-test.
Fig 3
Fig 3. Senescent trisomy fibroblasts showed increased glucose consumption and increased lactate production, suggesting disturbed energy metabolism.
(A) The left panel shows relative glucose consumption by 1×10⁵ cells over three days, as assessed by decreased glucose content in the culture medium. The right panel shows relative lactate production by 1×10⁵ cells over three days, as assessed by increased lactate content in the culture medium (n = 3 per cell line). *P < 0.05. Dip, diploid; Tri, trisomy. (B) Relative cellular ATP content, as assessed by an intracellular ATP determination kit (n = 4 per cell line). *P < 0.05. Dip, diploid; Tri, trisomy. (C) The left panel shows oxygen consumption rate (OCR), as assessed by an XF96 Extracellular Flux Analyzer. *P < 0.05. The right panel shows extracellular acidification rate (ECAR), as assessed by an XF96 Extracellular Flux Analyzer (n = 3–6 per cell line). **P < 0.01. Dip, diploid; Tri, trisomy. Comparisons were made by Student’s t-test or Welch’s two-sample t-test.
Fig 4
Fig 4. Trisomy fibroblasts showed increased oxidative stress and accumulation of damaged mitochondria.
(A) Relative ROS production as expressed by relative MitoSOX/MitoTracker ratio (n = 5–6 per cell line). *P < 0.05. Dip, diploid; Tri, trisomy. (B) Relative mitochondrial mass per cell as assessed by average TOM20-positive area per cell. The upper panels show representative phase contrast images in which mitochondria were stained with MitoTracker. Bar = 50 μm. The lower panel shows corresponding quantification (n = 3–8 per cell line). **P < 0.01. Dip, diploid; Tri, trisomy. (C) Relative mitochondrial membrane potential per cell (n = 5–10 per cell line). **P < 0.01. Dip, diploid; Tri, trisomy. Comparisons were made by Student’s t-test.
Fig 5
Fig 5. Accumulation of aggregated proteins and effect of the chemical chaperone, 4-PBA in trisomy fibroblasts.
(A) Accumulation of aggregated proteins, as detected by the PROTEOSTAT Aggresome Detection kit. Bar = 50 μm. Dip, diploid; Tri, trisomy. (B) Corresponding quantification of aggregated protein accumulation (n = 5–6 per cell line). *P < 0.05. Dip, diploid; Tri, trisomy. The left panel shows the result for the comparison between diploid and trisomy 21 cell lines. The right panel shows the result for the comparison between diploid and trisomy 18 and 13 cell lines. (C) Quantification of aggregated protein accumulation after culture in the presence of six chemical compounds: GA, geldanamycin; CYD, 2-hydroxypropyl-β-cyclodextrin; RAPA, rapamycin; VPA, valproic acid sodium salt; TMAO, trimethylamine N-oxide; PBA, sodium phenylbutyrate. Dip, diploid; Tri, trisomy. (D) Effects of sodium phenylbutyrate on aggregated protein accumulation (mean of three cell lines for Dip, Tri21, and Tri18 fibroblasts; n = 3 per cell line). Comparison of trisomy samples without PBA with diploid samples without PBA, P < 0.05. Comparison of samples with PBA with samples without PBA, *P < 0.05, **P < 0.01. PBA, sodium phenylbutyrate; Dip, diploid; Tri, trisomy; N.S., not significant.
Fig 6
Fig 6. Rescue of trisomy-induced premature senescence by 4-PBA treatment in trisomy 21 iPSC-derived secondary fibroblasts.
(A) Percentage of SA-β-gal-positive cells (n = 3 per cell line). **P < 0.01. cDi21, corrected disomy 21 iPSC-derived secondary fibroblasts; Tri21, trisomy 21 iPSC-derived secondary fibroblasts; N.S., not significant. (B) Relative ROS production as expressed by relative MitoSOX/MitoTracker ratio at passage 6 (left) and passage 8 (right) (n = 6 per cell line). **P < 0.01. cDi21, corrected disomy 21 iPSC-derived secondary fibroblasts; Tri21, trisomy 21 iPSC-derived secondary fibroblasts; N.S., not significant. (C) Accumulation of aggregated proteins, as detected by the PROTEOSTAT Aggresome Detection kit (n = 6 per cell line). *P < 0.05. cDi21, corrected disomy 21 iPSC-derived secondary fibroblasts; Tri21, trisomy 21 iPSC-derived secondary fibroblasts. (D) The left panel shows relative mitochondrial mass per cell as assessed by the mean MitoTracker Red CMXRos-positive area per cell. The right panel shows relative mitochondrial membrane potential per cell (n = 6 per cell line). **P < 0.01. cDi21, corrected disomy 21 iPSC-derived secondary fibroblasts; Tri21, trisomy 21 iPSC-derived secondary fibroblasts. (E) Effects of 4-PBA on aggregated protein accumulation (n = 5 per cell line). *P < 0.05. PBA, sodium phenylbutyrate; cDi21, corrected disomy 21 iPSC-derived secondary fibroblasts; Tri21, trisomy 21 iPSC-derived secondary fibroblasts; N.S., not significant. (F) Effects of 4-PBA (2 mM) or NAC (2.5 mM) on cellular senescence. The right panel shows representative phase contrast images. Bar = 100 μm. The left panel shows corresponding quantification (n = 3 per cell line). *P < 0.05. PBA, sodium phenylbutyrate; NAC, N-acetyl-L-cysteine; cDi21, corrected disomy 21 iPSC-derived secondary fibroblasts; Tri21, trisomy 21 iPSC-derived secondary fibroblasts; N.S., not significant.

References

    1. Parker SE, Mai CT, Canfield MA, Rickard R, Wang Y, Meyer RE, et al. Updated National Birth Prevalence estimates for selected birth defects in the United States, 2004–2006. Birth Defects Res A Clin Mol Teratol. 2010;88(12):1008–16. 10.1002/bdra.20735 . - DOI - PubMed
    1. Banno K, Omori S, Hirata K, Nawa N, Nakagawa N, Nishimura K, et al. Systematic Cellular Disease Models Reveal Synergistic Interaction of Trisomy 21 and GATA1 Mutations in Hematopoietic Abnormalities. Cell Rep. 2016;15(6):1228–41. 10.1016/j.celrep.2016.04.031 . - DOI - PubMed
    1. Haydar TF, Reeves RH. Trisomy 21 and early brain development. Trends Neurosci. 2012;35(2):81–91. 10.1016/j.tins.2011.11.001 - DOI - PMC - PubMed
    1. Lana-Elola E, Watson-Scales SD, Fisher EM, Tybulewicz VL. Down syndrome: searching for the genetic culprits. Dis Model Mech. 2011;4(5):586–95. 10.1242/dmm.008078 - DOI - PMC - PubMed
    1. Henry IM, Dilkes BP, Miller ES, Burkart-Waco D, Comai L. Phenotypic consequences of aneuploidy in Arabidopsis thaliana. Genetics. 2010;186(4):1231–45. Epub 2010/09/30. 10.1534/genetics.110.121079 - DOI - PMC - PubMed

Publication types

MeSH terms