. 2019 Nov:213:112-123.
doi: 10.1016/j.trsl.2019.07.005. Epub 2019 Jul 15.

Increased renal cellular senescence in murine high-fat diet: effect of the senolytic drug quercetin

Affiliations

Increased renal cellular senescence in murine high-fat diet: effect of the senolytic drug quercetin

Seo Rin Kim et al. Transl Res. 2019 Nov.

Abstract

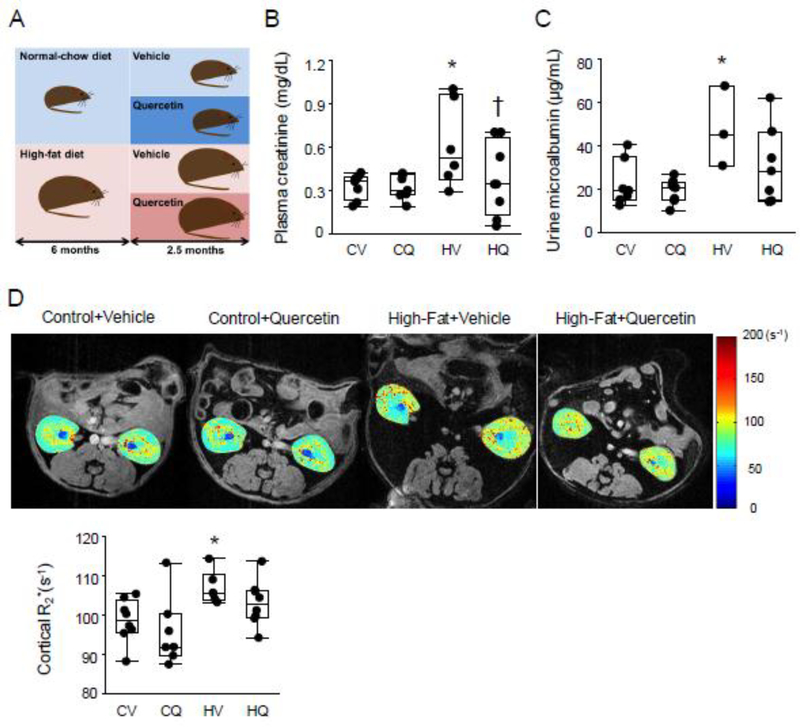
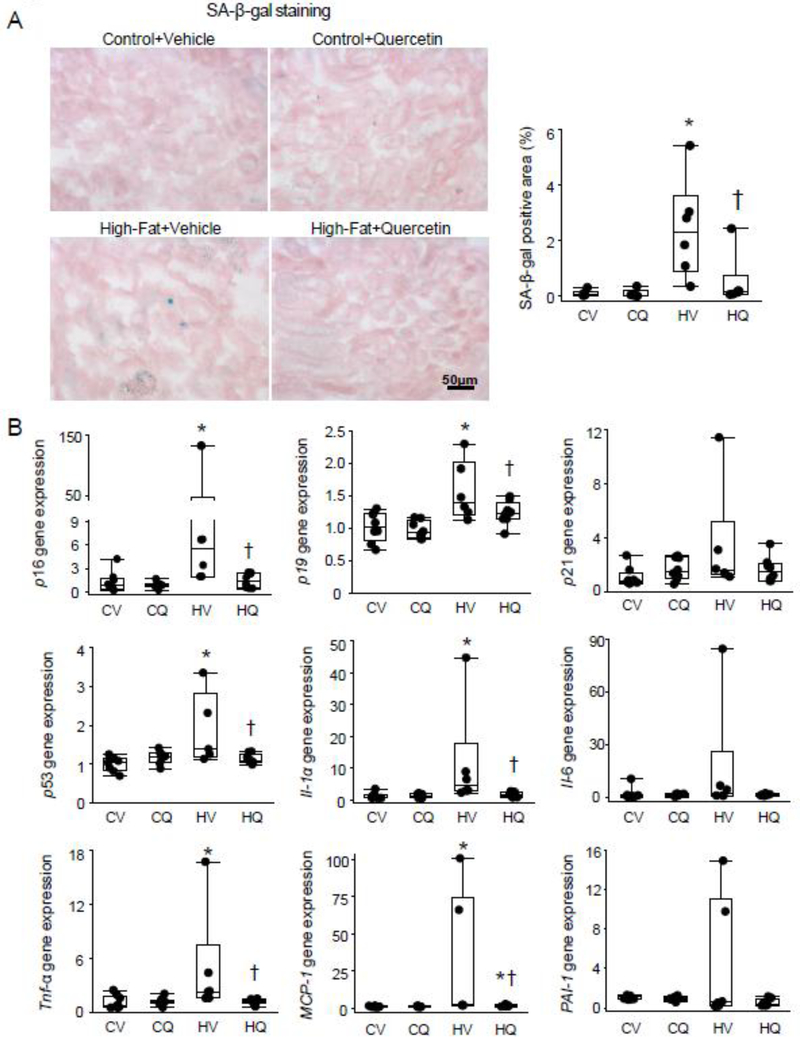
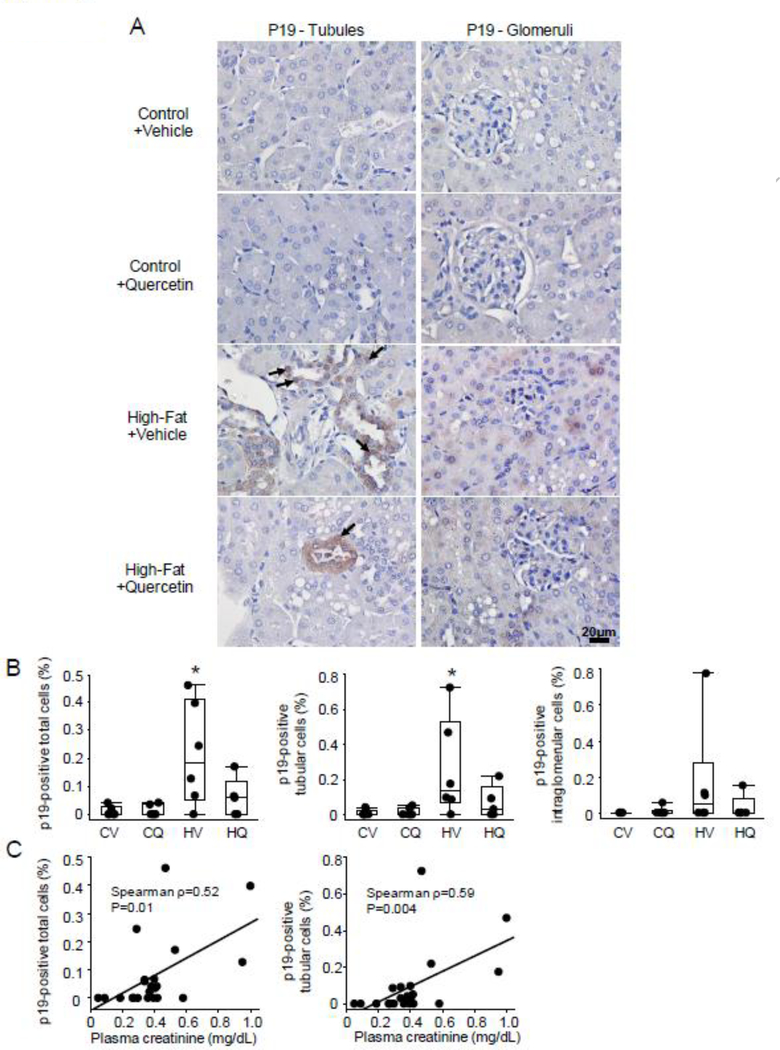
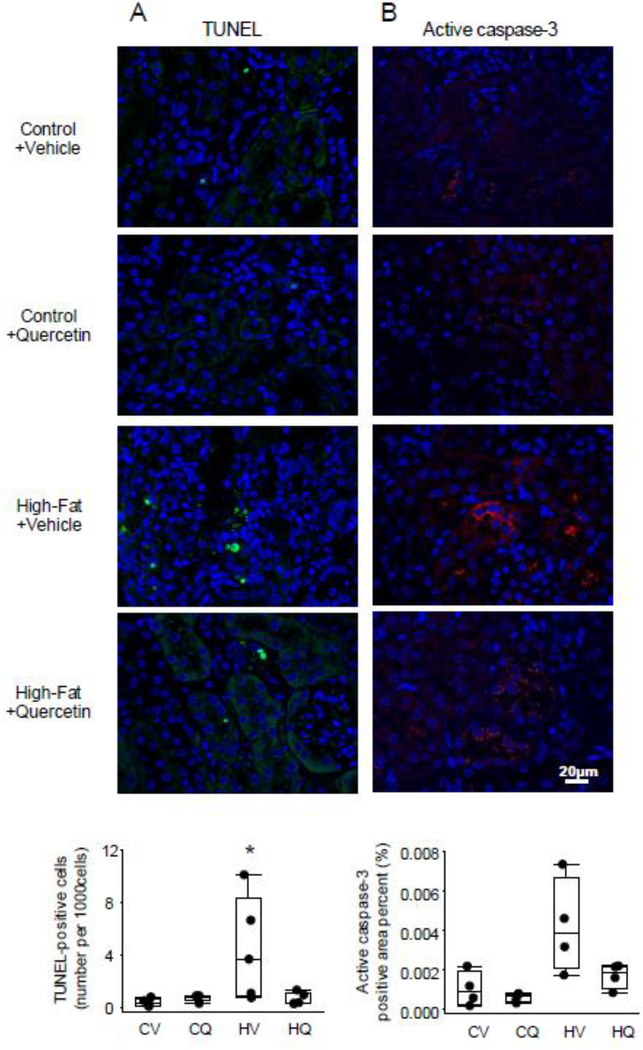
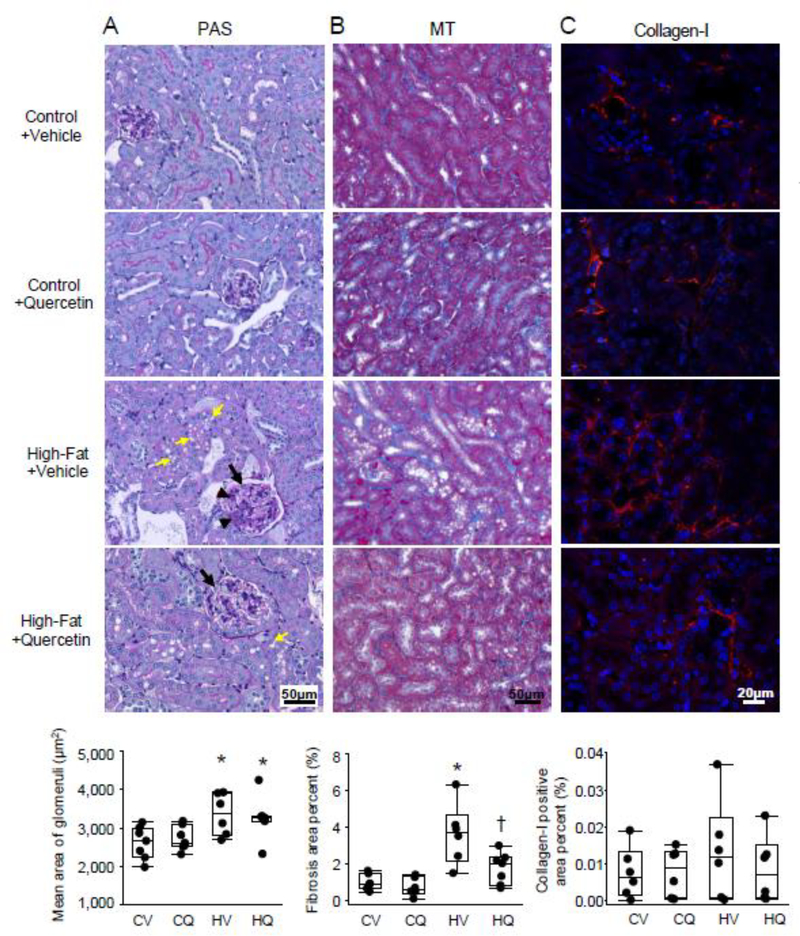
Obesity and dyslipidemia can be associated with cellular senescence, and may impair kidney function. However, whether senescence contributes to renal dysfunction in these conditions remains unclear. Quercetin is an abundant dietary flavonoid that selectively clears inhibiting PI3K/AKT and p53/p21/serpines and inducing apoptosis. We hypothesized that high-fat-diet-induced obesity causes renal senescence, which would be mitigated by quercetin. C57BL/6J mice fed either standard chow or high-fat diets (HFDs) were treated with quercetin (50 mg/kg) or vehicle 5-days biweekly via oral gavage for 10 weeks. Subsequently, renal function was studied in vivo using magnetic resonance imaging, and renal senescence and histology were evaluated ex vivo. Mice fed with a HFD developed obesity and hypercholesterolemia, whereas renal size remained unchanged. Murine obesity impaired renal function and cortical oxygenation, and induced glomerulomegaly. Renal markers of senescence (eg, expression of p16, p19, and p53) and its secretory phenotype were upregulated in the obese hypercholesterolemic compared to lean mice in renal tubular cells, but attenuated in quercetin-treated murine kidneys, as was renal fibrosis. Quercetin treatment also increased renal cortical oxygenation and decreased plasma creatinine levels in obese mice, whereas body weight and cholesterol levels were unaltered. Therefore, murine obesity and dyslipidemia induce renal tissue senescence and impairs kidney function, which is alleviated by chronic senolytic treatment. These findings implicate senescence in loss of kidney function in murine dyslipidemia and obesity, and support further studies of senolytic therapy in obesity.


Conflict of interest statement

All authors have read the journal’s authorship agreement and policy on disclosure of potential conflicts of interest, and the manuscript has been reviewed by and approved by all named authors.

Figures

Figure 1.
Figure 1.
Renal function in obese dyslipidemic mice. A. Mice consumed either standard chow or high fat diet, and at 6 months started adjunct treatment with quercetin or vehicle for another 10 weeks. B, C. Plasma creatinine and urine microalbumin levels were elevated in High fat+Vehicle (HV) compared with Control+Vehicle (CV), but quercetin treatment restored creatinine levels. CV: n=7–8, CQ: n=8, HV: n=3–6, HQ: n=7–8; Wilcoxon test. D. In vivo assessment of renal oxygenation by blood oxygen-level-dependent MRI. Renal cortical hypoxia (R2*) was elevated in HV vs. CV mice, but not in High fat+Quercetin (HQ) or Control+Quercetin (CQ) mice. CV n=8, CQ n=7, HV n=6, HQ n=8; two-tailed Student’s t-tests. *P≤0.05 vs. CV, †P≤0.05 vs. HV.
Figure 2.
Figure 2.
Renal senescence in obese dyslipidemic mice. A. Representative renal senescence-associated β-galactosidase (SA-β-Gal) staining. SA-β-Gal+ area (blue) was larger in both High fat+Vehicle (HV) and High fat+Quercetin (HQ) groups than in controls, but lower in HQ. n=6 each; Wilcoxon test. B. Renal p16, p19, and p53 gene expression was upregulated in HV compared with Control+Vehicle (CV), and decreased in HQ. Renal gene expression of IL-1α, Tnf-α, and MCP-1 was increased in HV compared with CV and decreased in HQ compared with in HV. CV n=8, CQ n=8, HV n=6, HQ n=8; Wilcoxon test. *P≤0.05 vs. CV, †P≤0.05 vs. HV.
Figure 3.
Figure 3.
Representative p19 immunohistochemistry staining in the kidney. A-B. The percentage of total as well as tubular p19-positive (arrow) was greater in High fat+Vehicle (HV) than in Control+Vehicle (CV), but not in High fat+Quercetin (HQ) mice. CV n=6, CQ n=6, HV n=6, HQ n=5; Wilcoxon test. *P≤0.05 vs. CV. C. The number of these cells also correlated with plasma creatinine levels.
Figure 4.
Figure 4.
Renal apoptotic signals in obese dyslipidemic mice. A. Representative renal Terminal deoxynucleotidyl-transferase dUTP nick end labeling (TUNEL) staining. The number of TUNEL-positive cells per 1000 cells was increased in High fat+Vehicle (HV) compared with Control+Vehicle (CV). n=5 each; Wilcoxon test. B. Active caspase-3 staining in the kidneys. Active caspase-3 positive area (red) percent tended to be increased in HV compared with CV. n=4 each; Wilcoxon test. *P≤0.05 vs. CV.
Figure 5.
Figure 5.
Representative renal Periodic acid-Schiff (PAS), Masson’s trichrome (MT), and collagen-I staining. A. PAS staining illustrated that compared to Control+Vehicle (CV), high-fat diet (HV) led to glomerulomegaly (black arrow) and mesangial matrix expansion (black arrowhead), which were unaffected by quercetin (HQ). In addition, abundant vacuoles (yellow arrow) localized mostly to proximal tubular cells of HV mice, whereas their brush borders were relatively intact. CV n=7, CQ n=7, HV n=6, HQ n=6; two-tailed Student’s t-tests. B. Cortical trichrome staining showed significantly lower interstitial fibrosis (blue stain) in HQ than in HV. CV n=7, CQ n=6, HV n=6, HQ n=7; Wilcoxon test. C. In renal collagen-I staining, collagen-I positive area (red) percent was not significantly different among the groups. n=6 each; Wilcoxon test. *P≤0.05 vs. CV, †P≤0.05 vs. HV.

References

    1. Ejerblad, Fored, Lindblad, et al. Obesity and risk for chronic renal failure. J Am Soc Nephrol. 2006;17:1695–702. - PubMed
    1. Tchkonia Morbeck, Zglinicki Von, et al. Fat tissue, aging, and cellular senescence. Aging cell. 2010;9:667–84. - PMC - PubMed
    1. Minamino, Orimo, Shimizu, et al. A crucial role for adipose tissue p53 in the regulation of insulin resistance. Nat Med. 2009;15:1082–7. - PubMed
    1. Zhang, Zhou, Strakovsky, Zhang, Pan. Hepatic cellular senescence pathway genes are induced through histone modifications in a diet-induced obese rat model. Am J Physiol Gastrointest Liver Physiol. 2012;302:G558–64. - PMC - PubMed
    1. Tchkonia, Zhu, van Deursen, Campisi, Kirkland. Cellular senescence and the senescent secretory phenotype: Therapeutic opportunities. J Clin Invest. 2013;123:966–72. - PMC - PubMed

Publication types