. 2019 Nov 1:143:25-46.
doi: 10.1016/j.freeradbiomed.2019.07.024. Epub 2019 Jul 26.

Mitochondrial oxidative stress-induced transcript variants of ATF3 mediate lipotoxic brain microvascular injury

Affiliations

Mitochondrial oxidative stress-induced transcript variants of ATF3 mediate lipotoxic brain microvascular injury

Tun Nyunt et al. Free Radic Biol Med. .

Abstract

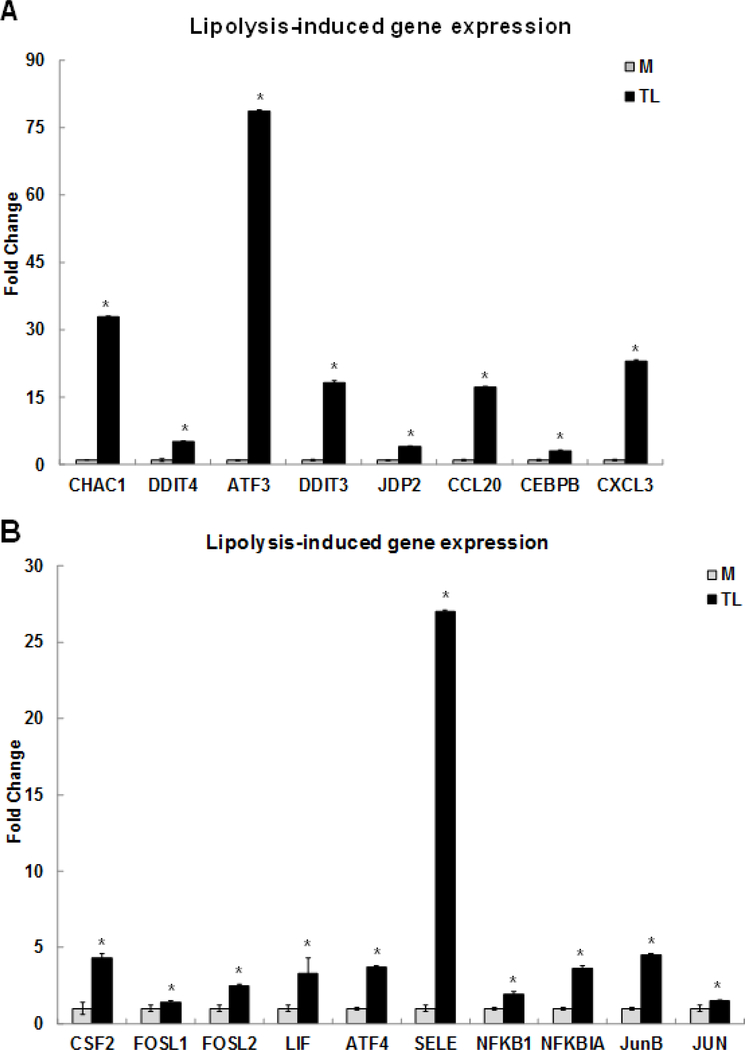
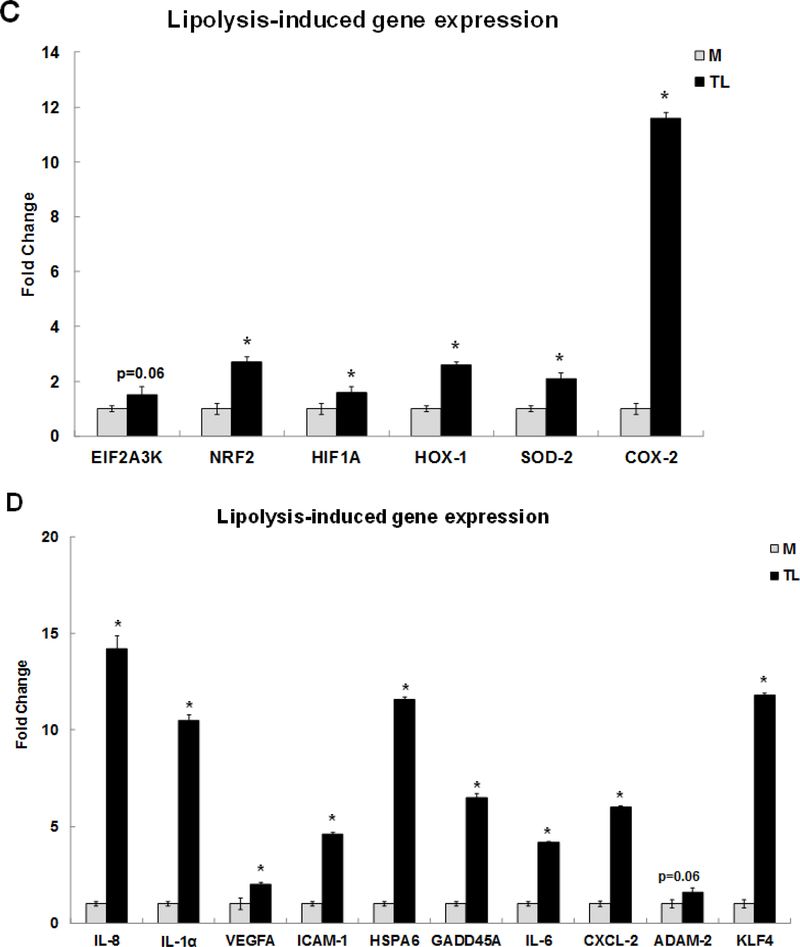
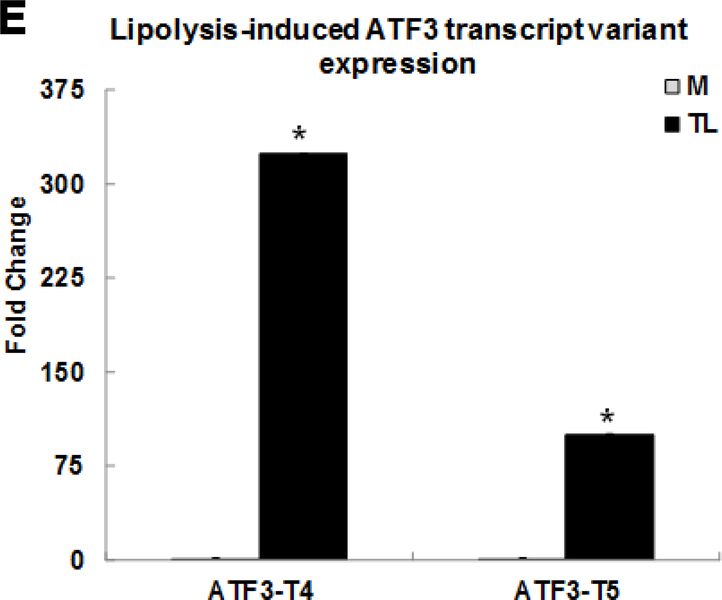
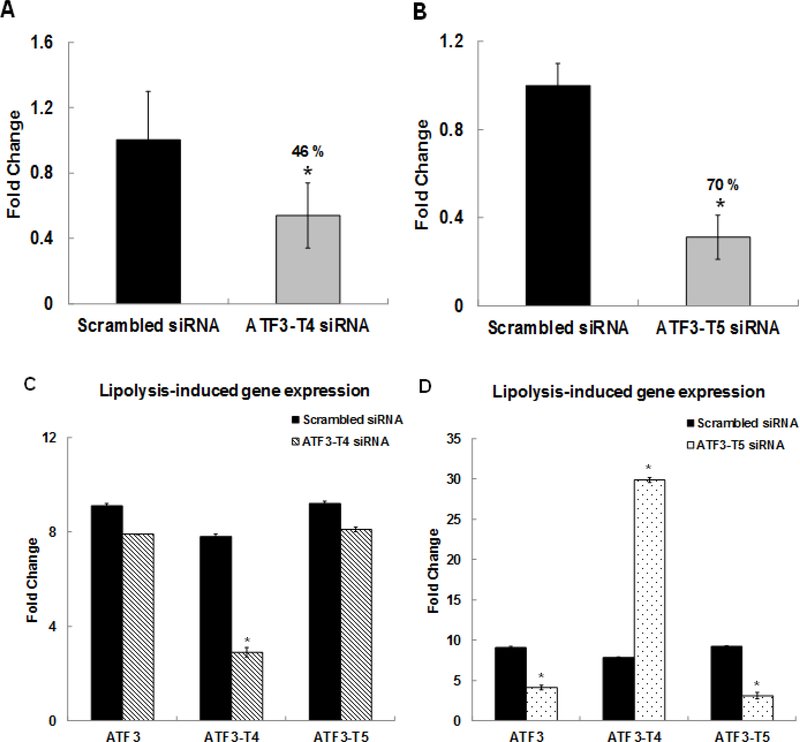
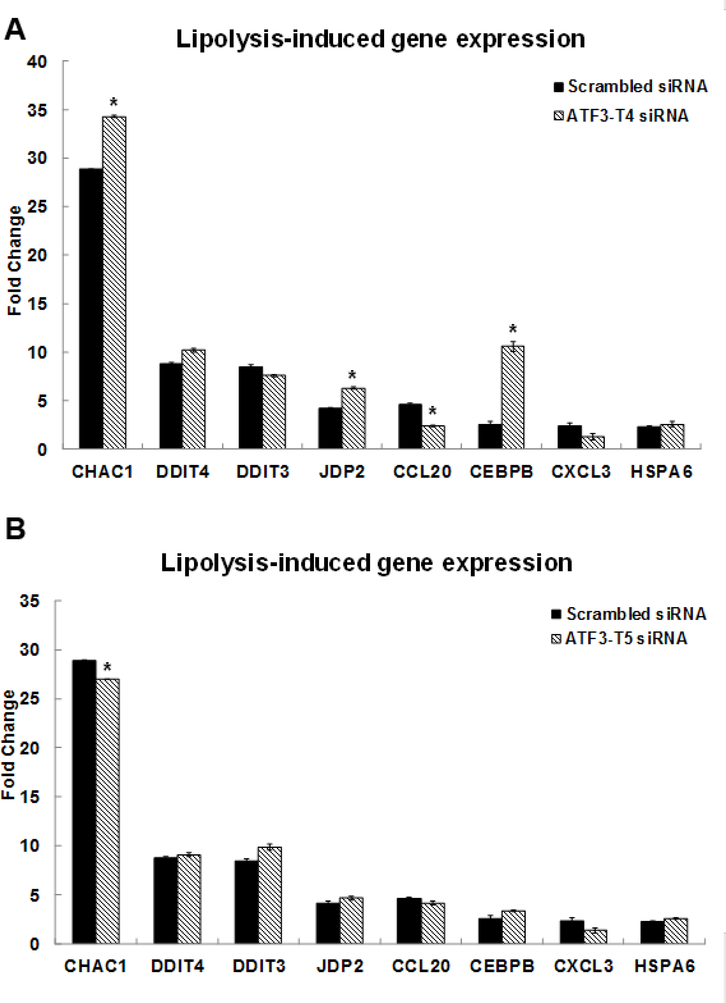
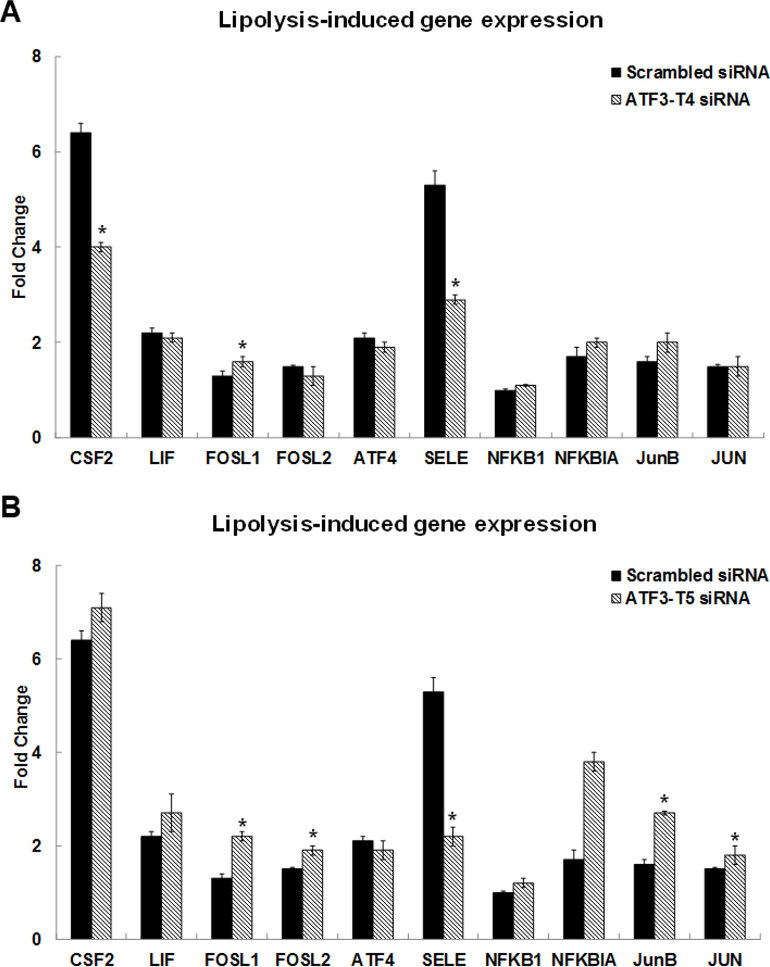
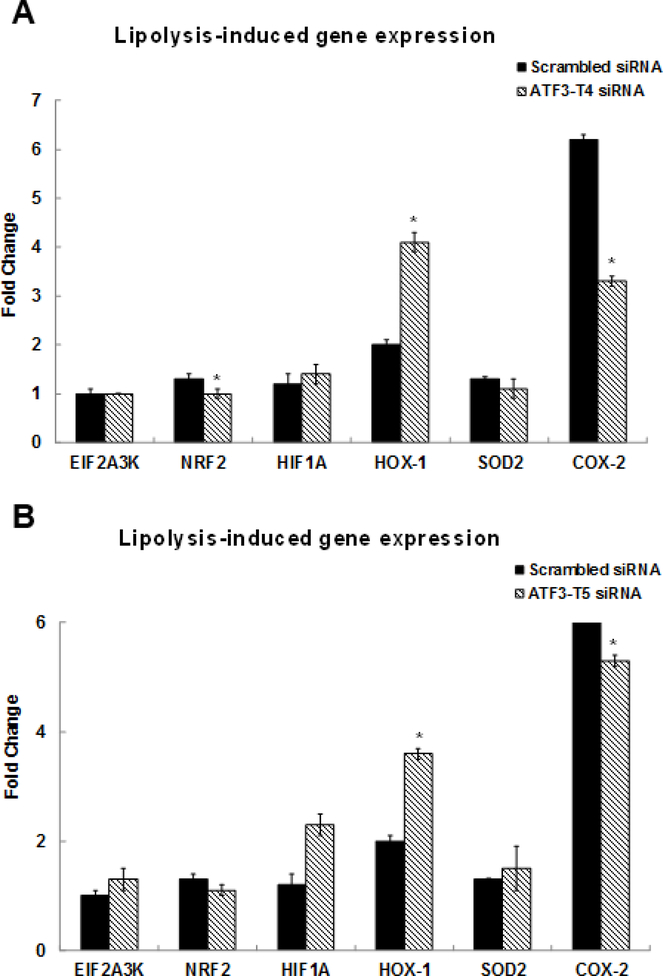
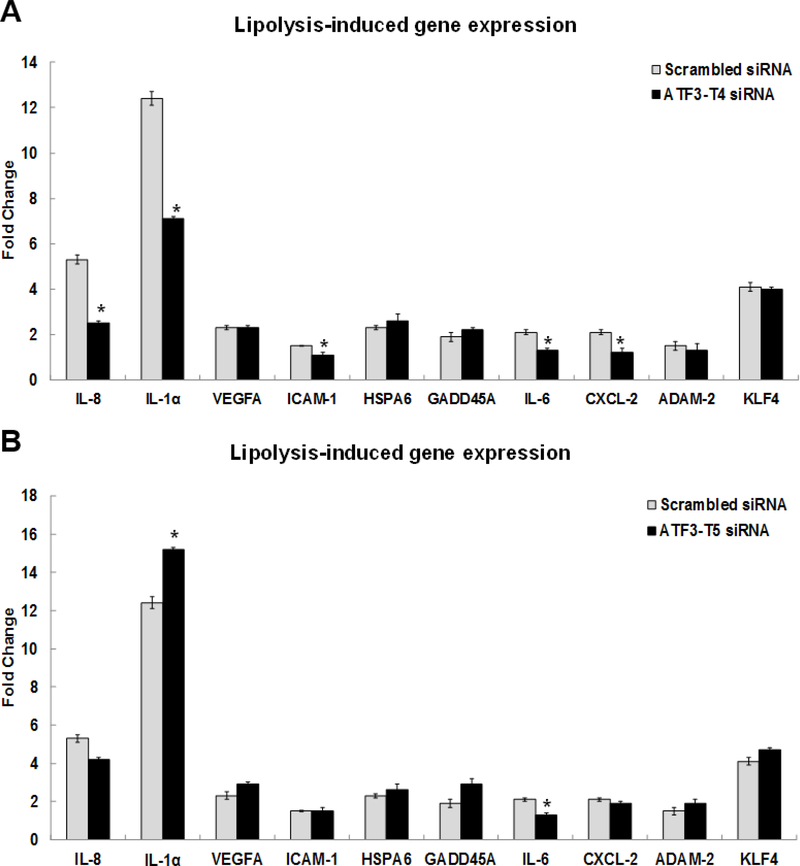
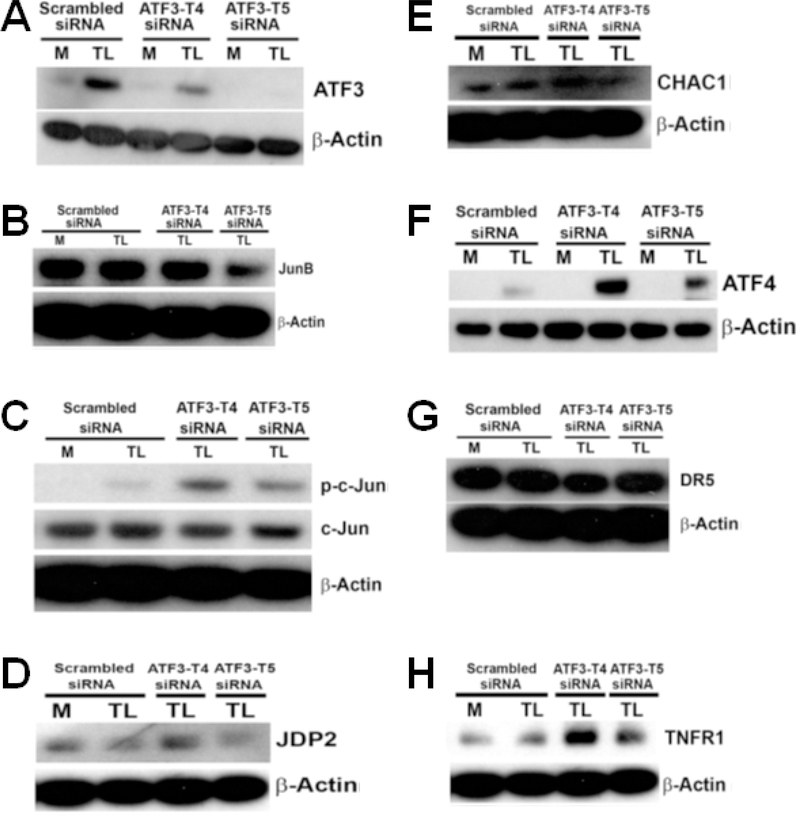
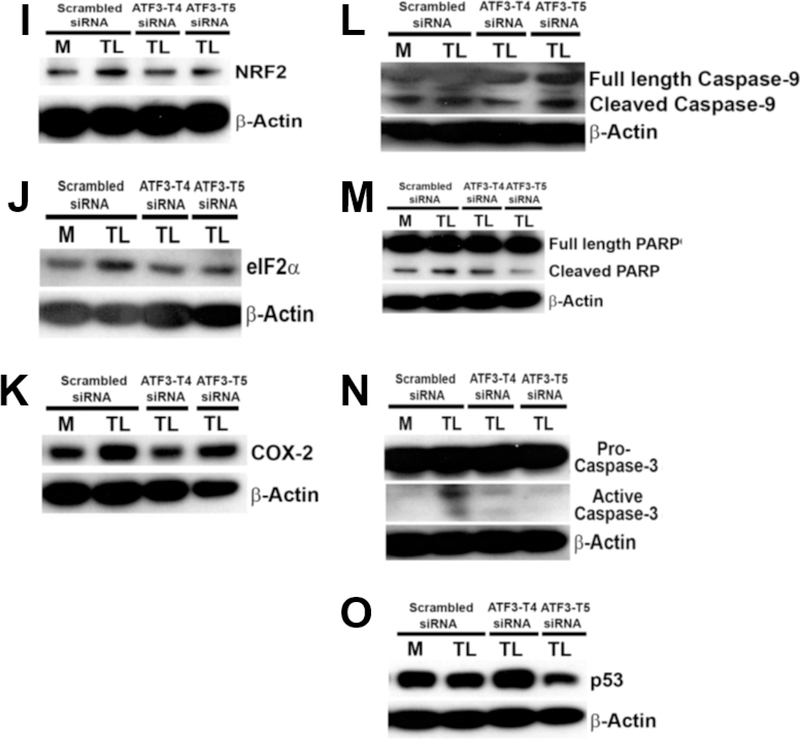
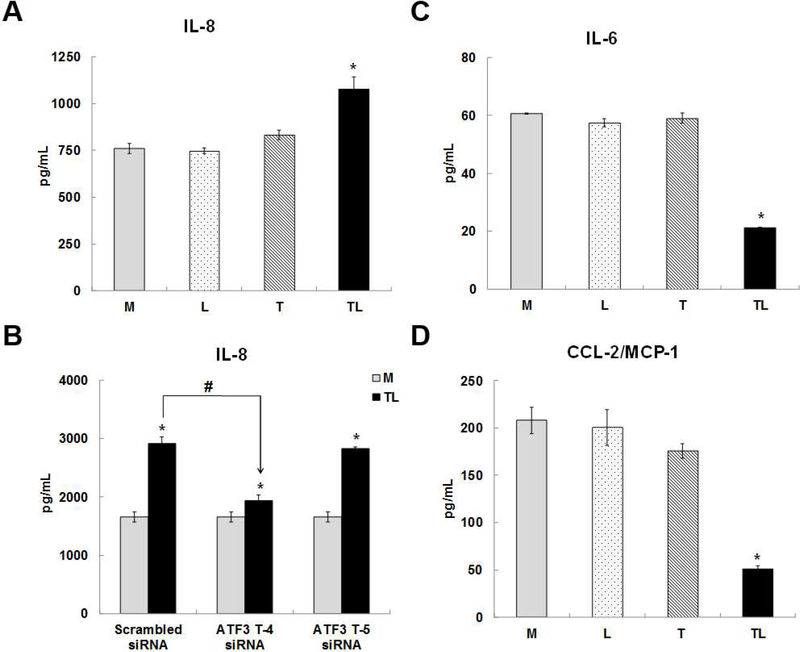
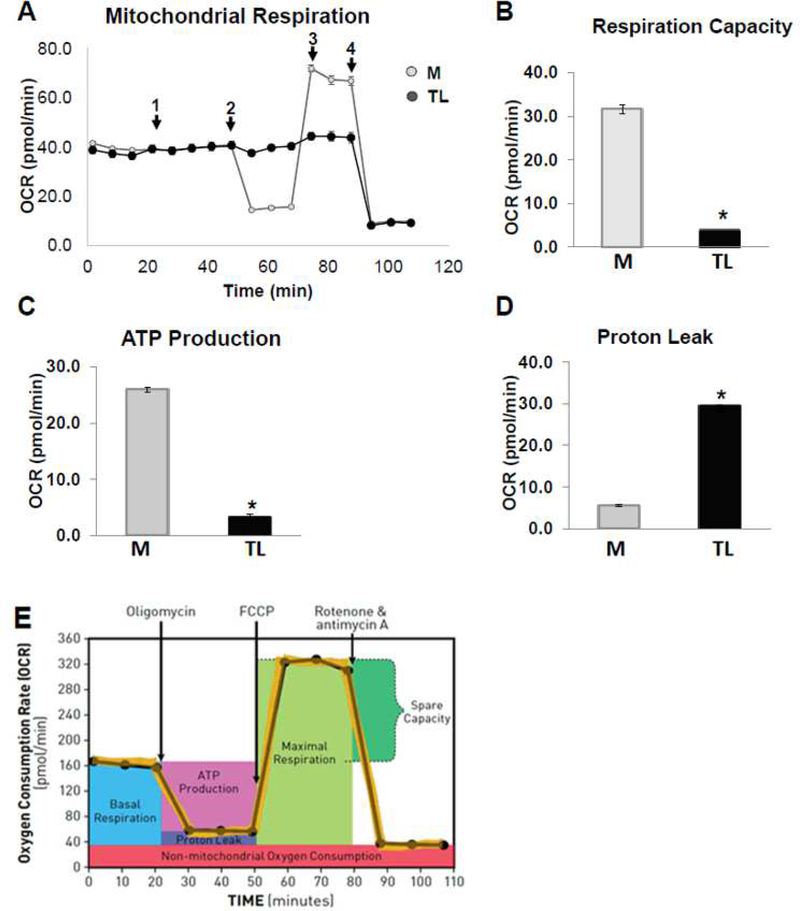
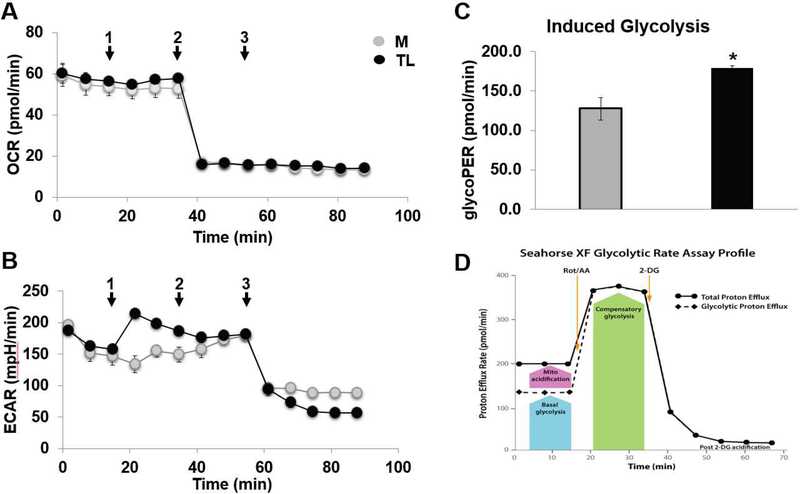
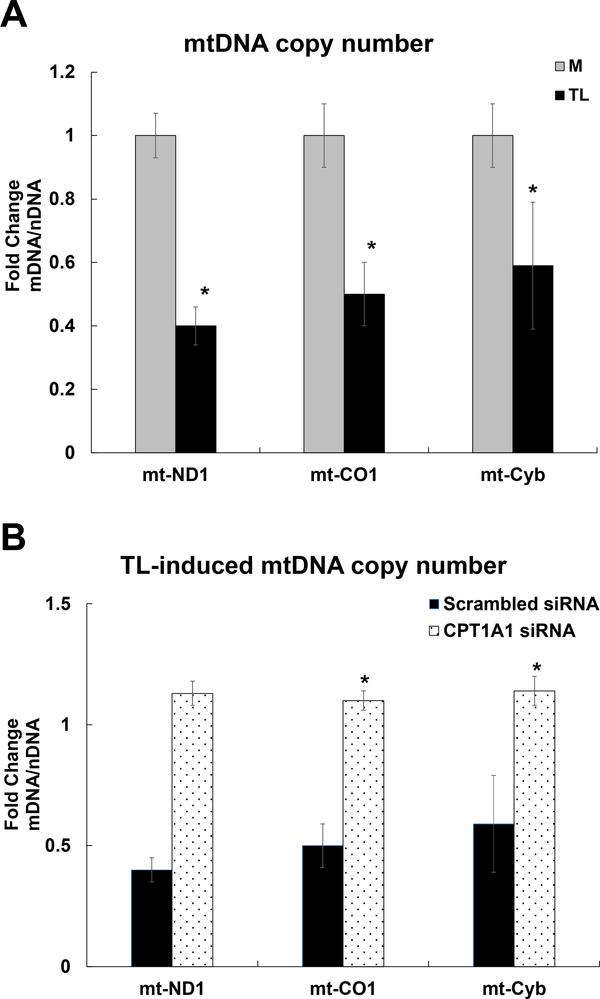
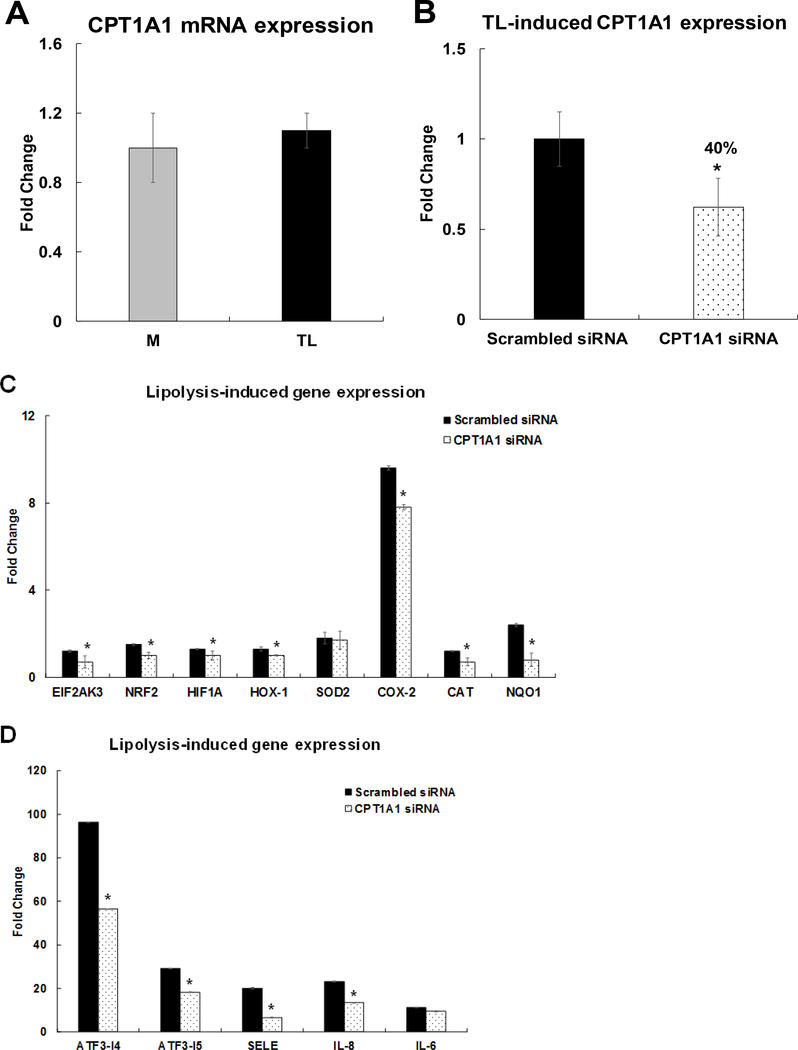
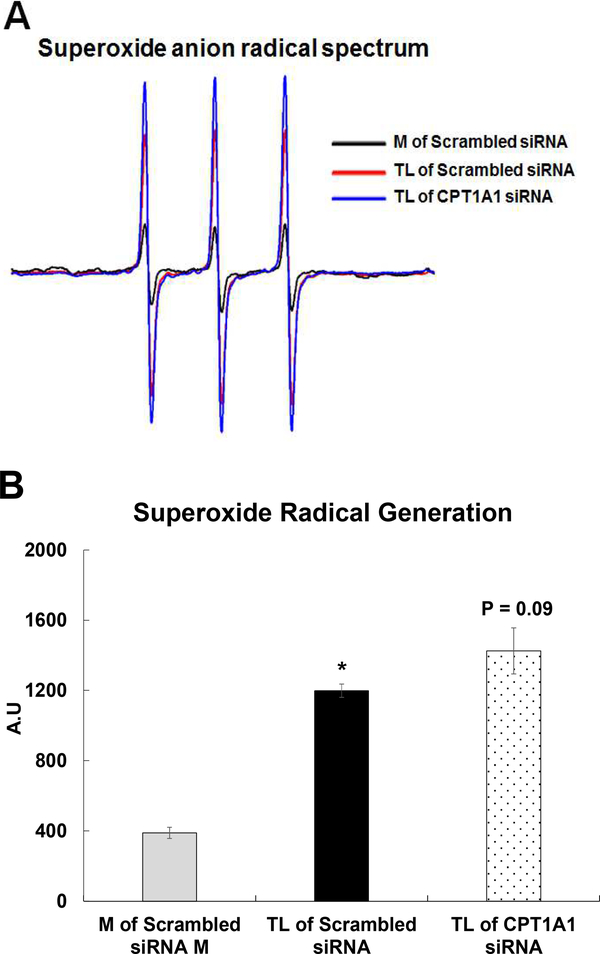
Elevation of blood triglycerides, primarily triglyceride-rich lipoproteins (TGRL), is an independent risk factor for cardiovascular disease and vascular dementia (VaD). Accumulating evidence indicates that both atherosclerosis and VaD are linked to vascular inflammation. However, the role of TGRL in vascular inflammation, which increases risk for VaD, remains largely unknown and its underlying mechanisms are still unclear. We strived to determine the effects of postprandial TGRL exposure on brain microvascular endothelial cells, the potential risk factor of vascular inflammation, resulting in VaD. We showed in Aung et al., J Lipid Res., 2016 that postprandial TGRL lipolysis products (TL) activate mitochondrial reactive oxygen species (ROS) and increase the expression of the stress-responsive protein, activating transcription factor 3 (ATF3), which injures human brain microvascular endothelial cells (HBMECs) in vitro. In this study, we deployed high-throughput sequencing (HTS)-based RNA sequencing methods and mito stress and glycolytic rate assays with an Agilent Seahorse XF analyzer and profiled the differential expression of transcripts, constructed signaling pathways, and measured mitochondrial respiration, ATP production, proton leak, and glycolysis of HBMECs treated with TL. Conclusions: TL potentiate ROS by mitochondria which activate mitochondrial oxidative stress, decrease ATP production, increase mitochondrial proton leak and glycolysis rate, and mitochondria DNA damage. Additionally, CPT1A1 siRNA knockdown suppresses oxidative stress and prevents mitochondrial dysfunction and vascular inflammation in TL treated HBMECs. TL activates ATF3-MAPKinase, TNF, and NRF2 signaling pathways. Furthermore, the NRF2 signaling pathway which is upstream of the ATF3-MAPKinase signaling pathway, is also regulated by the mitochondrial oxidative stress. We are the first to report differential inflammatory characteristics of transcript variants 4 (ATF3-T4) and 5 (ATF3-T5) of the stress responsive gene ATF3 in HBMECs induced by postprandial TL. Specifically, our data indicates that ATF3-T4 predominantly regulates the TL-induced brain microvascular inflammation and TNF signaling. Both siRNAs of ATF3-T4 and ATF3-T5 suppress cells apoptosis and lipotoxic brain microvascular endothelial cells. These novel signaling pathways triggered by oxidative stress-responsive transcript variants, ATF3-T4 and ATF3-T5, in the brain microvascular inflammation induced by TGRL lipolysis products may contribute to pathophysiological processes of vascular dementia.

Keywords: Activating transcription factor 3; Brain microvascular endothelial cells; Inflammation; Lipolysis; Mitochondrial oxidative stress; RNA-Seq; Triglyceride-rich lipoproteins.


Conflict of interest statement

Disclosures

The authors have no conflicts of interest.

Figures

Figure 1.
Figure 1.. Confirmation of up-regulated gene expression by Triglyceride-rich lipoprotein (TGRL) lipolysis products with qRT-PCR.
Human brain microvascular endothelial cells (HBMECs) were treated with media control (M) or TGRL lipolysis products (TL= TGRL, 150 mg/dL + lipoprotein lipase, 2 U/mL) for 3 h. Expression of each gene was normalized to that of glyceraldehyde 3-phosphate dehydrogenase (GAPDH) by qRT-PCR and fold change was calculated as the ratio of TL to media control. A) Lipolysis-induced top selected differential gene expression; B) TNF signaling-related gene expression; C) NRF2 signaling-related gene expression; D) Pro-inflammatory response gene expression; E) ATF3 transcript variant 4 and 5 gene expression. N = 3/treatment group and results expressed as means ± SEM, *P≤ 0.05 compared to Media control.
Figure 2.
Figure 2.. Effects of ATF3 transcript variant 4 and 5 siRNA.
HBMECs were transfected with ATF3-T4 or ATF3-T5 siRNA for 18 h and treated with TGRL lipolysis products (TL) for 3 h. mRNA expression was determined by qRT-PCR. The expression of each gene was normalized to that of GAPDH and the fold change was calculated as the difference in expression with TGRL lipolysis products (TL) in the presence of scrambled siRNA and ATF3-T4 siRNA or ATF3-T5 siRNA. A) ATF3-T4 mRNA was significantly knocked down after transfection with ATF3-T4 siRNA (N = 3/treatment group, *P≤ 0.05 compared to scrambled Media control); B) ATF3-T5 mRNA was significantly knocked down after transfection with ATF3-T5 siRNA (N = 3/treatment group, *P≤ 0.05 compared to scrambled Media control); C) Alterations in ATF3 gene transcription, ATF3-T4 transcripts, and ATF3-T5 transcripts after transfection with ATF3-T4 siRNA and followed by treatment with TL (N = 3/treatment group, *P≤ 0.05 compared to scrambled TL); D) Alterations in ATF3 gene transcription ATF3-T4 transcripts, and ATF3-T5 transcripts after transfection with ATF3-T5 siRNA and followed by treatment with TL (N = 3/treatment group, *P≤ 0.05 compared to scrambled TL).
Figure 3.
Figure 3.. Control of ATF3 transcript variant 4 and 5 on lipolysis-induced top selected differential gene expression.
HBMECs were transfected with ATF3-T4 or ATF3-T5 siRNA for 18 h and treated with TGRL lipolysis products (TL) for 3 h. mRNA expression was determined by qRT-PCR. The expression of each gene was normalized to that of GAPDH and the fold change was calculated as the difference in expression with TGRL lipolysis products in the presence of scrambled siRNA and ATF3-T4 siRNA or ATF3-T5 siRNA. A) CHAC1, JDP2, and CEBPB were significantly increased and CCL20 was significantly suppressed after transfection with ATF3-T4 siRNA and followed by treatment with TL (N = 3/treatment group, *P≤ 0.05 compared to scrambled TL); B) CHAC1 expression was significantly suppressed after transfection with ATF3-T5 siRNA and followed by treatment with TL (N = 3/treatment group, *P≤ 0.05 compared to scrambled TL).
Figure 4.
Figure 4.. Control of ATF3 transcript variant 4 and 5 on lipolysis-induced TNF signaling-related gene expression.
HBMECs were transfected with ATF3-T4 or ATF3-T5 siRNA for 18 h and treated with TGRL lipolysis products (TL) for 3 h. mRNA expression was determined by qRT-PCR. The expression of each gene was normalized to that of GAPDH and the fold change was calculated as the difference in expression with TGRL lipolysis products in the presence of scrambled siRNA and ATF3-T4 siRNA or ATF3-T5 siRNA. A) CSF2 & SELE/E-Selectin were significantly suppressed and FOSL1 was significantly increased after transfection with ATF3-T4 siRNA and followed by treatment with TL (N = 3/treatment group, *P≤ 0.05 compared to scrambled TL); B) FOSL1, FOSL2. JunB, and JUN were significantly increased and SELE/E-Selectin was significantly suppressed after transfection with ATF3-T5 siRNA and followed by treatment with TL (N = 3/treatment group, *P≤ 0.05 compared to scrambled TL).
Figure 5.
Figure 5.. Control of ATF3 transcript variant 4 and 5 on lipolysis-induced NRF2 signaling-related gene expression.
HBMECs were transfected with ATF3-T4 or ATF3-T5 siRNA for 18 h and treated with TGRL lipolysis products (TL) for 3 h. mRNA expression was determined by qRT-PCR. The expression of each gene was normalized to that of GAPDH and the fold change was calculated as the difference in expression with TGRL lipolysis products in the presence of scrambled siRNA and ATF3-T4 siRNA or ATF3-T5 siRNA. A) NRF2 and PTGS2/COX-2 were significantly suppressed and HOX-1 was significantly increased after transfection with ATF3-T4 siRNA and followed by treatment with TL (N = 3/treatment group, *P≤ 0.05 compared to scrambled TL); B) PTGS2/COX-2 were significantly suppressed and HOX-1 was significantly increased after transfection with ATF3-T5 siRNA and followed by treatment with TL (N = 3/treatment group, *P≤ 0.05 compared to scrambled TL).
Figure 6.
Figure 6.. Control of ATF3 transcript variant 4 and 5 on lipolysis-induced inflammatory response gene expression.
HBMECs were transfected with ATF3-T4 or ATF3-T5 siRNA for 18 h and treated with TGRL lipolysis products (TL) for 3 h. mRNA expression was determined by qRT-PCR. The expression of each gene was normalized to that of GAPDH and the fold change was calculated as the difference in expression with TGRL lipolysis products in the presence of scrambled siRNA and ATF3-T4 siRNA or ATF3-T5 siRNA. A) Significantly suppressed IL-8, IL-1a, ICAM-1, IL-6, and CXCL-2 after transfection with ATF3-T4 siRNA and followed by treatment with TL (N = 3/treatment group, *P≤ 0.05 compared to scrambled TL); B) Significantly increased IL-1a and decreased IL-6after transfection with ATF3-T5 siRNA and followed by treatment with TL (N = 3/treatment group, *P≤ 0.05 compared to scrambled TL).
Figure 7.
Figure 7.. Effects of ATF3 transcript variant 4 and 5 siRNA on lipolysis products-induced protein expression.
HBMECs were transfected with ATF3-T4 or ATF3-T5 siRNA for 18 h and treated with TGRL lipolysis products (TL) for 3 h. Cell lysates were analyzed by western blotting. A) Both transcript variants significantly suppressed lipolysis-induced ATF3; B) Inhibiting with ATF3-T5 siRNA decreased lipolysis-induced JunB, but not with ATF3-T4 siRNA; C) inhibiting with ATF3-T4 siRNA or ATF3-T5 siRNA further increased lipolysis-induced p-c-Jun expression; D) Inhibiting with ATF3-T4 siRNA further increased lipolysis-induced JDP2, but not with ATF3-T5; E) Inhibiting with ATF3-T4 siRNA further increased CHAC1, but not with ATF3-T5 siRNA; F) Inhibiting with ATF3-T4 siRNA or ATF3-T5 siRNA further significantly increased lipolysis-induced ATF4; G) inhibiting with ATF3-T4 siRNA significantly decreased lipolysis-induced DR5, but not with ATF3-T5 siRNA; H) inhibiting with ATF3-T4 siRNA or ATF3-T5 siRNA further increased TNFR1; I) inhibiting with ATF3-T4 siRNA or ATF3-T5 siRNA decreased lipolysis-induced NRF2; J) Inhibiting with ATF3-T4 siRNA or ATF3-T5 siRNA suppressed lipolysis-induced eIF2α; K) Inhibiting with ATF3-T4 siRNA or ATF3-T5 siRNA suppressed lipolysis-induced COX-2; L) Inhibiting with ATF3-T4 siRNA suppressed lipolysis-induced cleaved capase-9, but further increased ATF3-T5 siRNA; M) Inhibiting with ATF3-T5 siRNA suppressed lipolysis-induced PARP, but no change with ATF3-T4 siRNA; N) Both transcript variants suppressed lipolysis-activated active caspase-3; O) Inhibiting with ATF3-T4 siRNA further increased p53, but suppressed with ATF3-T5 siRNA. N = 3/treatment group.
Figure 8.
Figure 8.. Cytokine/Chemokine secretion by lipolysis products.
HBMECs were treated with media control (Media) or TGRL lipolysis products (TL= TGRL, 150 mg/dL + lipoprotein lipase, 2 U/mL) for 3 h and the supernatant was collected. For siRNA treatment, cells were transfected with scrambled siRNA and ATF3-T4 siRNA or ATF3-T5 siRNA 18 h prior to lipolysis product exposure. Cytokine/chemokine secretion in cells supernatant were measured by ELISA. A) Lipolysis products significantly increased IL-8 secretion (N = 5/treatment group, *P≤ 0.05 compared to Media control); B) inhibiting with ATF3-T4 siRNA significantly suppressed lipolysis products-induced IL-8 secretion, but not ATF3-T5 siRNA (N = 5/treatment group, P≤ 0.05, *= scrambled TL compared to scrambled control, # = ATF3-T4 siRNA TL compared to scrambled TL); C) Lipolysis products significantly decreased IL-6 secretion (N = 5/treatment group, *P≤ 0.05 compared to Media control); D) Lipolysis products significantly decreased CCL-2/MCP-1 secretion (N = 5/treatment group, *P≤ 0.05 compared to Media control).
Figure 9.
Figure 9.. Lipolysis products decreased mitochondrial respiratory reserve capacity.
HBMECs were injected port A-D with (1) lipolysis products for 30 min and followed by (2) 1 μM Oligomycin, (3) 1 μM FCCP, and (4) 0.5 μM rotenone combined with 0.5 μM antimycin A were added sequentially to measure cellular respiration parameters (basal respiration, maximal respiration, spare respiratory capacity and non-mitochondrial respiration). A mitochondrial respiration measurement of oxygen consumption rate (OCR) was performed during acute TGRL lipolysis products treatment using the XF Cell miniplate Seahorse system. A) Raw trace of OCR regulated by lipolysis products; B) reduced mitochondrial respiration or oxygen consumption; C) reduced ATP production; D) increased proton leak compared to media control treatment; E) Profile of Aglient Seahorse XF Mito stress test. N = 6 wells/treatment group and values are expressed as means ± SEM, *P≤0.05, compared to control group at the same time point.
Figure 10.
Figure 10.. Lipolysis products increased glycolytic rate.
HBMECs were assayed for both oxygen consumption rate (OCR) and extracellular acidification rate (ECAR) in DMEM Base Medium without phenol red, supplemented with 10 mM glucose, 2 mM glutamine, 1 mM pyruvate, 5 mM HEPES, pH 7.4. Cells were injected port A-C with (1) media control or lipolysis products for 30 min and followed by (2) 0.5 μM rotenone combined with 0.5 μM antimycin A, and (3) 2DG were added sequentially to measure cellular respiration parameters (basal respiration, maximal respiration, spare respiratory capacity and non-mitochondrial respiration). A glycolytic rate measurement of OCR and ECAR were performed during acute TGRL lipolysis products treatment using the XF Cell miniplate Seahorse system. A) Raw trace of oxygen consumption rate (OCR); B) Raw trace of extracellular acidification rate (ECAR); C) Increased glycolytic rate; D) Profile of Aglient Seahorse XF Glycolytic rate test. N = 6 wells/treatment group and values are expressed as means ± SEM, *P≤0.05, compared to control group at the same time point.
Figure 11.
Figure 11.. Mitochondrial DNA copy number.
HBMECs were treated with control M or TGRL lipolysis products (TL) for 3 h. The relative mitochondrial DNA (mtDNA) copy number was defined as the total amount of mtDNA (ND1, CO1, and Cyb) divided by the total amount of nuclear DNA (B2M) using qRT-PCR analysis. A) TL significantly decreased mitochondrial DNA copy number. B) CPT1A1 siRNA significantly recovered TL-induced mitochondrial DNA copy number or dysfunction. N = 3/treatment group and the values are expressed as means ± SEM, *P≤0.05, TL compared to M group or TL treated CPT1A1 siRNA compared to Scrambled siRNA at the same time point.
Figure 12.
Figure 12.. Regulation of CPT1A1 on TL-induced oxidative stress responsive gene expression.
HBMECs were transfected with CPT1A1 siRNA for 48 h and treated with TGRL lipolysis products (TL) for 3 h. mRNA expression was determined by qRT-PCR. The expression of each gene was normalized to that of GAPDH and the fold change was calculated as the difference in expression with TGRL lipolysis products in the presence of scrambled siRNA and CPT1A1 siRNA. A) TL did not alter CPT1A1 mRNA expression B) CPT1A1 mRNA was significantly knocked down after transfection with CPT1A1 siRNA (N = 3/treatment group, *P≤ 0.05, CPT1A1 siRNA compared to scrambled Media control); C) Significantly suppressed oxidative stress responsive genes (EIF2AK3, NRF2, HIF1A, HOX-1, COX-2, CAT, and NQO1) and did not alter mitochondrial SOD-2 expression; D) Significantly suppressed stress responsive transcription factors (ATF3-T4 and ATF3-T5) and pro-inflammatory genes (SELE/E-Selectin and IL-8) and did not alter IL-6 expression after transfection with CPT1A1 siRNA and followed by treatment with TL (N = 3/treatment group and values are expressed as means ± SEM,*P≤ 0.05, compared to scrambled TL).
Figure 13.
Figure 13.. TGRL lipolysis products-activated superoxide radical (O2−.) in supernatant solution.
HBMECs were treated with media (M) or TGRL lipolysis products (TL) for 15 min. Supernatant solutions from the alternatively treated cells were incubated with the diamagnetic (EPR-silent) CP-H spin trap and scanned by EPR. A) TL-activated O2−. generation and the intensity of the 3-line nitroxide spectrum is indicative of the rate of CP-H oxidation, which generates the paramagnetic nitroxide species; B) Quantification of oxidized CP-H signal is shown in panel. N = 3 /treatment group and results expressed as means ± SEM. p ≤ 0.05 was considered significant. * = TL compared to M.
Figure 14.
Figure 14.. TGRL lipolysis products induced lipid droplet (LD) formation and increased lipid uptake in HBMEC.
A) LD formations were observed in TL-treated cells by Oil Red O staining (Red color), which detects neutral lipid deposits, and Nile Red staining (Green), which detects detectscholesteryl esters and triacylglycerols (bar = 15 μm), N = 4 coverslips/treatment group; B) TGRL concentration significantly increased in TL treated HBMECs. N = 15 samples/treatment group and results expressed as means ± SEM. p ≤ 0.05 was considered significant. * = TL compared to M.

Similar articles

Cited by

References

    1. Alzheimer’s Association, 2018 Alzheimer’s Disease Facts and Figures, Alzheimers Dement. 14 (2018) 367–429.
    1. Craft S, The role of metabolic disorders in Alzheimer disease and vascular dementia: two roads converged, Arch Neurol 66 (2009) 300–305. - PMC - PubMed
    1. Grammas P, Neurovascular dysfunction, inflammation and endothelial activation: implications for the pathogenesis of Alzheimer’s disease, J Neuroinflammation 8 (2011) 26. - PMC - PubMed
    1. Goldwaser EL, Acharya NK, Nagele RG, Cerebrovascular and Blood-Brain Barrier Compromise: A Mechanistic Link between Vascular Disease and Alzheimer’s Disease Subtypes of Neurocognitive Disorders, J Parkinsons Dis Alzheimer Dis. 2 (2015) 10.
    1. Hildreth KL, Van Pelt RE, Schwartz RS, Obesity, insulin resistance, and Alzheimer’s disease, Obesity (Silver Spring) 20 (2012) 1549–1557. - PMC - PubMed

Publication types

MeSH terms