. 2019 Nov 15:202:116048.
doi: 10.1016/j.neuroimage.2019.116048. Epub 2019 Jul 26.

Replication and generalization in applied neuroimaging

Affiliations

Replication and generalization in applied neuroimaging

Garikoitz Lerma-Usabiaga et al. Neuroimage. .

Abstract

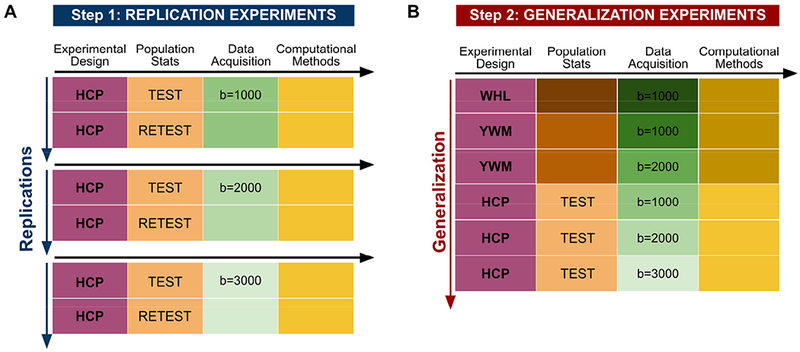
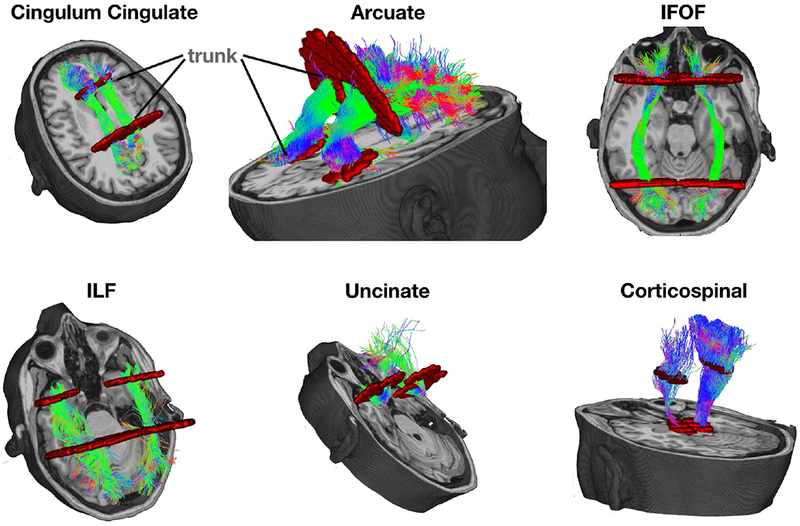
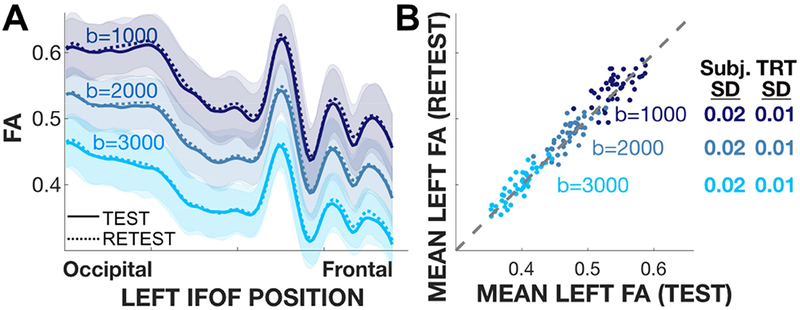
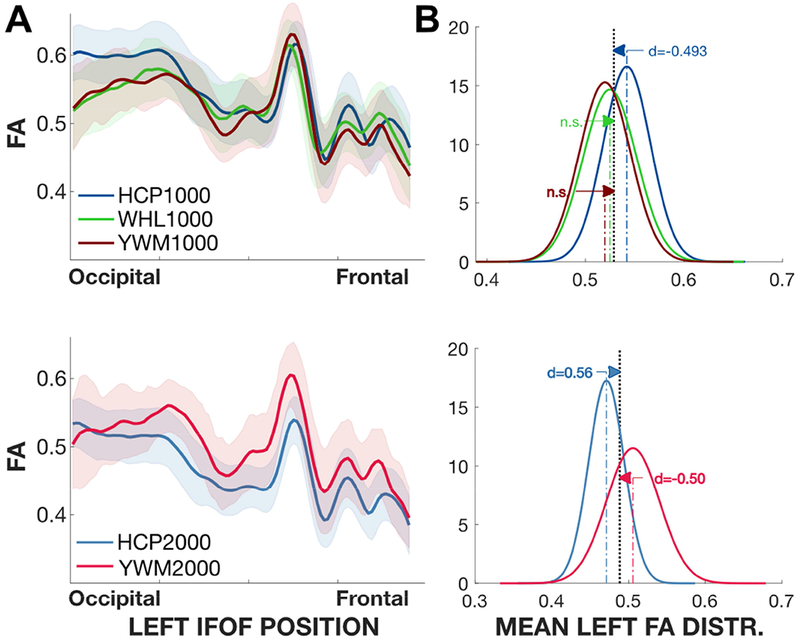
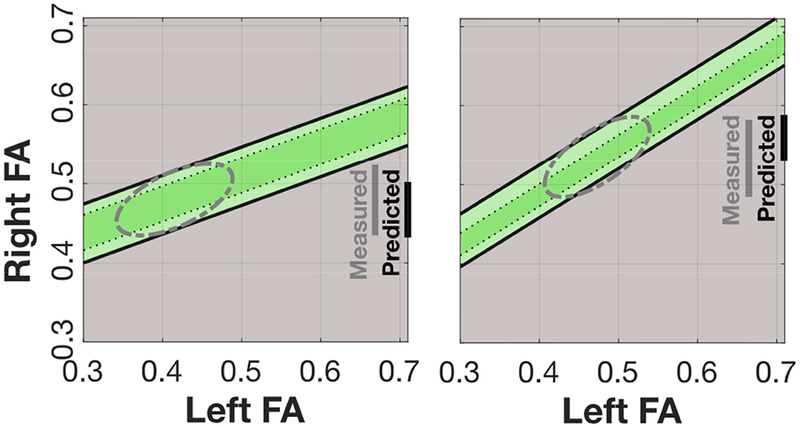
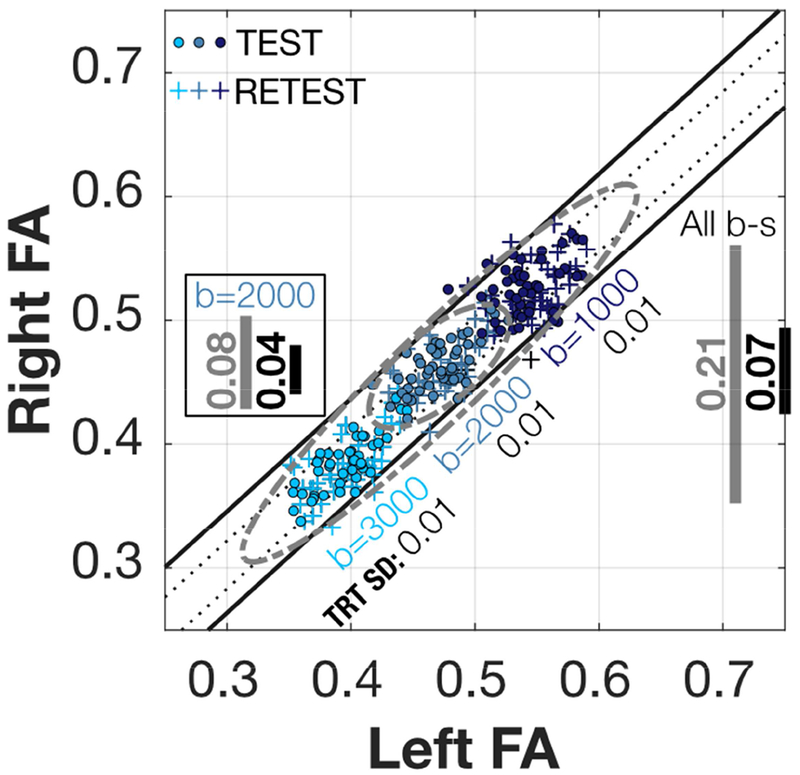
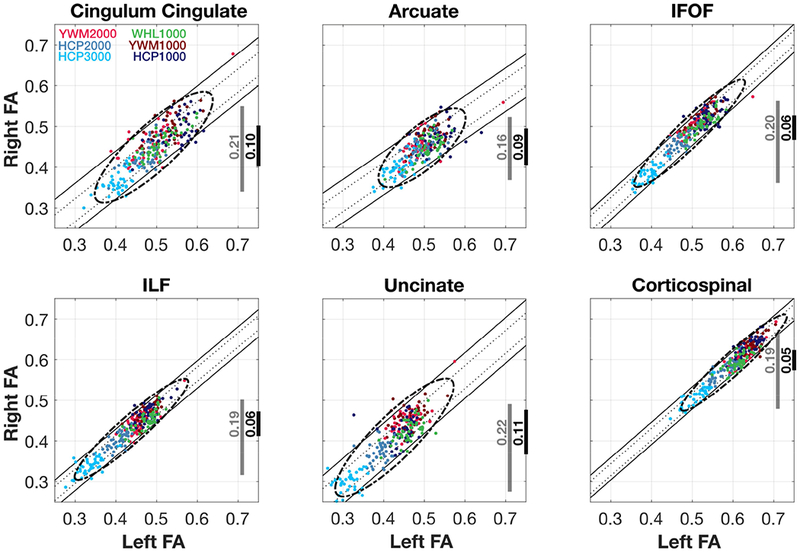
There is much interest in translating neuroimaging findings into meaningful clinical diagnostics. The goal of scientific discoveries differs from clinical diagnostics. Scientific discoveries must replicate under a specific set of conditions; to translate to the clinic we must show that findings using purpose-built scientific instruments will be observable in clinical populations and instruments. Here we describe and evaluate data and computational methods designed to translate a scientific observation to a clinical setting. Using diffusion weighted imaging (DWI), Wahl et al. (2010) observed that across subjects the mean fractional anisotropy (FA) of homologous pairs of tracts is highly correlated. We hypothesize that this is a fundamental biological trait that should be present in most healthy participants, and deviations from this assessment may be a useful diagnostic metric. Using this metric as an illustration of our methods, we analyzed six pairs of homologous white matter tracts in nine different DWI datasets with 44 subjects each. Considering the original FA measurement as a baseline, we show that the new metric is between 2 and 4 times more precise when used in a clinical context. Our framework to translate research findings into clinical practice can be applied, in principle, to other neuroimaging results.

Keywords: Biomarker; Computational reproducibility; DWI; Generalizability; Generalization; Replication; Structural MRI; White matter tracts.


Conflict of interest statement

Competing financial interests

The authors declare that the research was conducted in the absence of any commercial or financial relationships that could be construed as a potential conflict of interest. Brian Wandell is a co-founder of Flywheel.io.

Figures

Figure 1.
Figure 1.. Summary of the individual experiments, organized as replication or generalization experiments.
The columns correspond to the experimental pipeline steps; every row corresponds to an experiment. Different colors represent different steps in the experimental pipeline; different shades represent implementation differences within the step. A) Three replication experiments, based on the Human Connectome Project (HCP) test-retest datasets. The difference among the experiments is the b-value used in the acquisition. In a replication experiment, the intention is to repeat the original methods as far as possible, hence the same shades; the test-retest case goes uses the same population and instrumentation at different times. B) The generalization experiment reflects the transition to the clinical environment. The goal is to evaluate whether the measurements are robust to expected variations in the measurement conditions. The generalization is undertaken after validating the results in the replication experiment. The datasets are from Wahl et al (2010) (WHL). Yeatman et al. (2014) (YWM), and (Glasser et al., 2013) (HCP).
Figure 2.
Figure 2.. Six pairs of homologous tracts and their defining ROIs.
The streamlines serve as a model of white matter tracts; they are selected by fitting to the diffusion weighted imaging (DWI) measurements. The tracts are defined by regions of interest (ROIs, red) that select specific streamlines from the whole brain tractogram. The region between the two ROIs is relatively stable and called the trunk. We estimate a core fiber from the collection of streamlines and sample 100 equally spaced segments. The FA of the core fiber is calculated by combining FA transverse to the core fiber at every sample point, using a Gaussian weighting scheme over distance. The set of sample points is the tract profile; the average of the FA values of the core fiber is the mean tract FA.
Figure 3.
Figure 3.. Replication analyses of the tract profile and mean tract FA.
Analyses are shown for a representative tract (left IFOF), and based on the HCP test-retest data. A) Tract profiles of the subject average FA in the test (solid) and retest (dashed) experiments. The mean profile (thin line) and ±1 SD (shaded band) are shown. The profiles at each b-value match very closely; across b-values the profiles have a similar shape but different absolute values. B) Test-retest scatter plot. For all b-values, the SD of the difference between the test-retest pairs of FA values is 0.01 (TRT SD), and the SD of the distribution of FA values is 0.02 (Subj. SD). (Tract profiles and scatter plots for 11 other tracts are similar and reported in Figures S1a, S2).
Figure 4.
Figure 4.. FA Analyses for the generalization experiment and selected tracts.
Top: Left Corticospinal. Bottom: Left IFOF. A) The curves show the average FA tract profiles for different experiments. The shaded region is ±1 SD. B) Normal distribution summary of the mean FA values in each experiment. The mean is the average of the FA values of each participant’s profile. The grey plot shows the distribution for all experiments; the curves are scaled so that the sum of the areas of the experiments equals the grey area. The arrows show the difference between each of the means and the group mean, and the numbers express effect size (Cohen’s d). The distributions were estimated using 10,000 bootstrap samples. C) Mean FA values and 90% experimental confidence intervals. n.s.: non-significant. Plots for additional tracts are in the Supplementary Materials (Figure S1b–S1c–S3a–S3b).
Figure 5.
Figure 5.. Representation of the relation between homologous tracts
The linear correlation between mean FA in homologous white matter tracts defines a band of predicted right FA values given a left FA value. Measurements across clinically relevant cases, including variations in population, data acquisition, and computational methods, define the correlation and the size and shape of this region. For each tract, a participant’s data may fall inside or outside the green region, and this serves as a diagnostic of their white matter health. Measured: the range of Right FA values. Predicted: the size of the range ofpredicted Right FA values given a Left FA value (vertical height of the green band).
Figure 6.
Figure 6.. Left-Right IFOF FA scatterplots and iso-residual contour lines for HCP
Scatterplot of the Left-Right IFOF HCP mean FA values. Inside the square, the grey line (0.08) shows the 95% range of all Right FA values for b=2000, and the black line (0.04) shows the range of possible values for any given Left FA value. Although not pictured, the values when using the b=2000 test-retest data points increases to 0.09 and 0.05. Outside the square to the right, the grey line (0.21) shows the 95% range of all right FA values for the combined six HCP Test-Retest values. The diagonal bands are the contour lines holding the 68% and 95% of the residuals from the linear model fitted to all the six datasets. See Figure S4a for the rest of the tracts.
Figure 7.
Figure 7.. Homologous tract Left-Right FA scatterplots and iso-residual contour lines
Scatterplot of the Left-Right mean FA for all tracts and all projects. The grey vertical lines shows the 95% range of all Right FA values, and the black line the range of possible values for any given Left FA value. The diagonal bands are the iso-residual contour lines holding the 68% and 95% of the residuals from the linear model fitted to all the six datasets.

References

    1. Acheson A, Wijtenburg SA, Rowland LM, Winkler A, Mathias CW, Hong LE, Jahanshad N, Patel B, Thompson PM, McGuire SA, Sherman PM, Kochunov P, Dougherty DM, 2017. Reproducibility of tract-based white matter microstructural measures using the ENIGMA-DTI protocol. Brain Behav. 7, e00615. - PMC - PubMed
    1. Adhikari BM, Jahanshad N, Shukla D, Turner J, Grotegerd D, Dannlowski U, Kugel H, Engelen J, Dietsche B, Krug A, Kircher T, Fieremans E, Veraart J, Novikov DS, Boedhoe PSW, van der Werf YD, van den Heuvel OA, Ipser J, Uhlmann A, Stein DJ, Dickie E, Voineskos AN, Malhotra AK, Pizzagalli F, Calhoun VD, Waller L, Veer IM, Walter H, Buchanan RW, Glahn DC, Hong LE, Thompson PM, Kochunov P, 2018. A resting state fMRI analysis pipeline for pooling inference across diverse cohorts: an ENIGMA rs-fMRI protocol. Brain Imaging Behav. 10.1007/s11682-018-9941-x - DOI - PMC - PubMed
    1. Andersson JLR, Skare S, Ashburner J, 2003. How to correct susceptibility distortions in spin-echo echo-planar images: application to diffusion tensor imaging. Neuroimage 20, 870–888. - PubMed
    1. Andersson JLR, Sotiropoulos SN, 2016. An integrated approach to correction for off-resonance effects and subject movement in diffusion MR imaging. Neuroimage 125, 1063–1078. - PMC - PubMed
    1. Andersson JLR, Sotiropoulos SN, 2015. Non-parametric representation and prediction of single- and multi-shell diffusion-weighted MRI data using Gaussian processes. Neuroimage 122, 166–176. - PMC - PubMed

Publication types