. 2019 Nov:82:25-35.
doi: 10.1016/j.bbi.2019.07.028. Epub 2019 Jul 26.

Combination of cannabinoids, delta-9-tetrahydrocannabinol (THC) and cannabidiol (CBD), mitigates experimental autoimmune encephalomyelitis (EAE) by altering the gut microbiome

Affiliations

Combination of cannabinoids, delta-9-tetrahydrocannabinol (THC) and cannabidiol (CBD), mitigates experimental autoimmune encephalomyelitis (EAE) by altering the gut microbiome

Zinah Zamil Al-Ghezi et al. Brain Behav Immun. 2019 Nov.

Abstract

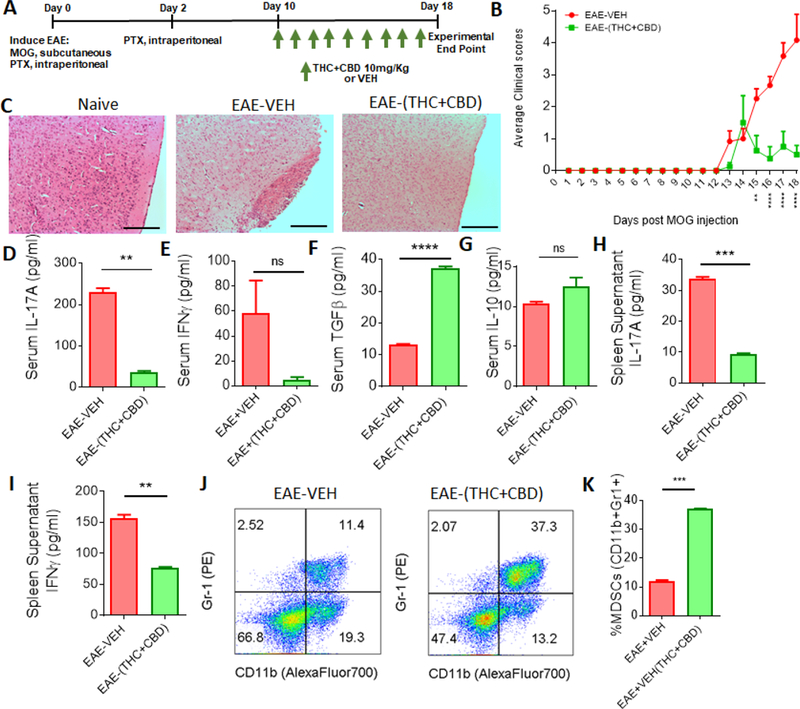
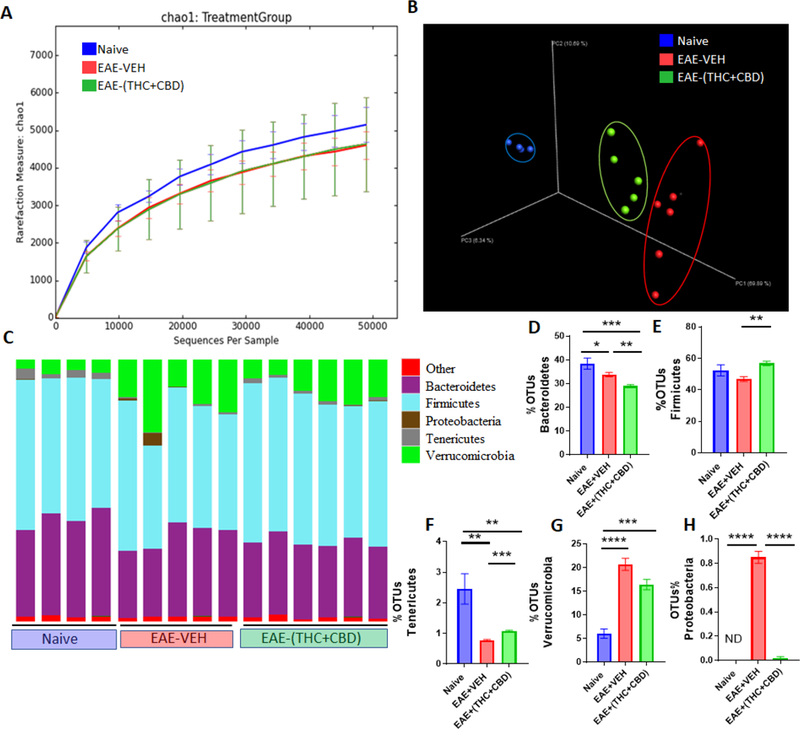
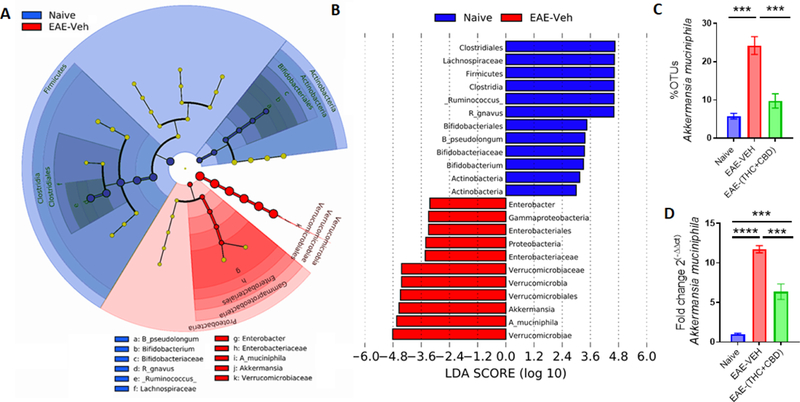
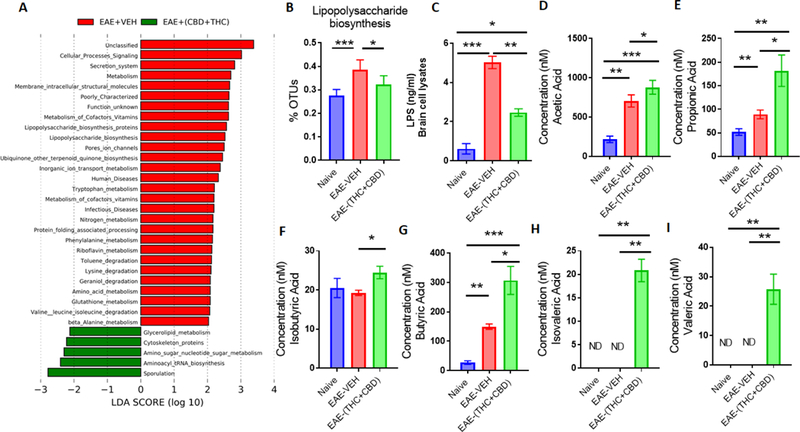
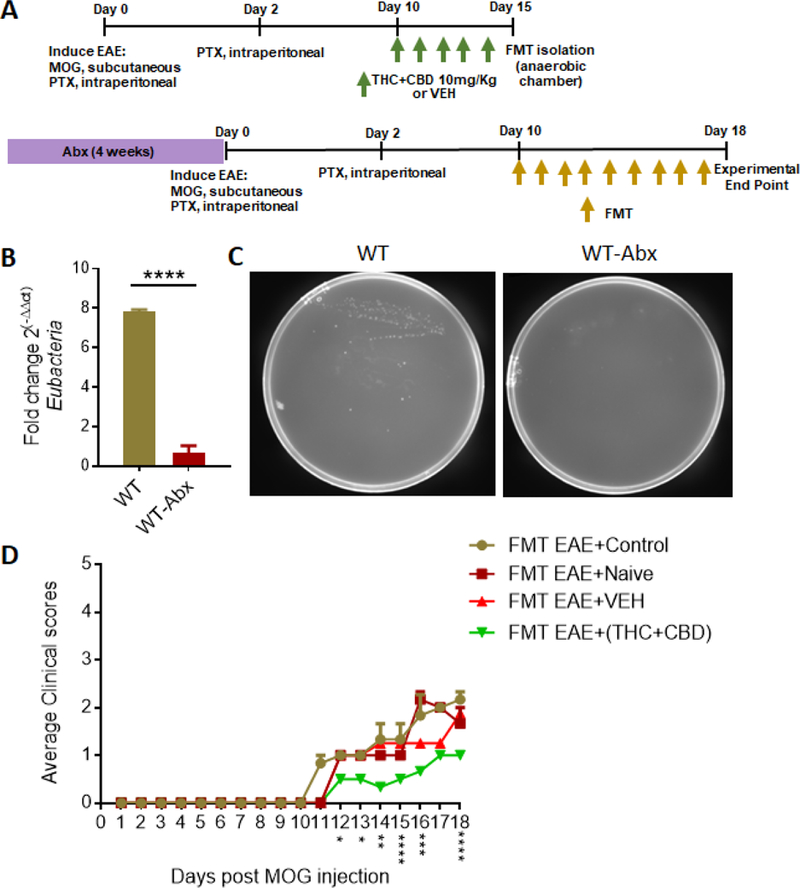
Currently, a combination of marijuana cannabinoids including delta-9-tetrahydrocannabinol (THC) and cannabidiol (CBD) is used as a drug to treat muscle spasticity in patients with Multiple Sclerosis (MS). Because these cannabinoids can also suppress inflammation, it is unclear whether such patients benefit from suppression of neuroinflammation and if so, what is the mechanism through which cannabinoids act. In the currently study, we used a murine model of MS, experimental autoimmune encephalomyelitis (EAE), to study the role of gut microbiota in the attenuation of clinical signs of paralysis and inflammation caused by cannabinoids. THC + CBD treatment attenuated EAE and caused significant decrease in inflammatory cytokines such as IL-17 and IFN-γ while promoting the induction of anti-inflammatory cytokines such as IL-10 and TGF-β. Use of 16S rRNA sequencing on bacterial DNA extracted from the gut revealed that EAE mice showed high abundance of mucin degrading bacterial species, such as Akkermansia muciniphila (A. muc), which was significantly reduced after THC + CBD treatment. Fecal Material Transfer (FMT) experiments confirmed that THC + CBD-mediated changes in the microbiome play a critical role in attenuating EAE. In silico computational metabolomics revealed that LPS biosynthesis, a key component in gram-negative bacteria such as A. muc, was found to be elevated in EAE mice which was confirmed by demonstrating higher levels of LPS in the brain, while treatment with THC + CBD reversed this trend. EAE mice treated with THC + CBD also had significantly higher levels of short chain fatty acids such as butyric, isovaleric, and valeric acids compared to naïve or disease controls. Collectively, our data suggest that cannabinoids may attenuate EAE and suppress neuroinflammation by preventing microbial dysbiosis seen during EAE and promoting healthy gut microbiota.

Keywords: Akkermansia muciniphila; CBD; EAE; Gut microbiome; LPS; Multiple sclerosis; SCFAs; THC.


Conflict of interest statement

Conflict of Interest: The authors declare that there is no conflict of interest to report.

Figures

Figure 1.
Figure 1.. Combination THC+CBD treatment attenuates EAE disease severity and promotes anti-inflammatory immune response.
(A) Experimental design of EAE using combined treatment of THC+CBD (10mg/kg). (B) Clinical scores, outlined in the Materials and Methods section, of EAE mice treated with VEH (n = 10) or THC+CBD (n = 10). Significance was determined using two-way ANOVA and Tukey’s multiple comparisons test to evaluate significance at each day. Significant p values (*P < 0.05, **P < 0.01, ***P < 0.001 and ****P < 0.0001) are indicated below respective days after EAE induction. (C) Representative images of brain histopathology stained with H&E (10×) at day 15 from experimental groups: Naïve, EAE+VEH, and EAE+THC; scale bars, 100 µM. (D-G) Serum was collected at the peak of the disease (day 15) to determine levels of IL-17A (D), IFN-γ (E), TGF-β (F), and IL-10 (G). (H-I) Supernatants from cultured splenocytes were collected after 24hrs to analyze IL-17A (H) and IFN-γ (I) by ELISA. (J-K) Representative flow cytometry plots(J) to determine MDSC (Gr-1+CD11b+) percentages (K). Bar graph data are expressed as the mean ± SEM and statistical significance is indicated as *P < 0.05, **P < 0.01, ***P < 0.001 and ****P < 0.0001 when compared between EAE-VEH and EAE-(THC+CBD) unless otherwise stated.
Figure 2.
Figure 2.. THC+CBD alters the gut microbiome during EAE disease.
(A-B)16S rRNA sequencing from the cecal flushes was performed on Naive (n=4), EAE-VEH (n=5), and EAE-(THC+CBD) (n=6) experimental mice and data are representative of one experiment. Sequenced reads were analyzed using Nephele to generate chao1 alpha diversity (A) and beta diversity PCOA (B) plots. (C) Depicted stacked bar graphs of percent OTUs at the phylum level. (D-H) Individual bar graphs are depicted for the following phylum level: Bacteriodetes (D), Firmicutes (E), Tenericutes (F), Verrucomicrobia (G), and Proteobacteria (H). Bar graph data are expressed as the mean ± SEM and statistical significance is indicated as *P < 0.05, **P < 0.01, ***P < 0.001 and ****P < 0.0001. Significance was determined using one-way ANOVA and Tukey’s multiple comparisons test.
Figure 3.
Figure 3.. LefSE analysis identifies A.Muc as a potential biomarker of EAE disease, which is reduced after THC+CBD treatment.
(A-B)16S rRNA sequencing from the cecal flushes was performed on Naive (n=4), EAE-VEH (n=5), and EAE-(THC+CBD) (n=6) experimental mice and OTU data was subjected to LefSE analysis to generate cladogram (A) and LDA scores (B) between Naïve and EAE-VEH groups. For LefSe data, the alpha factorial Kruskal-Wallis test among classes was set to 0.05, and the threshold on the logarithmic LDA score for discriminative features was set at3. (C) Bar graph depicting the percent OTUs of A.Muc generated from 16S rRNA sequencing in Naïve, EAE-VEH, and EAE-(THC+CBD) groups. (D) Bar graph depicting PCR validation and fold change of A.Muc in Naïve (n=5), EAE-VEH (n=5), and EAE-(THC+CBD) (n=5) groups. Bar graph data are expressed as the mean ± SEM and statistical significance is indicated as *P < 0.05, **P < 0.01, ***P < 0.001 and ****P < 0.0001. Significance was determined using one-way ANOVA and Tukey’s multiple comparisons test.
Figure 4.
Figure 4.. THC+CBD alters the gut microbiome metabolome during EAE disease.
(A) LDA scores between EAE-VEH and EAE-(THC+CBD) groups using PICRUSt-generated Level 3 (L3) KEGG pathways of 16S rRNA sequencing data from Naive (n=4), EAE-VEH (n=5), and EAE-(THC+CBD) (n=6) experimental mice. (B) Individual bar graph depicting percent OTUs attributed to LPS biosynthesis from Naive (n=4), EAE-VEH (n=5), and EAE-(THC+CBD) (n=6) experimental mice after PICRUSt analysis. (C) Concentration of LPS levels from cultured brain lysates detected by ELISA for Naive (n=5), EAE-VEH (n=5), and EAE-(THC+CBD) (n=5) samples. (D-I) Concentrations of SCFAs from cecal flushes of Naive (n=5), EAE-VEH (n=5), and EAE-(THC+CBD) (n=5) samples. Bar graph data are expressed as the mean ± SEM and statistical significance is indicated as *P < 0.05, **P < 0.01, ***P < 0.001 and ****P < 0.0001. Significance was determined using one-way ANOVA and Tukey’s multiple comparisons test.
Figure 5.
Figure 5.. FMT of THC+CBD altered microbiome attenuates EAE severity.
(A) Experimental design of FMT EAE experiments where 4-week Abx-treated mice received FMTs (50mg) from either Control PBS (n=3), Naïve (n=3), EAE-VEH (n=5), or EAE-(THC+CBD) (n=5) mice. (B) PCR validation confirming Abx mice had depleted microbiome. Depicted is the fold change of Eubacteria normalized to 18S compared between WT(n=5) and WT+Abx (n=5). Bar graph data are expressed as the mean ± SEM and statistical significance is indicated as *P < 0.05, **P < 0.01, ***P < 0.001 and ****P < 0.0001 (C) Representative feces cultured plates from WT (n=4) and WT+Abx (n=4) mice to confirm depletion of microbiome. (D) Clinical scores, outlined in the Materials and Methods section, of FMT EAE mice treated with Control PBS (n=3), Naïve (n=3), EAE-VEH (n=5), or EAE-(THC+CBD) (n=5) fecal material. Significance was determined using two-way ANOVA and Tukey’s multiple comparisons test to evaluate significance at each day. Significant p values (*P < 0.05, **P < 0.01, ***P < 0.001 and ****P < 0.0001) are indicated below respective days after EAE induction.

References

    1. Alrafas HR, Busbee PB, Nagarkatti M, Nagarkatti PS, 2019. Resveratrol modulates the gut microbiota to prevent murine colitis development through induction of Tregs and suppression of Th17 cells. J Leukoc Biol - PMC - PubMed
    1. Andre CM, Hausman JF, Guerriero G, 2016. Cannabis sativa: The Plant of the Thousand and One Molecules. Frontiers in plant science 7, 19. - PMC - PubMed
    1. Baxter AG, 2007. The origin and application of experimental autoimmune encephalomyelitis. Nature reviews. Immunology 7, 904–912. - PubMed
    1. Berer K, Mues M, Koutrolos M, Rasbi ZA, Boziki M, Johner C, Wekerle H, Krishnamoorthy G, 2011. Commensal microbiota and myelin autoantigen cooperate to trigger autoimmune demyelination. Nature 479, 538–541. - PubMed
    1. Bhutia YD, Ganapathy V, 2015. Short, but Smart: SCFAs Train T Cells in the Gut to Fight Autoimmunity in the Brain. Immunity 43, 629–631. - PMC - PubMed

Publication types

MeSH terms