Rapid or Slow Time to Brain Death? Impact on Kidney Graft Injuries in an Allotransplantation Porcine Model
- PMID: 31357488
- PMCID: PMC6696377
- DOI: 10.3390/ijms20153671
Rapid or Slow Time to Brain Death? Impact on Kidney Graft Injuries in an Allotransplantation Porcine Model
Abstract
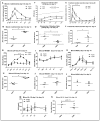
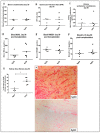
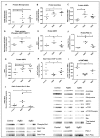
The use of donors deceased after brain death (DBD) with extended criteria in response to the shortage of grafts leads to the removal of more fragile kidneys. These grafts are at greater risk of not being grafted or delayed function. A better knowledge of the pathophysiology of DBDs would improve this situation. There is a difference between the results from animal models of DBD and the clinical data potentially explained by the kinetics of brain death induction. We compared the effect of the induction rate of brain death on the recovery of post-transplant renal function in a pig model of DBD followed by allografts in nephrectomized pigs. Resumption of early function post-transplant was better in the rapidly generated brain death group (RgBD) and graft fibrosis at three months less important. Two groups had identical oxidative stress intensity but a greater response to this oxidative stress by SIRT1, PGC1-α and NRF2 in the RgBD group. Modulation of mechanistic target of rapamycin (mTOR) stimulation by NRF2 would also regulate the survival/apoptosis balance of renal cells. For the first time we have shown that an allostatic response to oxidative stress can explain the impact of the rapidity of brain death induction on the quality of kidney transplants.
Keywords: allostasis; brain death; kidney; mechanistic target of rapamycin; nuclear factor erythroid-2-related factor 2; oxidative stress; transplantation.
Conflict of interest statement
The authors declare no conflict of interest.
Figures


Similar articles
-
Kidney transplantation from donation after cardiac death donors: lack of impact of delayed graft function on post-transplant outcomes.Clin Transplant. 2011 Mar-Apr;25(2):255-64. doi: 10.1111/j.1399-0012.2010.01241.x. Clin Transplant. 2011. PMID: 20331689
-
α-Melanocyte stimulating hormone treatment in pigs does not improve early graft function in kidney transplants from brain dead donors.PLoS One. 2014 Apr 11;9(4):e94609. doi: 10.1371/journal.pone.0094609. eCollection 2014. PLoS One. 2014. PMID: 24728087 Free PMC article.
-
A comparison of inflammatory, cytoprotective and injury gene expression profiles in kidneys from brain death and cardiac death donors.Transplantation. 2014 Jul 15;98(1):15-21. doi: 10.1097/TP.0000000000000136. Transplantation. 2014. PMID: 24901651
-
Kidney donation after circulatory death (DCD): state of the art.Kidney Int. 2015 Aug;88(2):241-9. doi: 10.1038/ki.2015.88. Epub 2015 Mar 18. Kidney Int. 2015. PMID: 25786101 Review.
-
Results of kidney transplantation from donors after cardiac death.Transplant Proc. 2010 Sep;42(7):2407-14. doi: 10.1016/j.transproceed.2010.07.055. Transplant Proc. 2010. PMID: 20832517 Review.
Cited by
-
New Insights in Molecular Mechanisms and Pathophysiology of Ischemia-Reperfusion Injury 2.0: An Updated Overview.Int J Mol Sci. 2020 Dec 22;22(1):28. doi: 10.3390/ijms22010028. Int J Mol Sci. 2020. PMID: 33375111 Free PMC article.
-
Astragaloside IV Ameliorates Streptozotocin Induced Pancreatic β-Cell Apoptosis and Dysfunction Through SIRT1/P53 and Akt/GSK3β/Nrf2 Signaling Pathways.Diabetes Metab Syndr Obes. 2022 Jan 13;15:131-140. doi: 10.2147/DMSO.S347650. eCollection 2022. Diabetes Metab Syndr Obes. 2022. PMID: 35046684 Free PMC article.
-
Cascading renal injury after brain death: Unveiling glycocalyx alteration and the potential protective role of tacrolimus.Front Cell Dev Biol. 2024 Aug 6;12:1449209. doi: 10.3389/fcell.2024.1449209. eCollection 2024. Front Cell Dev Biol. 2024. PMID: 39165663 Free PMC article.
-
Evaluation of Liver Quality after Circulatory Death Versus Brain Death: A Comparative Preclinical Pig Model Study.Int J Mol Sci. 2020 Nov 27;21(23):9040. doi: 10.3390/ijms21239040. Int J Mol Sci. 2020. PMID: 33261172 Free PMC article.
-
Considerations for the use of porcine organ donation models in preclinical organ donor intervention research.Animal Model Exp Med. 2024 Jun;7(3):283-296. doi: 10.1002/ame2.12411. Epub 2024 Apr 30. Animal Model Exp Med. 2024. PMID: 38689510 Free PMC article. Review.
References
MeSH terms
Substances
Grants and funding
LinkOut - more resources
Full Text Sources
Medical
Miscellaneous

