. 2019 Jul 28;11(8):1066.
doi: 10.3390/cancers11081066.

Diminished Condensin Gene Expression Drives Chromosome Instability That May Contribute to Colorectal Cancer Pathogenesis

Affiliations

Diminished Condensin Gene Expression Drives Chromosome Instability That May Contribute to Colorectal Cancer Pathogenesis

Allison K Baergen et al. Cancers (Basel). .

Abstract

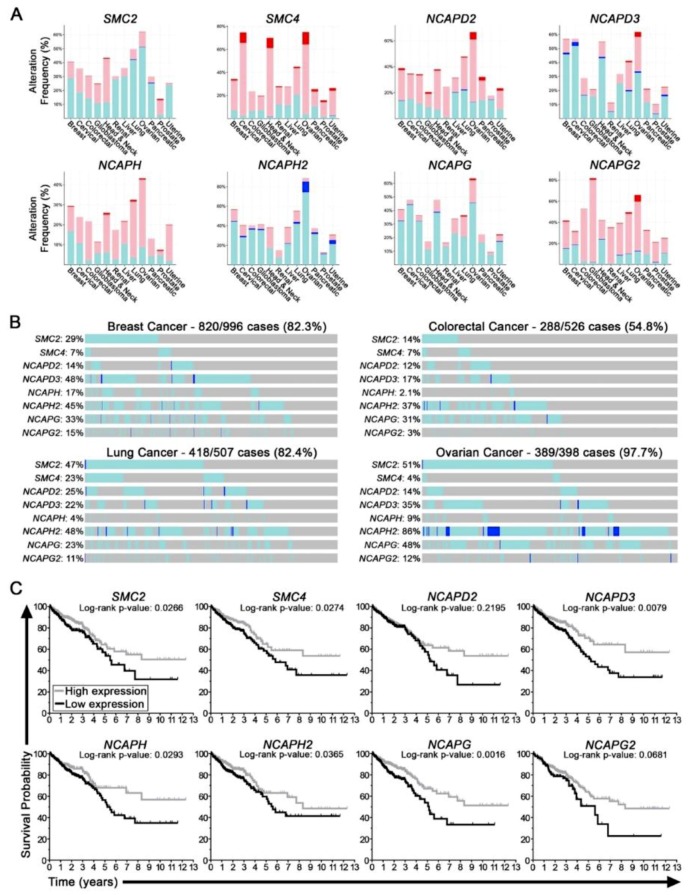
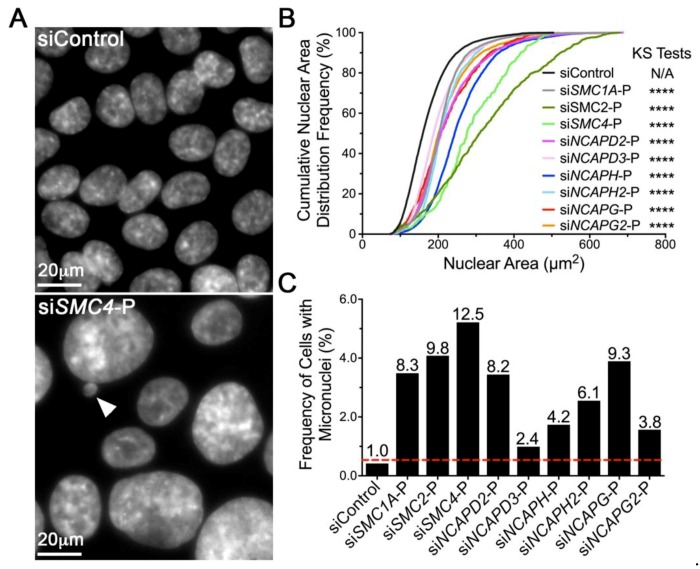
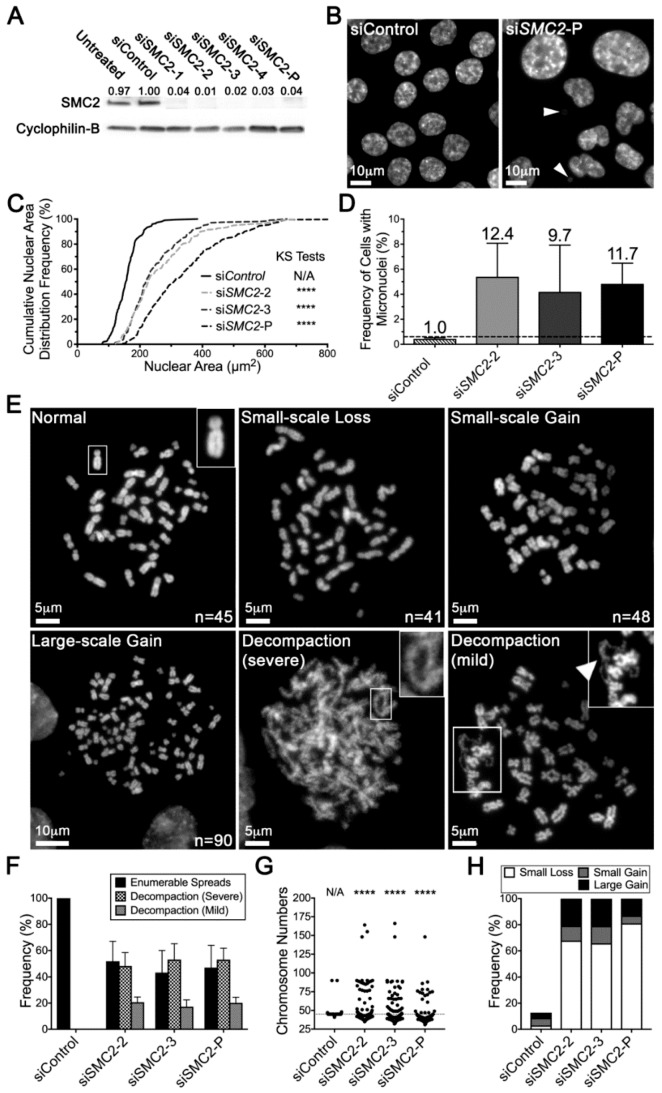
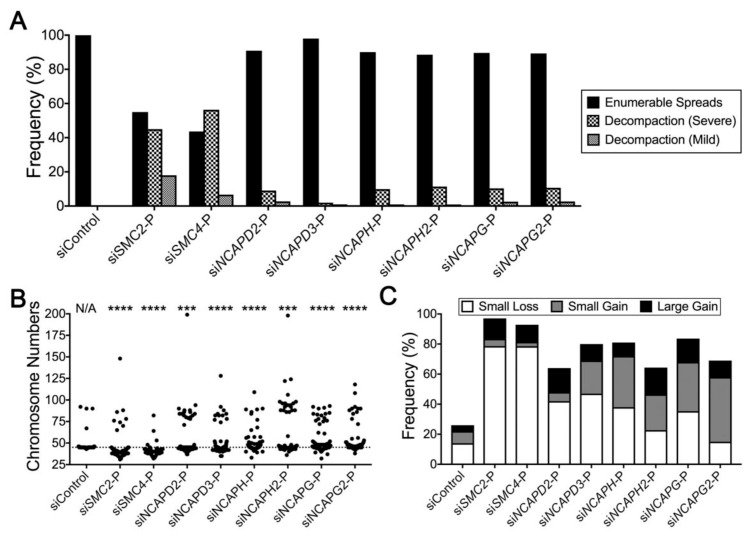
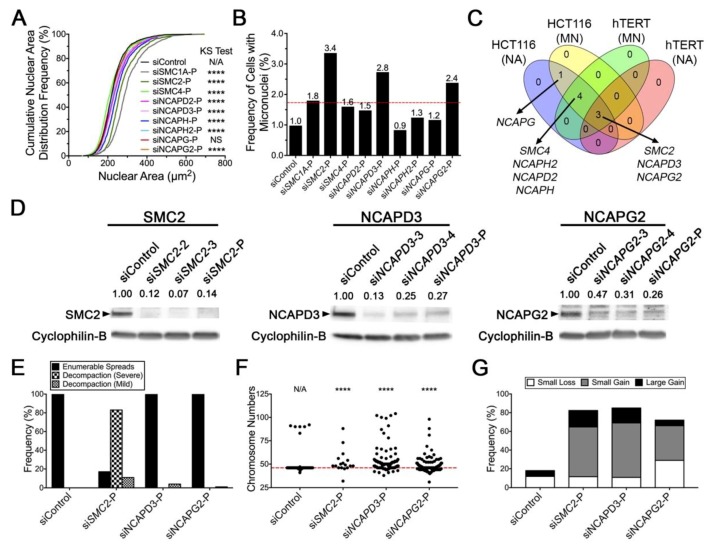
Chromosome instability (CIN), or constantly evolving chromosome complements, is a form of genome instability implicated in the development and progression of many cancer types, however, the molecular determinants of CIN remain poorly understood. Condensin is a protein complex involved in chromosome compaction, and recent studies in model organisms show that aberrant compaction adversely impacts mitotic fidelity. To systematically assess the clinical and fundamental impacts that reduced condensin gene expression have in cancer, we first assessed gene copy number alterations of all eight condensin genes. Using patient derived datasets, we show that shallow/deep deletions occur frequently in 12 common cancer types. Furthermore, we show that reduced expression of each gene is associated with worse overall survival in colorectal cancer patients. To determine the overall impact that reduced condensin gene expression has on CIN, a comprehensive siRNA-based screen was performed in two karyotypically stable cell lines. Following gene silencing, quantitative imaging microscopy identified increases in CIN-associated phenotypes, including changes in nuclear areas, micronucleus formation, and chromosome numbers. Although silencing corresponded with increases in CIN phenotypes, the most pronounced phenotypes were observed following SMC2 and SMC4 silencing. Collectively, our clinical and fundamental findings suggest reduced condensin expression and function may be a significant, yet, underappreciated driver of colorectal cancer.

Keywords: chromosome instability; colorectal cancer; condensin; micronucleus; single cell quantitative imaging microscopy.


Conflict of interest statement

The authors declare no conflict of interest. The funders had no role in the design of the study; in the collection, analyses, or interpretation of data; in the writing of the manuscript, or in the decision to publish the results.

Figures

Figure 1
Figure 1
Condensin gene alterations correspond with reduced expression and worse patient survival in cancer. (A) Frequency of condensin gene copy number alterations in 12 common cancer types [23]; shallow deletions (aqua), deep deletions (blue), small-scale gains (pink) and large-scale amplifications (red). (B) The cumulative frequency of shallow and deep deletions for all condensin genes in breast (82.3%), colorectal (54.8%), lung (82.4%), and ovarian (97.7%) cancers [23]. (C) Kaplan–Meier curves reveal that CRCs with reduced condensin gene expression (mRNA) typically correlate with worse overall survival relative to those with high expression [23]. Log-rank tests identify significantly worse outcomes for all genes, with the exception of NCAPD2 (p = 0.2195) and NCAPG2 (p = 0.0681), which do show similar trends.
Figure 2
Figure 2
Reduced condensin gene expression induces significant changes in NAs and MN formation in HCT116. (A) Representative micrographs depicting visual differences in NAs and MN formation (arrowhead) following condensin gene silencing using siRNA pools (-P) relative to siControl. Note the scale bars are identical. (B) Cumulative NA distribution frequencies following condensin gene silencing relative to siControl (black). Kolmogorov-Smirnov (KS) tests reveal statistically significant increases in NA distributions (rightward shift) following silencing relative to siControl (N/A, not applicable; ****, p < 0.0001). (C) Column graph presenting the mean frequency of cells with micronuclei following silencing, with the mean fold increase (relative to siControl) indicated above each column. The red dashed line identifies the minimum threshold (mean + 2 standard deviations of siControl) required to be considered a significant increase in MN formation.
Figure 3
Figure 3
SMC2 silencing induces CIN phenotypes in HCT116 cells. (A) Western blot showing SMC2 levels following silencing with either individual (siSMC2-1, -2, -3, or -4) or pooled (siSMC2-P) siRNA duplexes; Cyclophilin B is the loading control. Semi-quantitative image analysis was performed where SMC2 levels were first normalized to the respective loading control and are presented relative to siControl (1.00). See Figure S1 for detailed information. (B) Representative images depicting visual increases in NA heterogeneity and MN formation (arrowheads) following SMC2 silencing relative to siControl. (C) Cumulative NA distribution graph for SMC2 silenced conditions relative to siControl. KS tests reveal statistically significant increases in cumulative NA distribution frequencies following SMC2 silencing (siSMC2-2, -3, and -P) relative to siControl (N/A, not applicable; ****, p < 0.0001). (D) Column graph presenting the mean MN formation + standard deviation (SD) following SMC2 silencing; fold increase relative to siControl is presented above each column. The horizontal line indicates the minimum threshold (mean + 2 SD of siControl) required to be considered a significant increase in MN formation relative to siControl. (E) Representative images of various phenotypes observed in mitotic chromosome spreads including, normal (top left, inset presents a single magnified normal chromosome), small-scale chromosome losses (top middle), small-scale gains (top right) and large-scale gains (bottom left), along with severe (bottom middle, inset presents a magnified portion of a decondensed chromosome) and mild (bottom right) chromosome decompaction phenotypes. Chromosome numbers are presented in the bottom right corner of those spreads that could be accurately enumerated. (F) Bar graph showing the frequency of enumerable mitotic chromosome spreads (+ SD) versus those with severe or mild chromosome decompaction phenotypes. Note that a subset of the mild, but none of the severe decompaction phenotypes, could be accurately enumerated. (G) Dot plot presenting the individual chromosome numbers for each enumerable mitotic chromosome spread. Horizontal line identifies the modal chromosome number (45) for HCT116. KS-tests reveal statistically significant changes in the cumulative frequency distributions of chromosome numbers following SMC2 silencing relative to siControl (****, p < 0.0001). (H) Bar graph showing overall increases in the frequency of aberrant chromosome numbers following SMC2 silencing relative to siControl, which includes small-scale losses, small-scale gains, and large-scale gains.
Figure 4
Figure 4
Reduced condensin gene expression induces aberrant numerical and decompaction phenotypes in HCT116. (A) Bar graph presenting the frequency of enumerable and chromosome decompaction phenotypes (severe and mild) following gene silencing. (B) Dot plot depicting an overall increase in chromosome number heterogeneity following condensin gene silencing relative to siControl. The horizontal line identifies the modal chromosome number of HCT116. KS tests reveal statistically significant differences in the cumulative distribution frequencies of chromosome numbers relative to siControl (***, p < 0.001; ****, p < 0.0001). (C) Bar graph depicting overall increases in the frequency of aberrant chromosome numbers following condensin gene silencing.
Figure 5
Figure 5
Condensin gene silencing induces increases in CIN phenotypes in hTERT cells. (A) Cumulative NA distribution frequencies following condensin gene silencing in hTERT cells relative to siControl (black). KS tests reveal reduced expression induces statistically significant changes in NA distributions, with the exception of NCAPG (p = 0.07) (N/A, not applicable; N/S, not significant (p > 0.01); ****, p < 0.0001). (B) Column graph presenting the frequency of MN formation following silencing. The fold increase in mean MN formation relative to siControl is presented above each column, while the horizontal line identifies the minimum threshold to be considered a significant increase. (C) Venn diagram presenting the results of the NA and MN formation assays performed in both HCT116 and hTERT cells. Note that SMC2, NCAPD3, and NCAPG2 silencing induced significant phenotypes in all four assay/cellular contexts. (D) Representative Western blots showing SMC2 (left), NCAPD3 (middle) and NCAPG2 (right) levels following silencing in hTERT cells with both individual and pooled siRNAs; Cyclophilin B is the loading control. Semi-quantitative image analysis was performed, and residual protein levels are presented relative to siControl (1.00). See Figure S2 for detailed information. (E) Bar graph showing the frequency of enumerable mitotic spreads versus those with severe or mild chromosome decompaction phenotypes. Note that the majority of SMC2 silenced cells present with decompaction phenotypes, including ~83% and ~11% with severe and mild phenotypes, respectively. (F) Dot plot presenting the individual chromosome numbers for each enumerable mitotic chromosome spread, with the horizontal line identifying the modal chromosome number (46) of hTERT cells. Note that only 17% of spreads generated following SMC2 silencing could be enumerated due to the prevalent severe decompaction phenotype. KS tests reveal significant differences in the distribution of chromosome numbers relative to siControl (N/A, not applicable; ****, p < 0.0001). (G) Bar graph depicting increases in the overall frequency of aberrant chromosome numbers relative to siControl, which includes small-scale losses, small-scale gains and large-scale gains. Note that only 17/100 mitotic chromosome spreads could be enumerated following SMC2 silencing, 14 of which, exhibited numerical deviations from the modal number.

References

    1. American Cancer Society . Cancer Facts Figures 2019. American Cancer Society; Atlanta, GA, USA: 2019.
    1. Canadian Cancer Society’s Advisory Committee on Cancer Statistics . Canadian Cancer Statistics 2017. Canadian Cancer Society; Toronto, ON, Canada: 2017.
    1. Lengauer C., Kinzler K.W., Vogelstein B. Genetic instability in colorectal cancers. Nature. 1997;386:623–627. doi: 10.1038/386623a0. - DOI - PubMed
    1. Geigl J.B., Obenauf A.C., Schwarzbraun T., Speicher M.R. Defining ‘chromosomal instability’. Trends Genet. 2008;24:64–69. doi: 10.1016/j.tig.2007.11.006. - DOI - PubMed
    1. Lepage C.C., Morden C.R., Palmer M.C.L., Nachtigal M.W., McManus K.J. Detecting Chromosome Instability in Cancer: Approaches to Resolve Cell-to-Cell Heterogeneity. Cancers (Basel) 2019;11:226. doi: 10.3390/cancers11020226. - DOI - PMC - PubMed

LinkOut - more resources