

Mouse embryonic palatal mesenchymal cells maintain stemness through the PTEN-Akt-mTOR autophagic pathway
- PMID: 31358051
- PMCID: PMC6664599
- DOI: 10.1186/s13287-019-1340-8
Mouse embryonic palatal mesenchymal cells maintain stemness through the PTEN-Akt-mTOR autophagic pathway
Abstract
Background: Both genetic and environmental factors are implicated in the pathogenesis of cleft palate. However, the molecular and cellular mechanisms that regulate the development of palatal shelves, which are composed of mesenchymal cells, have not yet been fully elucidated. This study aimed to determine the stemness and multilineage differentiation potential of mouse embryonic palatal mesenchyme (MEPM) cells in palatal shelves and to explore the underlying regulatory mechanism associated with cleft palate formation.
Methods: Palatal shelves excised from mice models were cultured in vitro to ascertain whether MEPM are stem cells through immunofluorescence and flow cytometry. The osteogenic, adipogenic, and chondrogenic differentiation potential of MEPM cells were also determined to characterize MEPM stemness. In addition, the role of the PTEN-Akt-mTOR autophagic pathway was investigated using quantitative RT-PCR, Western blotting, and transmission electron microscopy.
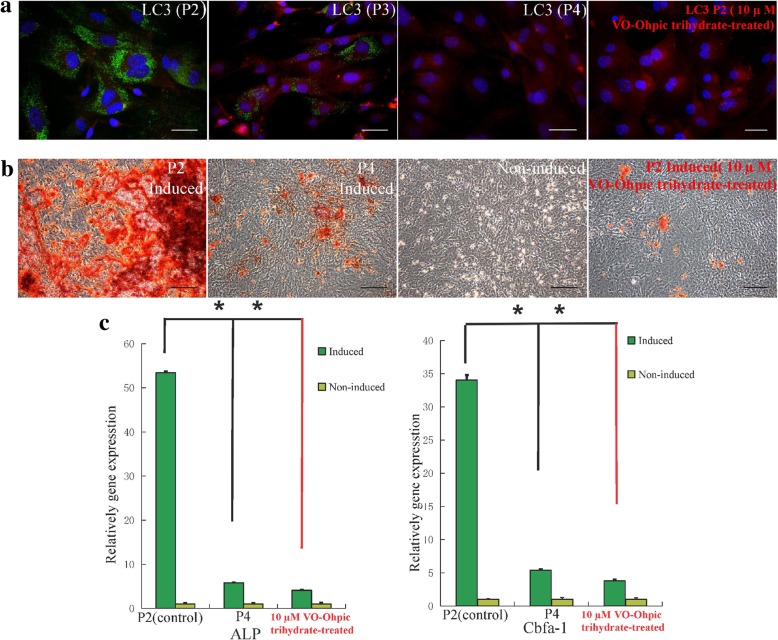
Results: MEPM cells in culture exhibited cell surface marker expression profiles similar to that of mouse bone marrow stem cells and exhibited positive staining for vimentin (mesodermal marker), nestin (ectodermal marker), PDGFRα, Efnb1, Osr2, and Meox2 (MEPM cells markers). In addition, exposure to PDGFA stimulated chemotaxis of MEPM cells. MEPM cells exhibited stronger potential for osteogenic differentiation as compared to that for adipogenic and chondrogenic differentiation. Undifferentiated MEPM cells displayed a high concentration of autophagosomes, which disappeared after differentiation (at passage four), indicating the involvement of PTEN-Akt-mTOR signaling.
Conclusions: Our findings suggest that MEPM cells are ectomesenchymal stem cells with a strong osteogenic differentiation potential and that maintenance of their stemness via PTEN/AKT/mTOR autophagic signaling prevents cleft palate development.
Keywords: Autophagy; Mouse embryonic palatal mesenchyme cells; PTEN-Akt-mTOR signaling pathway; Stemness.
Conflict of interest statement
The authors declare that they have no competing interests.
Figures


Similar articles
-
Osteogenic microenvironment affects palatal development through glycolysis.Differentiation. 2023 Sep-Oct;133:1-11. doi: 10.1016/j.diff.2023.05.002. Epub 2023 May 25. Differentiation. 2023. PMID: 37267667
-
Inhibition of Notch Signaling Promotes the Adipogenic Differentiation of Mesenchymal Stem Cells Through Autophagy Activation and PTEN-PI3K/AKT/mTOR Pathway.Cell Physiol Biochem. 2015;36(5):1991-2002. doi: 10.1159/000430167. Epub 2015 Jul 17. Cell Physiol Biochem. 2015. PMID: 26202359
-
AKT/mTOR-mediated autophagic signaling is associated with TCDD-induced cleft palate.Reprod Toxicol. 2024 Dec;130:108731. doi: 10.1016/j.reprotox.2024.108731. Epub 2024 Oct 12. Reprod Toxicol. 2024. PMID: 39401686
-
Energy metabolism in adult neural stem cell fate.Prog Neurobiol. 2011 Feb;93(2):182-203. doi: 10.1016/j.pneurobio.2010.10.007. Epub 2010 Nov 5. Prog Neurobiol. 2011. PMID: 21056618 Review.
-
The Role of Autophagy in the Maintenance of Stemness and Differentiation of Mesenchymal Stem Cells.Stem Cell Rev Rep. 2016 Dec;12(6):621-633. doi: 10.1007/s12015-016-9690-4. Stem Cell Rev Rep. 2016. PMID: 27696271 Review.
Cited by
-
ERK inhibition in glioblastoma is associated with autophagy activation and tumorigenesis suppression.J Neurooncol. 2022 Jan;156(1):123-137. doi: 10.1007/s11060-021-03896-3. Epub 2021 Nov 19. J Neurooncol. 2022. PMID: 34797524
-
Chloroquine regulates the proliferation and apoptosis of palate development on mice embryo by activating P53 through blocking autophagy in vitro.In Vitro Cell Dev Biol Anim. 2022 Aug;58(7):558-570. doi: 10.1007/s11626-022-00704-8. Epub 2022 Aug 10. In Vitro Cell Dev Biol Anim. 2022. PMID: 35947289
-
The mechanisms governing mouse embryonic palate mesenchymal cells' proliferation associated with atRA-induced cleft palate in mice: insights from integrated transcriptomic and metabolomic analyses.Arch Toxicol. 2023 Aug;97(8):2143-2153. doi: 10.1007/s00204-023-03534-z. Epub 2023 Jun 6. Arch Toxicol. 2023. PMID: 37278767
-
Erythropoietin Activates Autophagy to Regulate Apoptosis and Angiogenesis of Periodontal Ligament Stem Cells via the Akt/ERK1/2/BAD Signaling Pathway under Inflammatory Microenvironment.Stem Cells Int. 2022 Sep 20;2022:9806887. doi: 10.1155/2022/9806887. eCollection 2022. Stem Cells Int. 2022. PMID: 36199627 Free PMC article.
-
Inactivation of PI3K/Akt promotes the odontoblastic differentiation and suppresses the stemness with autophagic flux in dental pulp cells.J Dent Sci. 2022 Jan;17(1):145-154. doi: 10.1016/j.jds.2021.05.013. Epub 2021 Jun 16. J Dent Sci. 2022. PMID: 35028032 Free PMC article.
References
Publication types
MeSH terms
Substances
LinkOut - more resources
Full Text Sources
Research Materials
Miscellaneous
