. 2019 Aug 13;116(33):16210-16215.
doi: 10.1073/pnas.1906601116. Epub 2019 Jul 29.

Energy conversion via metal nanolayers

Affiliations

Energy conversion via metal nanolayers

Mavis D Boamah et al. Proc Natl Acad Sci U S A. .

Abstract

Current approaches for electric power generation from nanoscale conducting or semiconducting layers in contact with moving aqueous droplets are promising as they show efficiencies of around 30%, yet even the most successful ones pose challenges regarding fabrication and scaling. Here, we report stable, all-inorganic single-element structures synthesized in a single step that generate electrical current when alternating salinity gradients flow along its surface in a liquid flow cell. Nanolayers of iron, vanadium, or nickel, 10 to 30 nm thin, produce open-circuit potentials of several tens of millivolt and current densities of several microA cm-2 at aqueous flow velocities of just a few cm s-1 The principle of operation is strongly sensitive to charge-carrier motion in the thermal oxide nanooverlayer that forms spontaneously in air and then self-terminates. Indeed, experiments suggest a role for intraoxide electron transfer for Fe, V, and Ni nanolayers, as their thermal oxides contain several metal-oxidation states, whereas controls using Al or Cr nanolayers, which self-terminate with oxides that are redox inactive under the experimental conditions, exhibit dramatically diminished performance. The nanolayers are shown to generate electrical current in various modes of application with moving liquids, including sliding liquid droplets, salinity gradients in a flowing liquid, and in the oscillatory motion of a liquid without a salinity gradient.

Keywords: electron transfer; energy conversion; inorganic nanomaterials; solid–liquid interface; sustainability.


Conflict of interest statement

The authors declare no conflict of interest.

Figures

Fig. 1.
Fig. 1.
Metal nanolayers for gravitational to electrical energy conversion. (A) Photographs of iron and aluminum nanolayers with indicated thicknesses on microscope glass slides over the Northwestern University seal. (B) Photograph of Teflon cell with flow channel. Dashed lines indicate substrate position and arrows indicate aqueous flow direction.
Fig. 2.
Fig. 2.
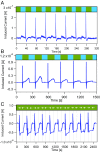
Current and voltage measurements. (A) Current induced in a 10-nm Fe:FeOx nanolayer (3 × 1 in.2) when flowing deionized (DI) water at pH 5.8 for 20 s (blue segment), followed by 20-s flow of 1 M NaCl held at pH 7 (green segment), and 6 subsequent replicates, all at a constant flow rate of 20 mL min−1. (B) Same as in A, but measured using a 3 × 9-in.2 Fe:FeOx nanolayer of 10-nm thickness at a flow rate of 100 mL min−1 and 2 min between switching salt concentration. (C) Same as in B, but measured at a flow rate of 35 mL min−1 and constant 0.6 M salt concentration while reversing the flow direction every 2 min, marked by the vertical dashed lines.
Fig. 3.
Fig. 3.
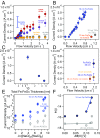
Mechanistic investigations. (A) Average current densities measured as a function of aqueous flow velocity using 10-nm-thin nanolayers of Fe:FeOx (blue-filled circles), Ni:NiOx (purple-filled circles), V:VOx (red-filled circles), Al:AlOx (gray-filled circles), and Cr:CrOx (orange-filled circles) while alternating DI water (pH = 5.8) and 0.6 M NaCl solution (pH ∼ 7) segments every 20 s, and current density obtained for 30 μL drops falling with a 0.1–0.2-cm2 contact area onto a 10-nm-thick Fe:FeOx nanolayer deposited onto a 1 × 3-in.2 glass substrate while alternating the drop salinity between DI water and 0.6 M at a drop rate of 2 mL min−1 and an incident angle of ∼160° (vertical blue bar). Error bars on point estimates shown are for 1 SD (σ) from n = 7 and 8 replicate measurements per flow rate. (B) Same as A, but for a 10-nm Fe:FeOx nanolayer (blue-filled circle) as a function of aqueous flow velocity and for a 10-nm-thin nanolayer of pure FeOx (orange-filled circle, no metal present) and a 10-nm-thin nanolayer of pure TiOx (gray-filled circle). (C) Current density recorded for Fe:FeOx nanolayers varying in total thickness obtained with a flow velocity of 0.74 cm s−1 while alternating DI water and 0.6 M NaCl solution segments every 20 s (D) Current density obtained for a 30-nm Fe:FeOx nanolayer without (deep-blue-filled circle) and with a 5-nm Cr:CrOx nanolayer on top of it (yellow-stroked deep-blue-filled circle) obtained with a flow velocity of 1.15 cm s−1, and for a 30-nm nanolayer of pure FeOx (no metal present) obtained with a flow velocity of 1 cm s−1, all while alternating DI water and 0.6 M NaCl solution segments every 20 s. (E) Current density for Fe:FeOx (filled and empty blue circles for 10 and 5 nm thickness, respectively) and Al:AlOx (empty gray circles, 20 nm thickness) nanolayers as a function of natural logarithm of the salt concentration difference in solutions of alternating salinity recorded using 30 μL drops at a drop rate of 2 mL min−1 (flow velocity = 0.3 cm s−1, assuming a 0.1-cm2 contact area of the rolling drop). Error bars on point estimates shown are for 1 SD (σ) from n = O (100) replicate measurements. (F) Natural logarithm of the current density (in A cm−2) as a function of change in Gouy–Chapman surface potential (σ = 0.007 C m−2) resulting from changing the ionic strength when altering the salt concentration.
Fig. 4.
Fig. 4.
Cartoon representation of electrical energy conversion in metal nanolayers terminated by their thermal oxides.
Fig. 5.
Fig. 5.
Model of charge mobility in nanoconfined, insulator-terminated metal conductor. (A) APT reconstruction of the heterostructured Fe:FeOx nanolayer (Center). Iron oxide and iron metal shown separately on Top (red) and Bottom (blue), respectively. (B) All-atom representation of the heterostructured nanolayer, including the metal conductor (gray) and a nonpolarizable oxide overlayer and with columnar subsurface heterostructure (pink); a single-probe Na+ cation is shown at a distance of 1.6 Å from the nanolayer. (C) Induced charge distribution, Q (x), by the Na+ cation at 4 different lateral positions relative to the position of the nonpolarizable heterostructure. (D) Ion–nanolayer Coulomb interaction as a function of function of lateral ion position, for various widths, d, of the nonpolarizable heterostructure; ΔEcoul is the difference in the ion–nanolayer Coulomb interaction for the nanolayer systems with and without the subsurface heterostructure. (E) MD simulation snapshot for alternating regions of ionized (0.43 M NaCl) water/DI water in contact with the nanolayer with columnar heterostructure (d = 1.3 nm). The nanolayer is shown as in B, but with the instantaneous charge polarization of metal conductor atoms also indicated (range = [−0.005 e (blue), +0.005 e (red)]). Vertical dotted lines indicate semipermeable boundaries for the ions to preserve the salinity boundaries. (F) For the simulation cell shown in E, the time-averaged induced charge distribution, Q (x) (black), as well as the 0.5-ns block averages of the same quantity. (G) Comparison of the time-averaged induced charge distribution for the system with (black) and without (red) nonpolarizable heterostructure.

References

    1. Ghosh S., Sood A. K., Kumar N., Carbon nanotube flow sensors. Science 299, 1042–1044 (2003). - PubMed
    1. Zhang Z., et al. , Emerging hydrovoltaic technology. Nat. Nanotechnol. 13, 1109–1119 (2018). - PubMed
    1. Yin J., et al. , Generating electricity by moving a droplet of ionic liquid along graphene. Nat. Nanotechnol. 9, 378–383 (2014). - PubMed
    1. Yang S., et al. , Mechanism of electric power generation from ionic droplet motion on polymer supported graphene. J. Am. Chem. Soc. 140, 13746–13752 (2018). - PubMed
    1. Tang Q., Yang P., The era of water-enabled electricity generation from graphene. J. Mater. Chem. A Mater. Energy Sustain. 4, 9730–9738 (2016).

Publication types

LinkOut - more resources