. 2019 Sep 1;203(5):1298-1312.
doi: 10.4049/jimmunol.1900104. Epub 2019 Jul 29.

Immune Response Resetting in Ongoing Sepsis

Affiliations

Immune Response Resetting in Ongoing Sepsis

Alexandre E Nowill et al. J Immunol. .

Abstract

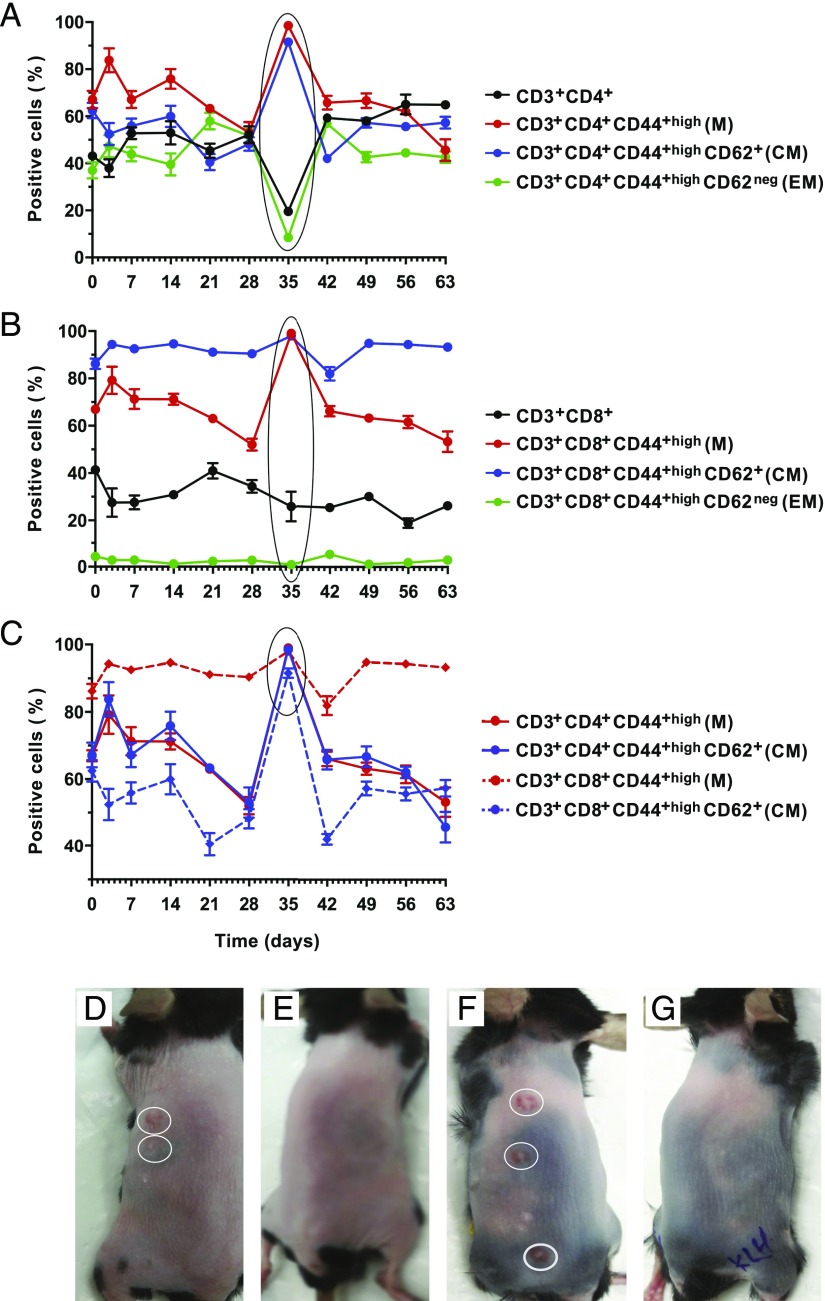
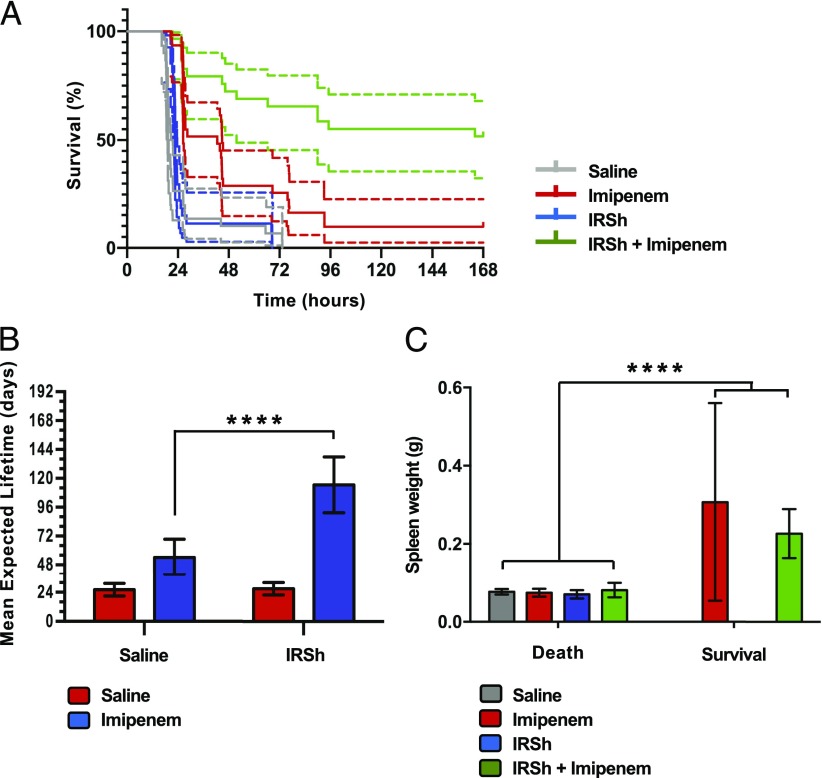
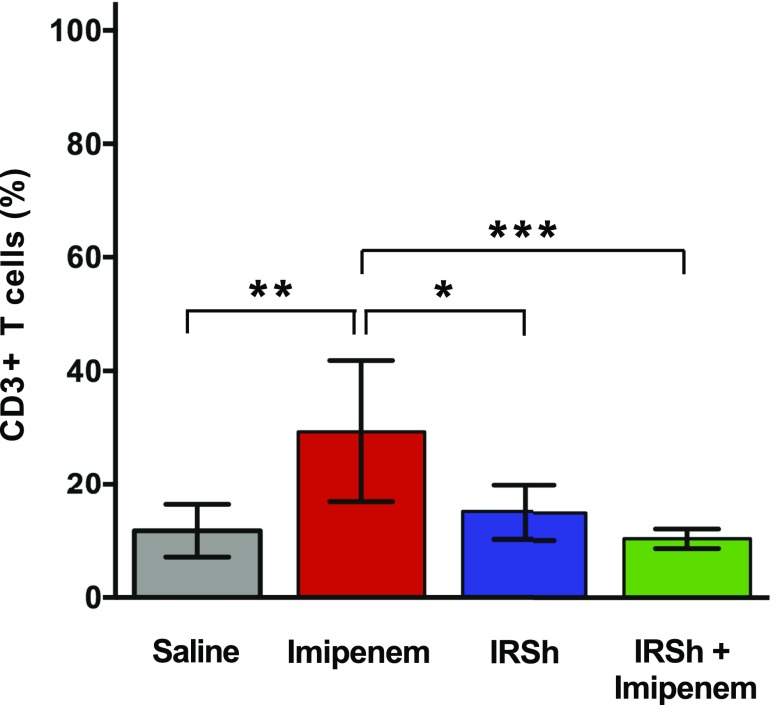
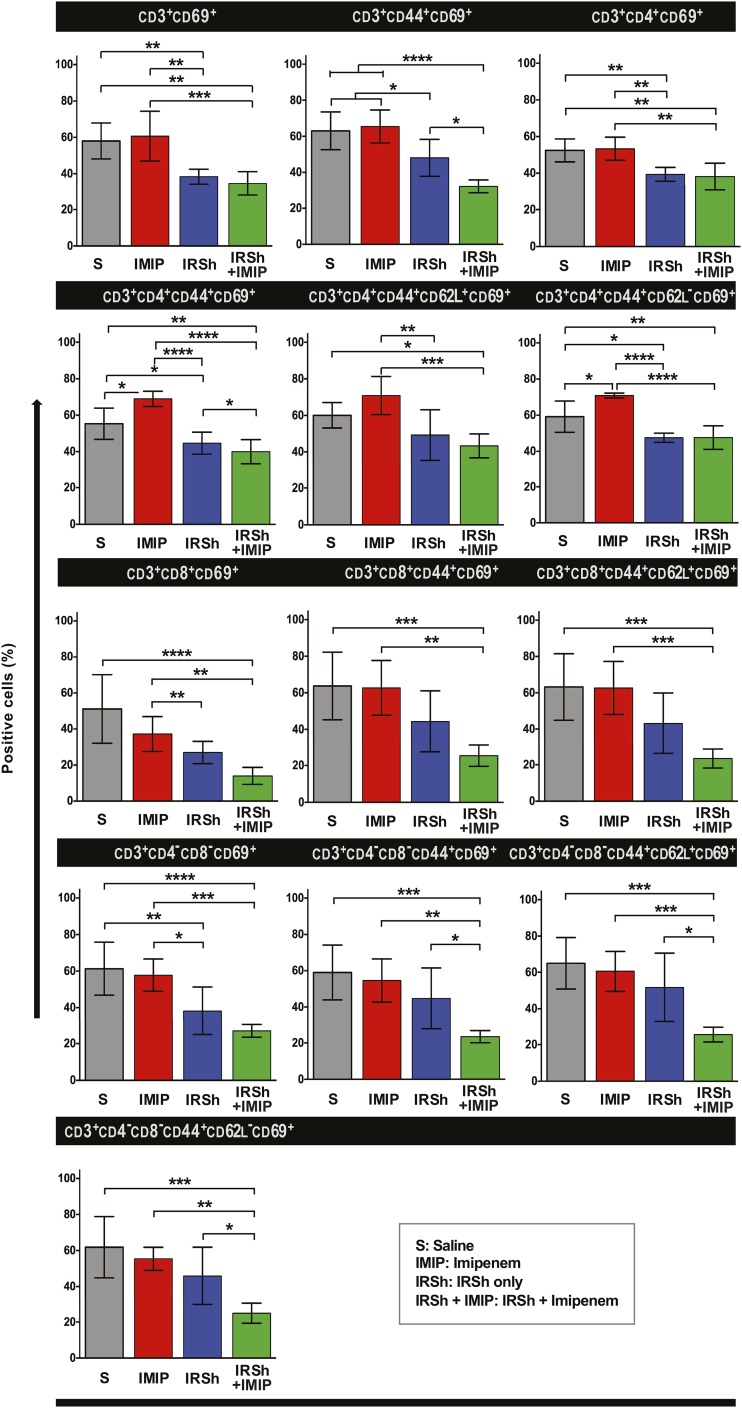
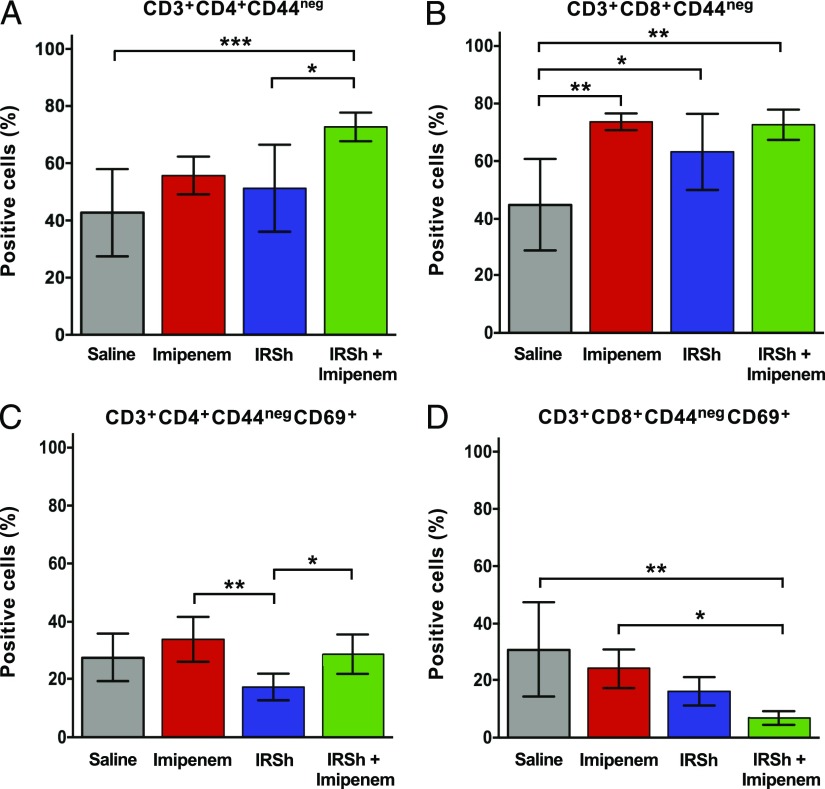
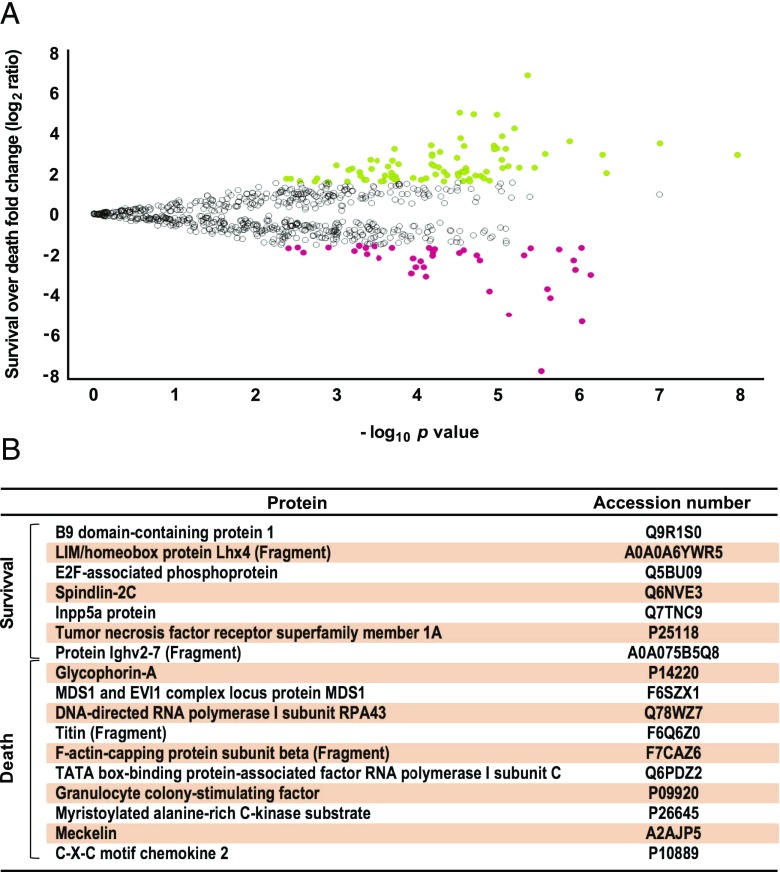
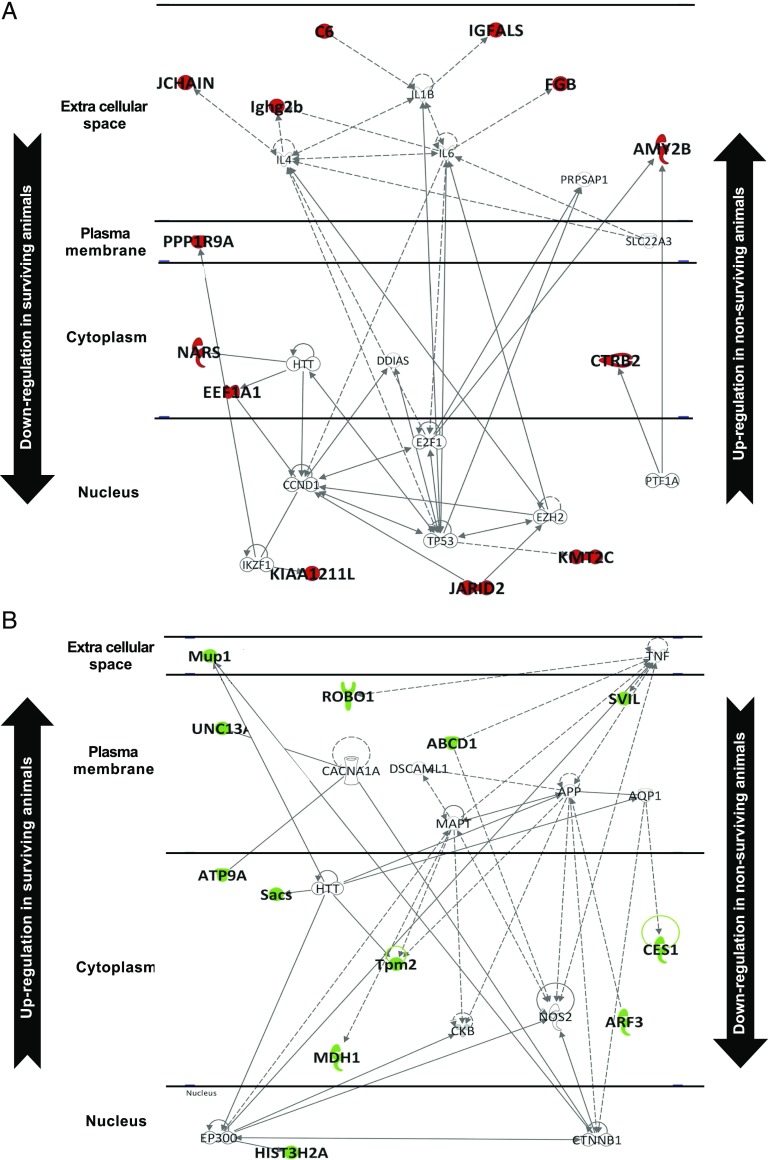
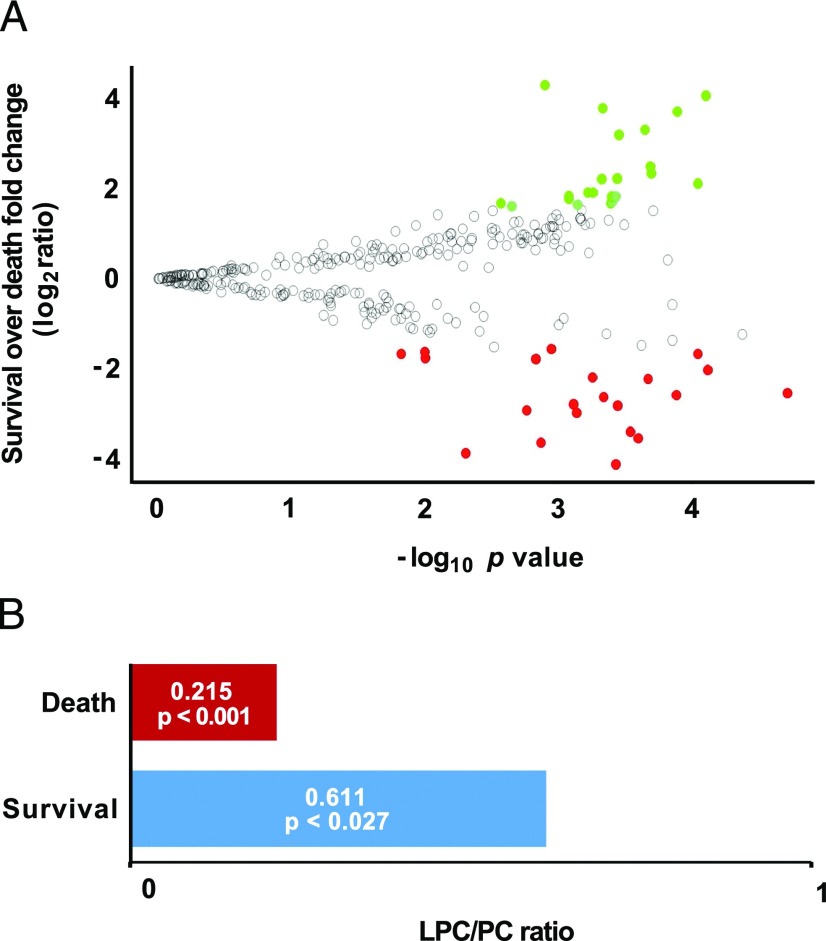
Cure of severe infections, sepsis, and septic shock with antimicrobial drugs is a challenge because morbidity and mortality in these conditions are essentially caused by improper immune response. We have tested the hypothesis that repeated reactivation of established memory to pathogens may reset unfavorable immune responses. We have chosen for this purpose a highly stringent mouse model of polymicrobial sepsis by cecum ligation and puncture. Five weeks after priming with a diverse Ag pool, high-grade sepsis was induced in C57BL/6j mice that was lethal in 24 h if left untreated. Antimicrobial drug (imipenem) alone rescued 9.7% of the animals from death, but >5-fold higher cure rate could be achieved by combining imipenem and two rechallenges with the Ag pool (p < 0.0001). Antigenic stimulation fine-tuned the immune response in sepsis by contracting the total CD3+ T cell compartment in the spleen and disengaging the hyperactivation state in the memory T subsets, most notably CD8+ T cells, while preserving the recovery of naive subsets. Quantitative proteomics/lipidomics analyses revealed that the combined treatment reverted the molecular signature of sepsis for cytokine storm, and deregulated inflammatory reaction and proapoptotic environment, as well as the lysophosphatidylcholine/phosphatidylcholine ratio. Our results showed the feasibility of resetting uncontrolled hyperinflammatory reactions into ordered hypoinflammatory responses by memory reactivation, thereby reducing morbidity and mortality in antibiotic-treated sepsis. This beneficial effect was not dependent on the generation of a pathogen-driven immune response itself but rather on the reactivation of memory to a diverse Ag pool that modulates the ongoing response.


Figures

None
Graphical abstract
FIGURE 1.
FIGURE 1.
(A) Memory induction. Memory phenotype in total CD3+ T cells and their subsets. Comparison of the CD3+ T cell phenotype relative representation over 63 d after the last boost of the immunization protocol is presented. Day 0 on the graph corresponds to the mean of three mice tested before immunization. Thereafter, three additional animals were sacrificed, and their spleens were analyzed individually for the relevant T cell phenotype on days 3, 7, 14, 21, 28, 35, 42, 49, 56, and 63. The p values were calculated by two-way ANOVA. Holm–Sidak multiple comparison test was used for comparison between days 0 and 35 (CD4+ T cells: p < 0.0001; M-CD4+ T cells: p < 0.0001; CM-CD4+ T cells: p < 0.0001; and EM-CD4+ T cells: p < 0.0001). (B) Memory phenotype in total CD8+ T cells and their subsets. Comparison of the CD8+ T cell phenotype relative representation over 63 d after the last boost of the immunization protocol is presented. Three mice per point were sacrificed for analysis following the same schedule described in (A). Day 0 on the graph corresponds to the mice tested before immunization. The p values were calculated by two-way ANOVA. Holm–Sidak multiple comparison test was used for comparison between days 0 and 35 (CD8+ T cells: p = 0.0019; M-CD8+ T cells: p < 0.0001; CM-CD8+ T cells: p = 0.0174; and EM-CD8+ T cells: p = 0.8276). (C) Comparison of memory and central memory phenotypes in CD4+ versus CD8+ T cells. Day 0 on the graph corresponds to the mice tested before immunization. Three mice per point were sacrificed for analysis following the same schedule described in (A). The p values were calculated by two-way ANOVA. Holm–Sidak multiple comparison test was used for comparison between days 0 and 35 (M-CD4+ T cells: p < 0.0001; CM-CD4+ T cells: p < 0.0001; M-CD8+ T cells: p < 0.0001; and CM-CD8+ T cells: p = 0.0045). (D and F) Prick test for IRSh applied hemilaterally. (E and G) Prick test for KLH control Ag applied hemilaterally. Each point in panels (A)–(C) represents the mean ± SE of independent analyses of the spleens of three mice. CM, central memory; EM, effector memory; M, memory.
FIGURE 2.
FIGURE 2.
IRSh impact on survival and immune response to sepsis. (A) Survival curve. The survival of animals in the four experimental groups after cecum ligation/perforation was plotted in a Kaplan–Meier curve. The log-rank (Mantel–Cox test) revealed a p value < 0.0001 (n = 113). Dotted lines indicate the 95% confidence interval for each curve. (B) Mean expected lifetime. Statistical significance was calculated by two-way ANOVA followed by Tukey multiple comparisons test for IRSh and saline groups. The means with 95% confidence interval are indicated. ****p < 0.0001. (C) Spleen weight and immune response in murine sepsis. Two-way ANOVA followed by Holm–Sidak test were used to show correlation between spleen weight and survival (p < 0.0001). Saline (control): 30 dead animals; imipenem: 28 dead and 3 survivors; IRSh: 27 dead; and IRSh plus imipenem: 13 dead and 15 survivors. The means with 95% confidence interval are indicated. ****p < 0.0001.
FIGURE 3.
FIGURE 3.
CD3+ T cell population expansion in sepsis. Statistical analysis was performed by ordinary one-way ANOVA followed by Tukey multiple comparisons test. The means with 95% confidence interval are indicated. *p < 0.05, **p < 0.01, ***p < 0.001.
FIGURE 4.
FIGURE 4.
Flow cytometric evaluation of T cell subsets in four experimental groups. Statistical analysis was performed by ordinary one-way ANOVA followed by Tukey multiple comparisons test. The means with 95% confidence interval are indicated. *p < 0.05, **p < 0.01, ***p < 0.001, ****p < 0.0001.
FIGURE 5.
FIGURE 5.
Naive recovery and activation status of CD4+ and CD8+ T cell populations. (A) Naive CD4+ T cell recovery. (B) Naive CD8+ T cell recovery. (C) Naive CD4+ T cell activation. (D) Naive CD8+ T cell activation. Statistical analysis was performed by ordinary one-way ANOVA followed by Tukey multiple comparisons test. The means with 95% confidence interval are indicated. *p < 0.05, **p < 0.01, ***p < 0.001.
FIGURE 6.
FIGURE 6.
Differential protein expression profile ratio in survival and death outcomes. Protein expression profile ration between survival and nonsurvival conditions: a volcano plot was obtained after applying the filters (CV < 0.3; maximum fold change: log2 = ±1.6 and p < 0.05, n = 56 for survival and n = 7 for nonsurvival) to understand the level of significance and magnitude of changes observed in differentially expressed proteins between each of the two conditions (A). Differences with ANOVA. A p value < 0.05 and log2 ≥ ±1.6 were considered significant. In this comparison set, the most significantly up- and downregulated proteins are shown in green and red, respectively. The comparison between survival and nonsurvival samples identified 17 exclusive proteins for either condition: 7 proteins for survival and 10 for nonsurvivor groups (B).
FIGURE 7.
FIGURE 7.
Interactome of proteins differentially expressed in survival versus nonsurvival outcomes. The interactome from 40 proteins downregulated in survival and upregulated in nonsurvival is shown (A). The interactome from 81 proteins upregulated in survival and downregulated in nonsurvival is shown (B).
FIGURE 8.
FIGURE 8.
Differential lipid expression in survival and death outcomes. (A) The volcano plot shows the distribution of differentially expressed lipids in survival over death outcomes. Differences with ANOVA p value < 0.05 and log2 ≥ ±1.6 were considered significant. The most up- and downregulated lipids are shown in green and red, respectively. (B) LPC/PC ratios in survivors compared with nonsurvivors in sepsis. The ratios and the respective p values calculated by the Mann–Whitney U test are presented (n = 56 for survival and n = 7 for nonsurvival).

References

    1. Alexander F. 1929. On the antibacterial action of cultures of a penicillium, with special reference to their use in the isolation of b. influenzae. Br. J. Exp. Pathol. 10: 226–236. - PubMed
    1. Waksman S. A., Woodruff H. B. 1942. Selective antibiotic action of various substances of microbial origin. J. Bacteriol. 44: 373–384. - PMC - PubMed
    1. Thompson R. L., Wright A. J. 1998. General principles of antimicrobial therapy. Mayo Clin. Proc. 73: 995–1006. - PubMed
    1. Barlam T. F., Cosgrove S. E., Abbo L. M., MacDougall C., Schuetz A. N., Septimus E. J., Srinivasan A., Dellit T. H., Falck-Ytter Y. T., Fishman N. O., et al. 2016. Implementing an antibiotic stewardship program: guidelines by the infectious diseases society of America and the society for healthcare epidemiology of America. Clin. Infect. Dis. 62: e51–e77. - PMC - PubMed
    1. Society for Healthcare Epidemiology of America; Infectious Diseases Society of America; Pediatric Infectious Diseases Society . 2012. Policy statement on antimicrobial stewardship by the society for healthcare epidemiology of America (SHEA), the infectious diseases society of America (IDSA), and the pediatric infectious diseases society (PIDS). Infect. Control Hosp. Epidemiol. 33: 322–327. - PubMed

Publication types