. 2019 Jul 29;10(1):3390.
doi: 10.1038/s41467-019-11327-1.

Mitofusins regulate lipid metabolism to mediate the development of lung fibrosis

Affiliations

Mitofusins regulate lipid metabolism to mediate the development of lung fibrosis

Kuei-Pin Chung et al. Nat Commun. .

Abstract

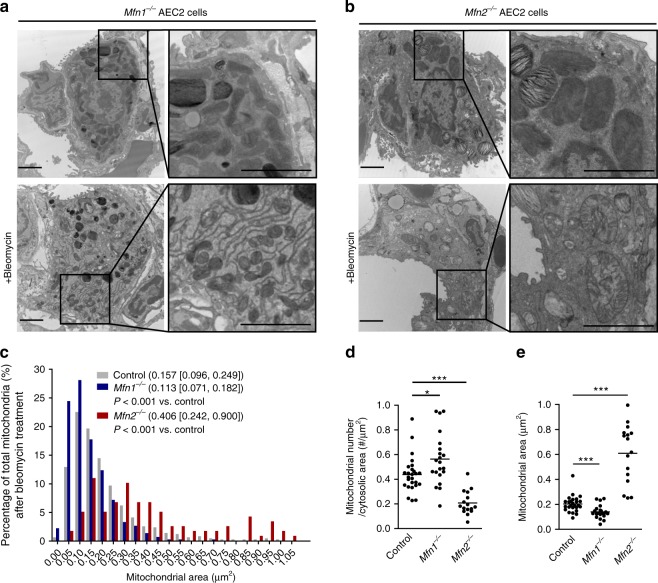
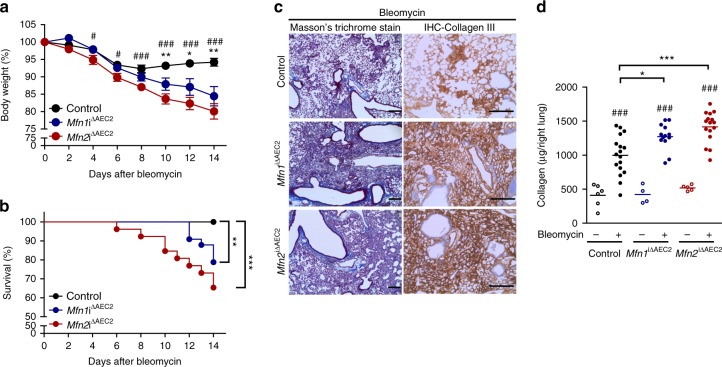
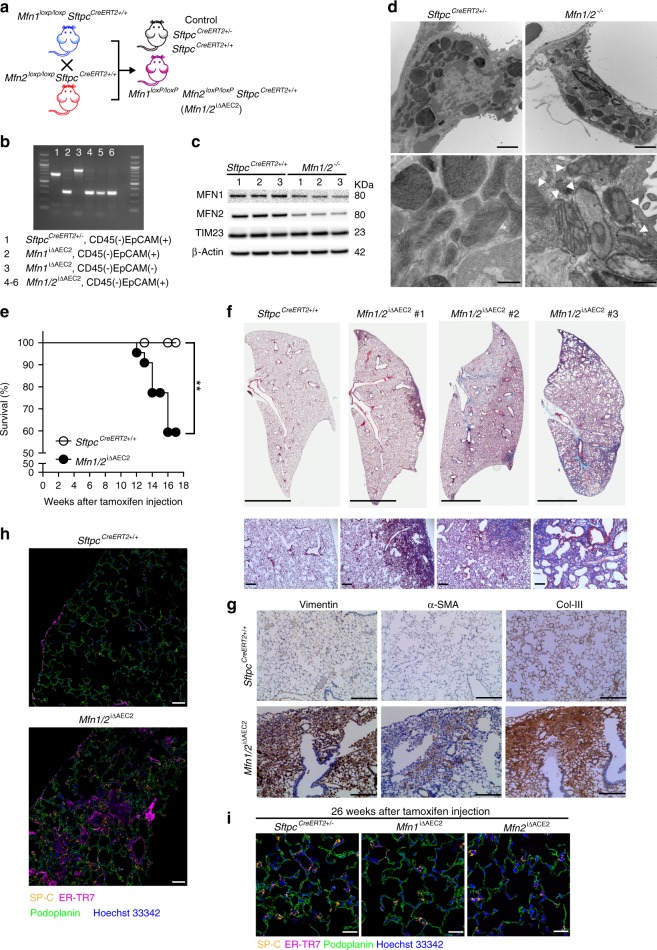
Accumulating evidence illustrates a fundamental role for mitochondria in lung alveolar type 2 epithelial cell (AEC2) dysfunction in the pathogenesis of idiopathic pulmonary fibrosis. However, the role of mitochondrial fusion in AEC2 function and lung fibrosis development remains unknown. Here we report that the absence of the mitochondrial fusion proteins mitofusin1 (MFN1) and mitofusin2 (MFN2) in murine AEC2 cells leads to morbidity and mortality associated with spontaneous lung fibrosis. We uncover a crucial role for MFN1 and MFN2 in the production of surfactant lipids with MFN1 and MFN2 regulating the synthesis of phospholipids and cholesterol in AEC2 cells. Loss of MFN1, MFN2 or inhibiting lipid synthesis via fatty acid synthase deficiency in AEC2 cells exacerbates bleomycin-induced lung fibrosis. We propose a tenet that mitochondrial fusion and lipid metabolism are tightly linked to regulate AEC2 cell injury and subsequent fibrotic remodeling in the lung.


Conflict of interest statement

The spouse of M.E.C. is a co-founder, shareholder and serves on the Scientific Advisory Board of Proterris, Inc. A.M.K.C. is a cofounder, stock holder and serves on the Scientific Advisory Board for Proterris, which develops therapeutic uses for carbon monoxide. A.M.K.C. also has a use patent on CO. He served on the TEVA Advisory Board meeting as a consultant on July 12–13, 2018. The remaining authors declare no competing interests.

Figures

Fig. 1
Fig. 1
Altered mitochondrial dynamics in murine AEC2 cells in bleomycin-induced lung fibrosis. a Schema demonstrating the generation of mice with tamoxifen-inducible tdTomato labeling in AEC2 cells; tdTomato reporter mice (Rosa26tdTomato+/+) were crossed with SftpcCreERT2+/+ mice. b A functional enrichment map generated using genes differently expressed between AEC2 cells with and those without bleomycin treatment, using the threshold of an adjusted p < 0.001 and a fold change >1.2. c Heatmap showing upregulated genes under the annotation mitochondrial organization (GO:0007005) in AEC2 cells treated with bleomycin (BLM), compared to those treated with PBS. d Expression of Mfn1, Mfn2 and Dnm1l mRNA in AEC2 cells 5 days after PBS (n = 4 mice) or BLM (n = 4 mice) treatment. For each gene, the fold change of FPKM is calculated relative to the PBS group. The data are presented as mean±s.e.m. (NS, not significant; ***adjusted p < 0.001 vs. PBS group). e A heatmap showing downregulated genes under the annotation mitochondrial organization (GO:0007005) in AEC2 cells treated with bleomycin, compared to those treated with PBS. f Representative TEM images (50,000X) showing mitochondrial damage in AEC2 cells from SftpcCreERT2+/− mice before and after bleomycin treatment (scale bar 500 nm). g-i Representative TEM images (12,000X; scale bar 2 μm) (g) and corresponding quantification of mitochondrial number per μm2 of cytosolic area (h) and mitochondrial area (μm2) (i) in each AEC2 cell before and after bleomycin treatment. Each dot represents one AEC2 cell and the line indicates mean (before bleomycin, n = 15 AEC2 cells from 3 mice; after bleomycin, n = 26 AEC2 cells from 2 mice; *p < 0.05, ***p < 0.001, vs. no bleomycin treatment by unpaired Student’s t test). Source data (c, d) are provided as a Source Data file
Fig. 2
Fig. 2
Mice with AEC2 cell-specific deletion of Mfn1 or Mfn2. a Schema demonstrating the generation of AEC2 cell-specific mice deficient in Mfn1 or Mfn2 using a tamoxifen-inducible Sftpc-promoter driven CreERT2. SftpcCreERT2+/− mice were used as controls. b Genotyping of DNA extracted from CD45(−)EpCAM(+) cells and CD45(-)EpCAM(−) cells isolated from control and Mfn1iΔAEC2 mice 6 weeks after tamoxifen injection (n = 3 mice per group). c Representative immunoblots of AEC2 cell lysates obtained 3 weeks after tamoxifen-induced deletion, showing decreased protein levels of MFN1 or MFN2 in the respective knockout cells (n = 3 mice per group). d Representative TEM images (upper row, ×12,000, scale bar 2 μm; lower row, ×50,000, scale bar 500 nm) show mitochondrial ultrastructural changes in Mfn1−/− and Mfn2−/− AEC2 cells (n = 3 mice per group) with disrupted cristae marked with white arrowheads. e, f Quantification of (d); mitochondrial number per μm2 of cytosolic area (e) and mitochondrial area (μm2) (f) in each AEC2 cell, using TEM images (×12,000). Each dot represents one AEC2 cell, and the line indicates mean (control AEC2 cells n = 15, Mfn1−/− AEC2 cells n = 14; Mfn2−/− AEC2 cells n = 14, from a total of 3 mice per group; *p < 0.05, **p < 0.01, ***p < 0.001, vs. control by unpaired Student’s t test). g Representative TEM images (×5000) of the bronchial epithelium in control (SftpcCreERT2+/−), Mfn1iΔAEC2 and Mfn2iΔAEC2 mice (n = 3 mice per group; scale bar 5 μm). h Representative Masson’s trichrome-stained sections (×100 magnification) of murine left lung at 28–32 weeks post tamoxifen-induced deletion (control mice, n = 20; Mfn1iΔAEC2 mice, n = 10; Mfn2iΔAEC2 mice, n = 9; scale bar 3 mm). Source data (c, e, f) are provided as a Source Data file
Fig. 3
Fig. 3
Mitofusin-deficient AEC2 cells susceptible to bleomycin-induced mitochondrial damage. a, b Representative TEM images (12,000X; scale bar 2 μm) in Mfn1−/− (a) or Mfn2−/− (b) AEC2 cells before (n = 3 mice) and after bleomycin treatment (n = 2 mice). ce Quantification of mitochondria area of each mitochondrion (control n = 521 mitochondria, Mfn1−/− n = 464 mitochondria, Mfn2−/− n = 119 mitochondria; data presented as the median [interquartile range], and the comparison performed by Mann–Whitney U test) (c), and mitochondrial number per μm2 of cytosolic area (d) and mitochondrial area (μm2) (e) in each AEC2 cell (d, e, each dot represents one AEC2 cell; *p < 0.05, ***p < 0.001, vs. control by unpaired Student’s t test), using TEM images (12,000X) of control, Mfn1−/− or Mfn2−/− AEC2 cells 8 days after bleomycin treatment (control AEC2 cells n = 26, Mfn1−/− AEC2 cells n = 21, Mfn2−/− AEC2 cells n = 16, from 2 mice per group). Source data (ce) are provided as a Source Data file
Fig. 4
Fig. 4
MFN1 or MFN2 deficiency in AEC2 cells promotes bleomycin-induced lung fibrosis. a Body weight changes of control (n = 18), Mfn1iΔAEC2 (n = 13) and Mfn2iΔAEC2 (n = 16) mice after bleomycin treatment. Data are mean±s.e.m. (results from 3 independent experiments; *Mfn1iΔAEC2 vs. control, #Mfn2iΔAEC2 vs. control; * and #, p < 0.05, ** and ##, p < 0.01, ###p < 0.001, by unpaired Student’s t test). b Kaplan–Meier survival curves of control (n = 32), Mfn1iΔAEC2 (n = 33) and Mfn2iΔAEC2 (n = 26) mice after bleomycin treatment (results from 3 independent experiments; **p < 0.01, ***p < 0.001, by log-rank test). c Masson’s trichrome staining (left panel, ×100 magnification, scale bar 200 μm) and IHC staining of collagen III (right panel, ×200 magnification, scale bar 200 μm) in lung sections of control, Mfn1iΔAEC2 and Mfn2iΔAEC2 mice14 days after bleomycin treatment (control mice n = 10, Mfn1iΔAEC2 mice n = 12, Mfn2iΔAEC2 mice n = 3). d Acid-soluble collagen levels in the right lung from control (PBS n = 6, bleomycin n = 17), Mfn1iΔAEC2 (PBS n = 4, bleomycin n = 13) and Mfn2iΔAEC2 (PBS n = 5, bleomycin n = 16) mice 14 days after PBS or bleomycin treatment, quantified by Sircol assay. The line indicates mean (#, bleomycin vs. PBS, * vs. control mice; *p < 0.05, *** and ###p < 0.001 by one-way ANOVA with post-hoc Bonferroni test). Source data (a, b, d) are provided as a Source Data file
Fig. 5
Fig. 5
Mfn1/2iΔAEC2 mice develop spontaneous lung fibrosis. a Schema demonstrating the generation of mice with AEC2 cell-specific tamoxifen-inducible deletion of Mfn1/2. SftpcCreERT2+/+ or SftpcCreERT2+/− mice were used as controls. b Genotyping of CD45(-)EpCAM(+) cells isolated from Mfn1/2iΔAEC2 mice (n = 3 mice; lane 1 to lane 3 serves as the positive control). c Representative immunoblots of AEC2 cell lysates obtained 6 weeks after tamoxifen-induced deletion, showing decreased protein levels of both MFN1 and MFN2 in the Mfn1/2−/− AEC2 cells (n = 3 mice per group). d Representative TEM images (upper row, ×12,000; lower row, ×50,000) show mitochondrial ultrastructural changes in SftpcCreERT2+/− and Mfn1/2−/− AEC2 cells (n = 3 mice per group) with disrupted cristae marked with white arrowheads (scale bar, upper row 2 μm, lower row 500 nm. e Kaplan–Meier survival curves of Mfn1/2iΔAEC2 (n = 22) and SftpcCreERT2+/+ (n = 23) mice (p < 0.01 by log-rank test). f Representative Masson’s trichrome-stained lung sections (upper panel, ×100 magnification; lower panel, ×200 magnification) 17 weeks post tamoxifen-induced deletion (SftpcCreERT2+/+ mice n = 6; Mfn1/2iΔAEC2 mice n = 11; scale bar, upper panel 4 mm, lower panel 200 μm). g Representative IHC staining of vimentin, alpha-smooth muscle actin (α-SMA), and collagen III (Col-III) (×200 magnification; n = 3 mice per group; scale bar 200 μm). h Representative immunofluorescent staining of 5x5 tiled confocal images (using ×40 objective) of frozen murine lung sections stained for podoplanin (green), surfactant protein-C (SP-C) (yellow), ER-TR7 (magenta), and Hoechst 33342 stain (blue) (n = 3 mice per group; scale bar 50 μm). i Representative immunofluorescence staining confocal images of podoplanin (green), SP-C (yellow), ER-TR7 (magenta) and Hoechst 33342 nuclear stain (blue) using lung sections of SftpcCreERT2+/−, Mfn1iΔAEC2 and Mfn2iΔAEC2 mice (n = 2 mice per group; scale bar 20 μm). Source data (c, e) are provided as a Source Data file
Fig. 6
Fig. 6
Purine metabolism is upregulated in Mfn1−/− and Mfn2−/− AEC2 cells after bleomycin treatment. a Scatterplot showing genes (orange) that are differentially expressed (adjusted p < 0.05) and have the same regulation direction in both Mfn1−/− and Mfn2−/− AEC2 cells after bleomycin treatment, compared to the control. b A functional enrichment map to show the common GO terms enriched on differentially expressed genes of Mfn1−/− and Mfn2−/− AEC2 cells after bleomycin treatment. c, d Heatmaps to show genes related to purine metabolism under the annotation purine ribonucleoside triphosphate metabolic process (GO: GO:0009205) (c) and genes related to lipid metabolism under the annotation fatty acid metabolic process (GO:0006631) (d), based on the functional enrichment results (b). e A functional enrichment map generated using genes differently expressed between Mfn1/2−/− AEC2 cells and control AEC2 cells, using the threshold of an adjusted p < 0.05. f Differentially regulated genes related to glycolysis, asparagine (Asn) synthesis, de novo serine/glycine synthesis, and mitochondrial one-carbon metabolism in SftpcCreERT2+/+ versus MFN1/2−/− AEC2 cells. For each gene, the fold change of FPKM is calculated relative to SftpcCreERT2+/+ control (G6P glucose-6-phosphate, G3P glyceraldehyde-3-phosphate, OAA oxaloacetate, Asp aspartate, Asn asparagine, 3P-OH-pyruvate 3-phosphohydropyruvate, P-ser 3-phosphoserine, Ser serine, Gly glycine, THF tetrahydrofolate, MTHF methyltetrahydrofolate, FTHF formyltetrahydropholate). The data are presented as mean±s.e.m. (NS not-significant; *adjusted p < 0.05, **adjusted p < 0.01, ***adjusted p < 0.001 vs. SftpcCreERT2+/+)
Fig. 7
Fig. 7
MFN1 and MFN2 regulates surfactant lipid synthesis in AEC2 cells. a, b Representative TEM images of lamellar bodies (LB) in control, Mfn1- and Mfn2-deficient AEC2 cells at baseline (×25,000; n = 3 mice per group) and 8 days after bleomycin treatment (×50,000; n = 2 mice per group) (scale bar 500 nm) (a) and in SftpcCreERT2+/− and Mfn1/2−/− AEC2 cells (×25,000; n = 3 mice per group; scale bar 1 μm) (b, left panel). Quantification of the percentage of LB with disorganized lipid membranes in AEC2 cells by TEM image analysis (×12,000) (b, right panel). Each dot represents one AEC2 cell (SftpcCreERT2+/− AEC2 cells n = 15 from 3 mice, Mfn1/2−/− AEC2 cells n = 17 from 2 mice; ***p < 0.001, vs. control by unpaired Student’s t test). c, d Heat map (c) and bar graph (d) of differential changes of specific lipid contents in control, Mfn1−/− and Mfn2−/− AEC2 cells (n = 4 biologically independent samples per group) 8 days after bleomycin treatment. The fold-changes of specific lipids in AEC2 cells after bleomycin treatment relative to those after PBS treatment (n = 3 biologically independent samples per group) were calculated and log-transformed (base 2) (d, *p < 0.05, **p < 0.01, calculated fold change vs. 1 by unpaired Student’s t test). e Lipidomic analysis in SftpcCreERT2+/+ and Mfn1/2−/− AEC2 cells (n = 4 mice per group; *p < 0.05, **p < 0.01, ***p < 0.001, vs. SftpcCreERT2+/+ AEC2 cells by unpaired Student’s t test). Data are presented as mean±s.e.m. (d, e). Source data (be) are provided as a Source Data file
Fig. 8
Fig. 8
Impaired fatty acid synthesis in AEC2 cells promotes bleomycin-induced lung fibrosis. a Schema outlining the generation of mice with tamoxifen-inducible Fasn knockout in AEC2 cells. b Immunoblots showing MFN1, MFN2, TIM23 and β-actin expression in AEC2 cells from control or FasniΔAEC2 mice (n = 3 mice per group). ce Kaplan–Meier survival curves (control n = 9, FasniΔAEC2 n = 9; *p < 0.05, by log-rank test) (c), body weight changes (control n = 27, FasniΔAEC2 n = 22) (d) and acid-soluble collagen depositions in right lung (control n = 7, FasniΔAEC2 n = 4) after bleomycin treatment (e) (d, e the line indicates mean; *p < 0.05, by unpaired Student’s t test). f Representative Masson’s Trichrome-stained lung sections (200X magnification; scale bar 200 μm) of mice 14 days after bleomycin treatment (n = 5 mice per group). Source data (be) are provided as a Source Data file

References

    1. Stone KC, Mercer RR, Gehr P, Stockstill B, Crapo JD. Allometric relationships of cell numbers and size in the mammalian lung. Am. J. Respir. Cell Mol. Biol. 1992;6:235–243. doi: 10.1165/ajrcmb/6.2.235. - DOI - PubMed
    1. Desai TJ, Brownfield DG, Krasnow MA. Alveolar progenitor and stem cells in lung development, renewal and cancer. Nature. 2014;507:190–194. doi: 10.1038/nature12930. - DOI - PMC - PubMed
    1. Barkauskas CE, et al. Type 2 alveolar cells are stem cells in adult lung. J. Clin. Invest. 2013;123:3025–3036. doi: 10.1172/JCI68782. - DOI - PMC - PubMed
    1. Bernhard W, et al. Increased palmitoyl-myristoyl-phosphatidylcholine in neonatal rat surfactant is lung specific and correlates with oral myristic acid supply. J. Appl. Physiol. 2011;111:449–457. doi: 10.1152/japplphysiol.00766.2010. - DOI - PubMed
    1. Whitsett JA, Wert SE, Weaver TE. Alveolar surfactant homeostasis and the pathogenesis of pulmonary disease. Annu Rev. Med. 2010;61:105–119. doi: 10.1146/annurev.med.60.041807.123500. - DOI - PMC - PubMed

Publication types

MeSH terms