. 2019 Jul 29;10(1):3391.
doi: 10.1038/s41467-019-11274-x.

ER-residential Nogo-B accelerates NAFLD-associated HCC mediated by metabolic reprogramming of oxLDL lipophagy

Affiliations

ER-residential Nogo-B accelerates NAFLD-associated HCC mediated by metabolic reprogramming of oxLDL lipophagy

Yuan Tian et al. Nat Commun. .

Abstract

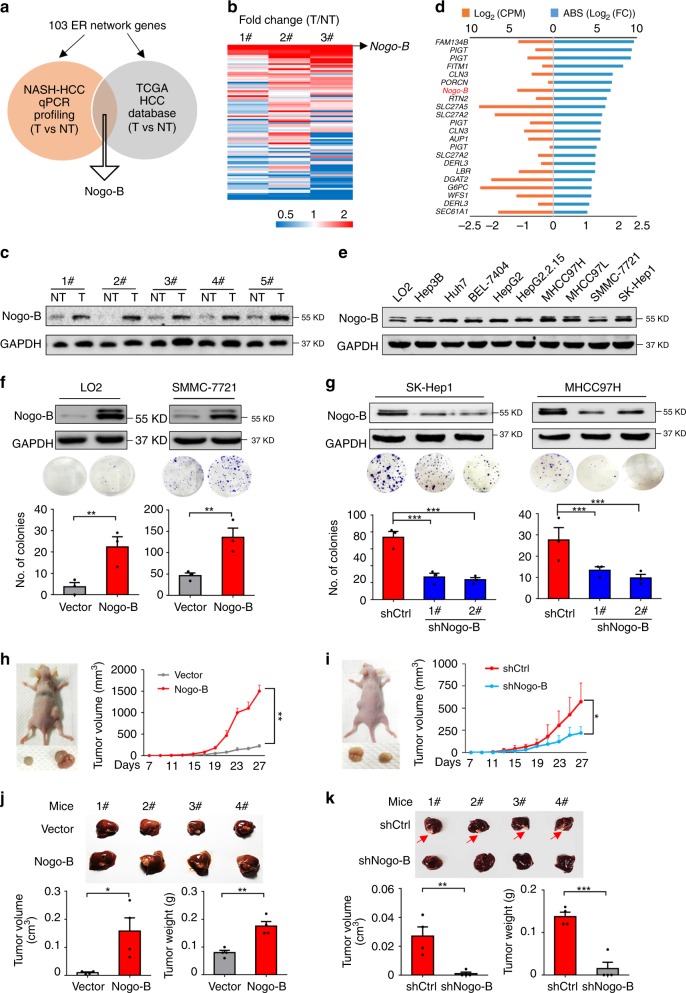
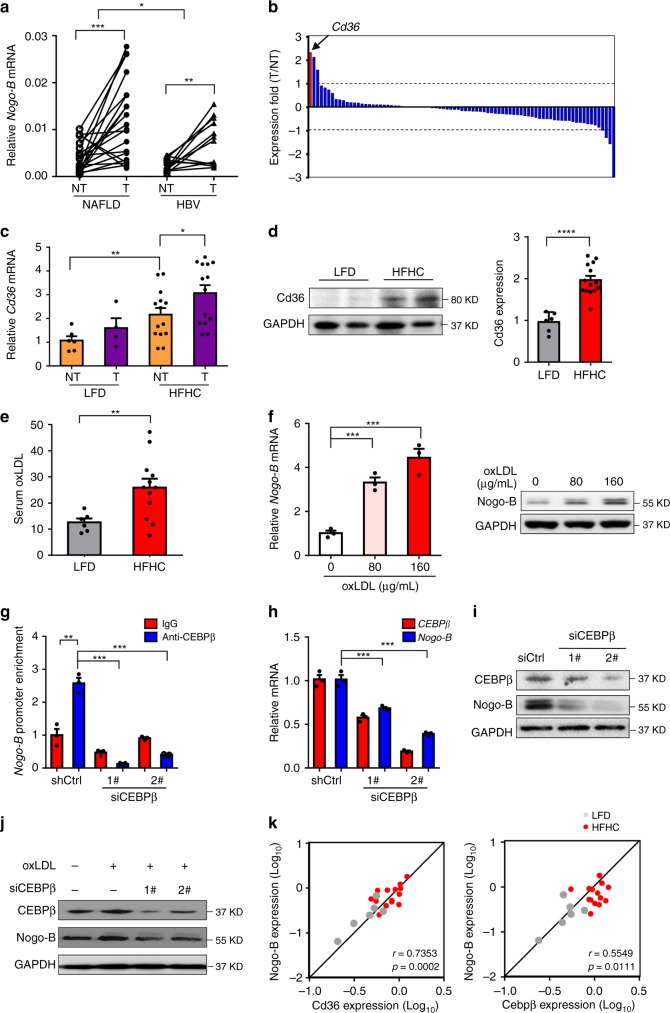
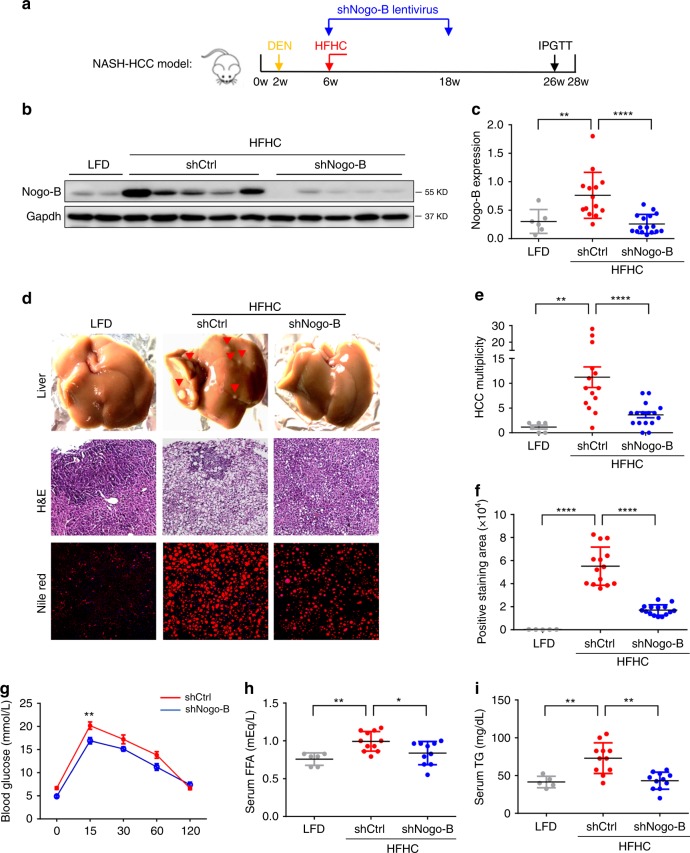
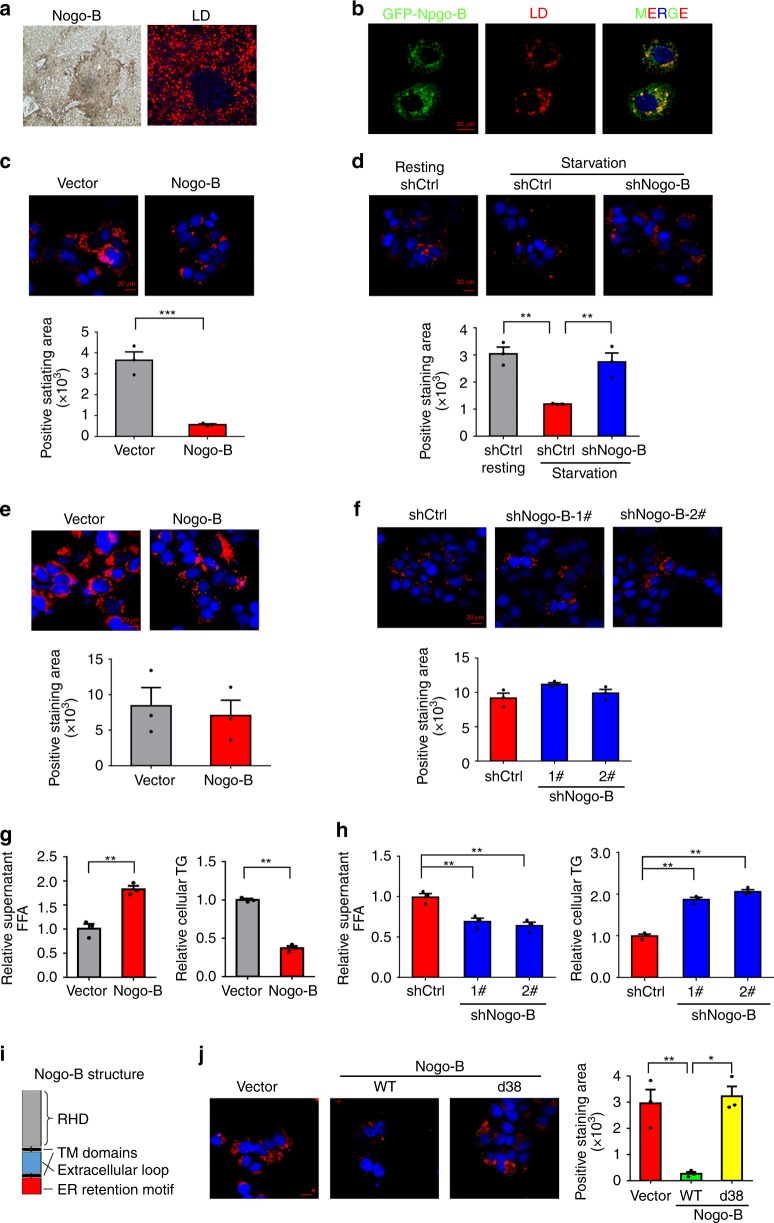
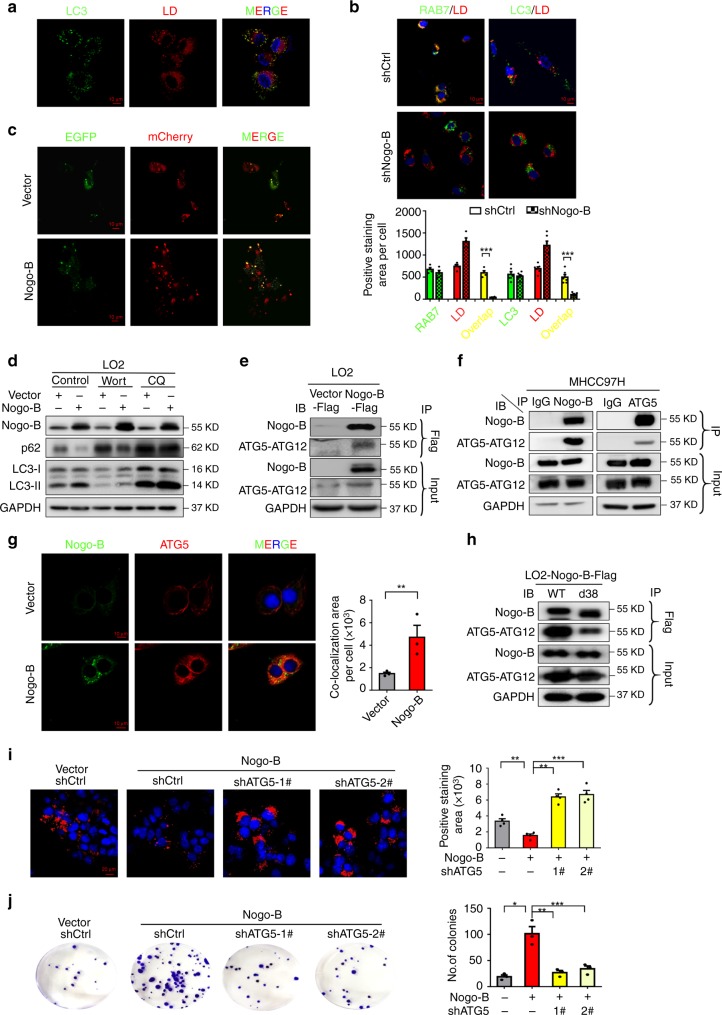
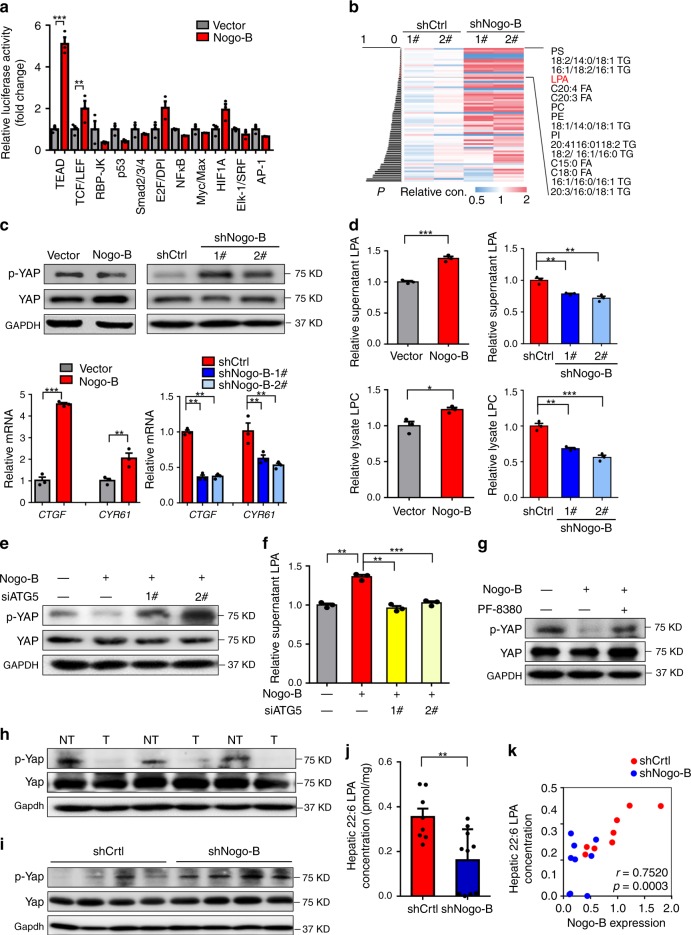
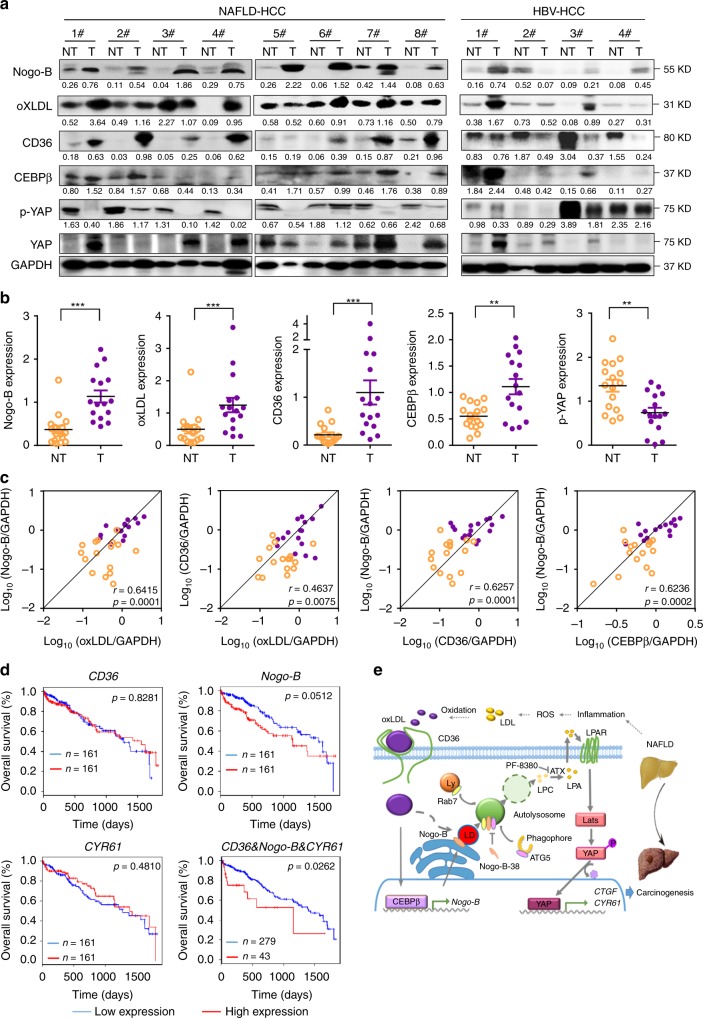
Non-alcoholic fatty liver disease (NAFLD) is the hepatic manifestation of the metabolic syndrome that elevates the risk of hepatocellular carcinoma (HCC). Although alteration of lipid metabolism has been increasingly recognized as a hallmark of cancer cells, the deregulated metabolic modulation of HCC cells in the NAFLD progression remains obscure. Here, we discovers an endoplasmic reticulum-residential protein, Nogo-B, as a highly expressed metabolic modulator in both murine and human NAFLD-associated HCCs, which accelerates high-fat, high-carbohydrate diet-induced metabolic dysfunction and tumorigenicity. Mechanistically, CD36-mediated oxLDL uptake triggers CEBPβ expression to directly upregulate Nogo-B, which interacts with ATG5 to promote lipophagy leading to lysophosphatidic acid-enhanced YAP oncogenic activity. This CD36-Nogo-B-YAP pathway consequently reprograms oxLDL metabolism and induces carcinogenetic signaling for NAFLD-associated HCCs. Targeting the Nogo-B pathway may represent a therapeutic strategy for HCC arising from the metabolic syndrome.


Conflict of interest statement

The authors declare no competing interests.

Figures

Fig. 1
Fig. 1
Nogo-B is highly expressed and promotes tumorigenesis in HCC. a ER network genes profiling strategy. b Heatmap representation of the fold change of ER-residential genes expression in three paired tumors (T) and noncancerous livers (NT) from murine NASH-promoted HCC mice. c Western blot analysis of Nogo-B expression in paired tumors (T) and adjacent noncancerous livers (NT) from HFHC-treated mice. d Fold change and basal expression level of ER-residential genes in the TCGA database. e Western blot analysis of Nogo-B expression in normal liver cell line LO2 and multiple HCC cell lines. f, g Colony formation assay of (f) LO2 and SMMC-7721 cells transfected with empty control (vector) and Nogo-B expression plasmid (Nogo-B), and g SK-Hep1 and MHCC97H cells infected with lenti-shCtrl (shCtrl) or lenti-shNogo-B (shNogo-B) for 14 days. h, i Representative tumor images (left) and tumor volumes (right) of xenografts derived from h LO2 cells stably transfected with empty control (vector) and Nogo-B expression plasmid (Nogo-B), and i MHCC97H cells stably transfected with control (shCtrl) or Nogo-B shRNA (shNogo-B) (n = 5 in each group). In all, 5 x 106 cells were subcutaneously injected into the right and left flanks of the mice. The tumors were collected after 4 weeks. j, k Liver tumor images (top), tumor volume and tumor weight (bottom) of orthotopic models derived from j control and Nogo-B overexpressing LO2 cells, and k control and Nogo-B-knockdown MHCC97H cells (n = 4 in each group). In all, 1.0 mm3 tumor pieces were implanted into the left liver lobe of each mouse. The mice were sacrificed after 5 weeks. (Data are presented as mean ± SEM of three independent experiments in f and g. *p < 0.05, **p < 0.01, ***p < 0.001. Source data are provided as a Source Data file)
Fig. 2
Fig. 2
Nogo-B is enhanced by the oxLDL-CD36-CEBPβ cascade. a qRT-PCR analysis of Nogo-B mRNA expression in tumors (T) and adjacent normal tissues (NT) from NAFLD-associated (n = 20) and HBV-associated (n = 12) HCC patients, respectively. b PCR Array of fatty liver-related genes in two paired tumors (T) and adjacent normal tissues (NT) from murine NASH-associated HCC model. c qRT-PCR analysis of Cd36 mRNA expression in livers from LFD- (n = 6) and HFHC-fed (n = 14) mice. d Representative western blot images (left) and quantification (right) of Cd36 expression in the livers of mice described in c. e Serum oxLDL level of mice described in livers from LFD- (n = 6) and HFHC-fed (n = 12) mice. f qRT-PCR (left) and western blot (right) analysis of Nogo-B expression in SMMC-7721 cells stimulated with oxLDL at indicated dosages for 24 h. gi CEBPβ directly upregulates Nogo-B expression as shown by g ChIP-PCR, h qRT-PCR, and i western blot analysis. MHCC97H cells were transfected with CEBPβ siRNAs for 48 h. j Western blot analysis of Nogo-B expression in SMMC-7721 cells transfected with CEBPβ siRNAs followed by oxLDL treatment (80 μg/mL) for 24 h. k Correlation of protein levels of Cd36 and Nogo-B (left), and Cebpβ and Nogo-B (right) in the livers of mice described in c. (Data are presented as mean ± SEM of three independent experiments in fh. *p < 0.05, **p < 0.01, ***p< 0.001. Source data are provided as a Source Data file)
Fig. 3
Fig. 3
Knockdown of Nogo-B inhibits NASH and HCC progression. a Scheme of HFHC-promoted NASH-associated HCC model. b, c Representative (b) western blot images and (c) quantification of Nogo-B expression in the livers of DEN-treated and, LFD- or HFHC-fed mice administered with lentivirus expressing shCtrl or shNogo-B. Mice were sacrificed at 28 weeks of age. LFD/shCtrl: n = 6, HFHC/shCtrl: n = 14, HFHC/shNogo-B: n = 16. d Representative liver pictures (top), H&E staining (middle) and Nile red staining (bottom) in the livers of LFD- and HFHC-fed mice with lentivirus administration. e The average tumor multiplicity of LFD- and HFHC-fed mice described in c. f The percentages of positively stained Nile red areas in the livers of LFD- and HFHC-fed mice described in c. g Blood glucose of 26-week-old HFHC-fed mice at indicated time-points after glucose injection in IPGTT analysis (n = 12 in each group). h, i Serum h FFA and i TG concentrations of LFD- and HFHC-fed mice described in c. (*p< 0.05, **p < 0.01, ****p< 0.0001. Source data are provided as a Source Data file)
Fig. 4
Fig. 4
Nogo-B promotes lipid droplet degradation in HCC cells. a Immunohistochemical staining of Nogo-B and Nile red staining of murine NASH-associated HCCs. b Co-localization of GFP-Nogo-B and LDs in LO2 cells transfected with Nogo-B for 48 h and incubated with oxLDL for 24 h followed by starvation. c Representative LipidTOX staining (top) and quantification of positively stained areas (bottom) of Nogo-B-overexpressing LO2 cells treated with oxLDL for 24 h followed by starvation in 0.1% FBS for 12 h. Cellular lipid droplets were stained using LipidTOX for 30 min. d Representative LipidTOX staining (top) and quantification of positively stained areas (bottom) of oxLDL-loaded MHCC97H cells stably transfected with shCtrl or shNogo-B with starvation or without starvation (resting) in 0.1% FBS for 12 h. e, f Representative LipidTOX staining (top) and quantification of positively stained areas (bottom) of e Nogo-B-overexpressing LO2 cells and f MHCC97H cells stably transfected with shCtrl or shNogo-B and treated with oxLDL for 24 h. g, h FFA concentration in supernatant (left) and TG concentration in cell lysate (right) extracted from g Nogo-B-overexpressing LO2 cells and h MHCC97H cells stably transfected with shCtrl or shNogo-B and treated with oxLDL for 24 h followed by starvation. i The domain organization and dissection of the human Nogo-B protein. j Representative LipidTOX staining (left) and quantification of positively stained areas (right) of wile-type Nogo-B (WT) or ER-motif-deficient Nogo-B (d38) ectopically expressed LO2 cells treated with oxLDL for 24 h followed by starvation in 0.1% FBS for 12 h. (Data are presented as mean ± SEM of three independent experiments in ch and j. *p < 0.05, **p < 0.01, ***p < 0.001. Source data are provided as a Source Data file)
Fig. 5
Fig. 5
Nogo-B promotes lipophagy in HCC cells. a Immunofluorescence of LC3 and LD in LO2 cells treated with oxLDL for 24 h followed by starvation. b Representative immunofluorescence images (top) and quantification of co-localization areas (bottom) of RAB7 and LD, and LC3 and LD in control or Nogo-B-knockdown SK-Hep1 cells treated with oxLDL for 24 h followed by starvation. c Immunofluorescence of control and Nogo-B-overexpressing LO2 cells transfected with mCherry-EGFP-LC3 plasmid for 48 h followed by starvation. d Western blot analysis of Nogo-B, p62 and LC3 expression in starved control or Nogo-B-overexpressing LO2 cells treated with or without wortmannin (Wort) or chloroquine (CQ). e, f Co-immunoprecipitation of Nogo-B and ATG5 in e control or Nogo-B -overexpressing LO2 cells and f MHCC97H cells treated with oxLDL for 24 h followed by starvation. g Representative immunofluorescence images (left) and quantification of co-localization areas (right) of Nogo-B and ATG5 in starved control or Nogo-B-overexpressing LO2 cells. h Co-immunoprecipitation of Nogo-B and ATG5 in wile-type Nogo-B (WT) or ER-motif-deficient Nogo-B (d38) ectopically expressed LO2 cells treated with oxLDL for 24 h followed by starvation. i Representative LipidTOX staining (left) and quantification of positively stained areas (right) of control or Nogo-B-overexpressing LO2 cells transfected with ATG5 shRNAs for 48 h and treated with oxLDL for 24 h followed by starvation. j Representative image (left) and quantification of colonies (right) of control and stable Nogo-B-overexpressing LO2 cells transfected with ATG5 shRNAs for 2 weeks. (Data are presented as mean ± SEM of three independent experiments in b, g, and ij. *p < 0.05, **p < 0.01, ***p < 0.001. Source data are provided as a Source Data file)
Fig. 6
Fig. 6
Nogo-B stimulates the Hippo pathway in HCC cells. a Pathway reporter luciferase array revealed signaling deregulation by Nogo-B in LO2 cells. Cells were transfected with different pathway luciferase reporters for 48 h. b Heatmap of lipidomics signatures in livers from HFHC-promoted HCCs (n = 2 in each group). c Western blot (top) and qRT-PCR (bottom) analyses of YAP activity in LO2 cells upon ectopic expression (left) and MHCC97H cells upon knockdown (right) of Nogo-B. d LPA concentrations in the supernatant (top) and LPC concentrations in the cell lysate (bottom) of LO2 cells upon Nogo-B ectopic expression (left) and MHCC97H cells upon Nogo-B knockdown (right). Stable cell lines were treated with oxLDL for 24 h followed by starvation. Supernatant and cell lysate were collected for detection. e Western blot analysis of p-YAP and YAP in control or Nogo-B-overexpressing LO2 cells transfected with ATG5 siRNAs for 48 h and treated with oxLDL for 24 h followed by starvation. f LPA concentrations in the supernatant of control or Nogo-B-overexpressing LO2 cells transfected with ATG5 siRNAs for 48 h and treated with oxLDL for 24 h followed by starvation. g Western blot analysis of p-YAP and YAP in control or Nogo-B-overexpressing LO2 cells with treatment of oxLDL for 6 h and then additional PF-8380 (250 nM) treatment for 36 h followed by starvation. h Western blot analysis of p-Yap and Yap in paired tumors (T) and normal tissues (NT) from HFHC-fed mice (n = 3 in each group). i Western blot analysis of p-Yap and Yap of the liver tissues from HFHC-fed mice administered with lentivirus expressing shCtrl or shNogo-B (n = 4 in each group). j 22:6 LPA concentrations in the liver tissues from HFHC-fed mice administered with lentivirus expressing shCtrl (n = 8) or shNogo-B (n = 10). k Correlation analysis of 22:6 LPA concentrations and Nogo-B expression levels in the liver tissues from HFHC-fed mice administered with lentivirus expressing shCtrl (n = 8) or shNogo-B (n = 10). (Data are presented as mean ± SEM of three independent experiments in a, c, d, and f. *p< 0.05, **p< 0.01, ***p < 0.001. Source data are provided as a Source Data file)
Fig. 7
Fig. 7
Enhanced Nogo-B cascade in clinical NAFLD-associated HCCs. a Representative blots of western blot analysis of upregulation of Nogo-B, oxLDL, CD36, and CEBPβ, and inhibition of YAP phosphorylation in eight paired human NAFLD-associated HCCs (left) and four paired human HBV-associated HCCs (right) (T, tumors; NT, adjacent normal tissues). b Quantification of Nogo-B, oxLDL, CD36, CEBPβ, and p-YAP in 16 pairs of NAFLD-associated HCC patient samples. (*p < 0.05; **p < 0.01; ***p< 0.001. Source data are provided as a Source Data file). c Correlation analysis of protein levels of Nogo-B and oxLDL-CD36-CEBPβ cascade in 16 pairs of NAFLD-associated HCC patient samples. d Kaplan–Meier analyses for HCC patients with tumors expressing high or low level of CD36, Nogo-B, or CYR61. e Working model of Nogo-B-promoted LD degradation and activation of YAP signaling in NAFLD-associated HCC

Similar articles

Cited by

References

    1. Pocha C, Kolly P, Dufour JF. Nonalcoholic fatty liver disease-related hepatocellular carcinoma: a problem of growing magnitude. Semin. Liver Dis. 2015;35:304–317. doi: 10.1055/s-0035-1562949. - DOI - PubMed
    1. Diehl AM, Day CCause. Pathogenesis, and treatment of nonalcoholic steatohepatitis. New Engl. J. Med. 2017;377:2063–2072. doi: 10.1056/NEJMra1503519. - DOI - PubMed
    1. Wong VW, et al. Pathogenesis and novel treatment options for non-alcoholic steatohepatitis. Lancet Gastroenterol. Hepatol. 2016;1:56–67. doi: 10.1016/S2468-1253(16)30011-5. - DOI - PubMed
    1. Henkel A, Green RM. The unfolded protein response in fatty liver disease. Semin. Liver Dis. 2013;33:321–329. doi: 10.1055/s-0033-1358522. - DOI - PMC - PubMed
    1. Sanyal AJ. American Gastroenterological A. AGA technical review on nonalcoholic fatty liver disease. Gastroenterology. 2002;123:1705–1725. doi: 10.1053/gast.2002.36572. - DOI - PubMed

Publication types

MeSH terms