. 2019 Jul 29;9(1):10905.
doi: 10.1038/s41598-019-47191-8.

Host circadian rhythms are disrupted during malaria infection in parasite genotype-specific manners

Affiliations

Host circadian rhythms are disrupted during malaria infection in parasite genotype-specific manners

Kimberley F Prior et al. Sci Rep. .

Abstract

Infection can dramatically alter behavioural and physiological traits as hosts become sick and subsequently return to health. Such "sickness behaviours" include disrupted circadian rhythms in both locomotor activity and body temperature. Host sickness behaviours vary in pathogen species-specific manners but the influence of pathogen intraspecific variation is rarely studied. We examine how infection with the murine malaria parasite, Plasmodium chabaudi, shapes sickness in terms of parasite genotype-specific effects on host circadian rhythms. We reveal that circadian rhythms in host locomotor activity patterns and body temperature become differentially disrupted and in parasite genotype-specific manners. Locomotor activity and body temperature in combination provide more sensitive measures of health than commonly used virulence metrics for malaria (e.g. anaemia). Moreover, patterns of host disruption cannot be explained simply by variation in replication rate across parasite genotypes or the severity of anaemia each parasite genotype causes. It is well known that disruption to circadian rhythms is associated with non-infectious diseases, including cancer, type 2 diabetes, and obesity. Our results reveal that disruption of host circadian rhythms is a genetically variable virulence trait of pathogens with implications for host health and disease tolerance.


Conflict of interest statement

The authors declare no competing interests.

Figures
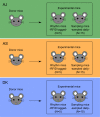
Figure 1
Figure 1
Experimental design. We separately raised three genotypes (AJ, AS, DK) of Plasmodium chabaudi in donor mice before inoculating them into 3 groups of 20 experimental mice. We tagged 5 experimental mice per genotype with wireless RFID probes to monitor locomotor activity and body temperature non-invasively (“rhythm mice”) and we blood sampled 15 experimental mice per genotype to monitor parasite and host dynamics once per day (“sampling mice”). We followed host rhythms and infection dynamics throughout 14 days of infection.
Figure 2
Figure 2
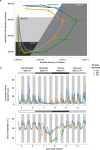
Parasite genotype-specific effects on host sickness, locomotor activity and body temperature rhythms during malaria infection. (a) Disease map of host sickness using the relationship between mean ± SEM red blood cell (RBC) and mean ± SEM parasite density (adapted from Torres et al.) for three parasite genotypes (N ≤ 15 per genotype: green = AJ, orange = AS, blue = DK) measured each day post infection (PI) for 14 days. The map falls into 4 three-day segments. (i) Hosts are considered “asymptomatic” (white, days 3–5 PI) until RBC density begins to drop; (ii) Hosts experience “moderate” symptoms (medium grey, days 6–8 PI) until RBC density reaches its minimum; (iii) “severe” symptoms (dark grey, days 9–11 PI) spans the period of extremely low RBC densities; and (iv) hosts are in “recovery” (light grey, days 12–14 PI) until RBC density returns to the level before infection. (b) Mean ± SEM hourly locomotor activity and body temperature (see Supplementary Table S1 for further explanation) for 14 days of infection with the same three parasite genotypes (N = 5 per genotype: green = AJ, orange = AS, blue = DK). Note in B the line break on day 9–10 PI for the AJ genotype which represents missing data.
Figure 3
Figure 3
Locomotor activity and body temperature profiles for each 3-day infection segment. (a) All data with model predictions (fitted model for the average subject, with 95% confidence intervals calculated by bootstrapping N = 500). Each data point behind the model prediction is a 3-day locomotor activity or body temperature average for each mouse (N ≤1 5 per genotype: green circles = AJ, orange triangles = AS, blue squares = DK) at every hour (24-hours in total) and the model is fit to these averaged data points. Time is in Zeitgeber Time (ZT) which is the number of hours since lights on (ZT0) and ZT12 is the start of lights off (as indicated by shaded area). (b) Mean ± SEM levels of locomotor activity or body temperature during night time or daytime for the infection segments (N ≤ 5 per genotype: green = AJ, orange = AS, blue = DK). For night-day comparisons we use the average amount of locomotor activity and body temperature for each segment of infection, using ZT14-22 as night time and ZT2-10 as daytime to avoid any effects of dark-light transitions. Night time is indicated by the shaded area. Light and dark bars indicate lights on (7 am/ZT0) and lights off (7 pm/ZT12).
Figure 4
Figure 4
Daily dynamics for disruption to locomotor activity and body temperature rhythms and metrics for parasite virulence. (a) Similarity between locomotor activity rhythms on each day post infection compared to before infection (higher R2 = rhythms more similar to before infection). (b) Similarity between body temperature rhythms on each day post infection compared to before infection. (c) Host red blood cell density (anaemia) during infections. (d) Asexual parasite density during infections. Mean ± SEM plotted (N ≤ 15 per genotype: green = AJ, orange = AS, blue = DK). Mice were sampled once per day between days 3–14 post infection in c and d. N ≤ 5 per genotype for (a,b) and N ≤1 5 for (c,d).
Figure 5
Figure 5
Correlations between red blood cell (RBC) density and parasite density with levels of disruption to locomotor activity (a,b) and body temperature (c,d) rhythms. Hosts infected with each of our parasite genotypes are plotted (green circles = AJ, orange triangles = AS, blue squares = DK), with one measure per day for either red blood cell density or parasite density on the x-axis (calculated from mean of 3 “sampling mice” each day post infection), against all R2 values on the y-axis, on each corresponding day post infection (calculated from “rhythm mice”, ≤5 per parasite genotype). A low R2 value indicates the pattern of host rhythms is different to the rhythm observed before hosts were infected. RBC and parasite density data are transformed by log10 in the models to improve residual homogeneity. Model predictions are plotted as a solid line for the overall model fit (fitted model for the average subject), with 95% confidence intervals calculated by bootstrapping N = 500. Models and error are bounded at 1 on the y-axis, as R2 does not go above 1.

Similar articles

Cited by

References

    1. Dunlap JC. Genetic and Molecular Analysis of Circadian Rhythms. Annu. Rev. Genet. 1996;1:579–601. doi: 10.1146/annurev.genet.30.1.579. - DOI - PubMed
    1. Young MW, Kay SA. Time zones: a comparative genetics of circadian clocks. Nat. Rev. Genet. 2001;9:702–15. doi: 10.1038/35088576. - DOI - PubMed
    1. Paranjpe DA, Sharma VK. Evolution of temporal order in living organisms. J. Circadian Rhythms. 2005;3:7. doi: 10.1186/1740-3391-3-7. - DOI - PMC - PubMed
    1. van der Veen DR, et al. Flexible clock systems: adjusting the temporal programme. Philos. Trans. R. Soc. Lond. B. Biol. Sci. 2017;372:20160254. doi: 10.1098/rstb.2016.0254. - DOI - PMC - PubMed
    1. Vaze KM, Sharma VK. On the adaptive significance of circadian clocks for their owners. Chronobiol. Int. 2013;30:413–33. doi: 10.3109/07420528.2012.754457. - DOI - PubMed

Publication types