. 2019 Jul 29;9(1):10989.
doi: 10.1038/s41598-019-47440-w.

Migration rather than proliferation transcriptomic signatures are strongly associated with breast cancer patient survival

Affiliations

Migration rather than proliferation transcriptomic signatures are strongly associated with breast cancer patient survival

Nishanth Ulhas Nair et al. Sci Rep. .

Abstract

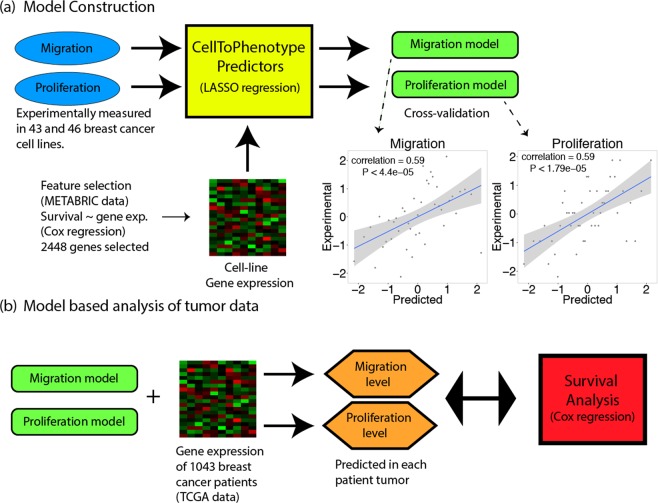
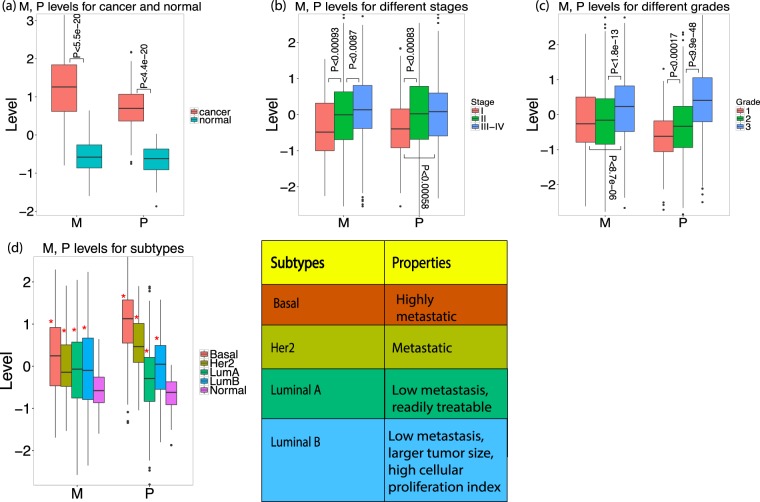
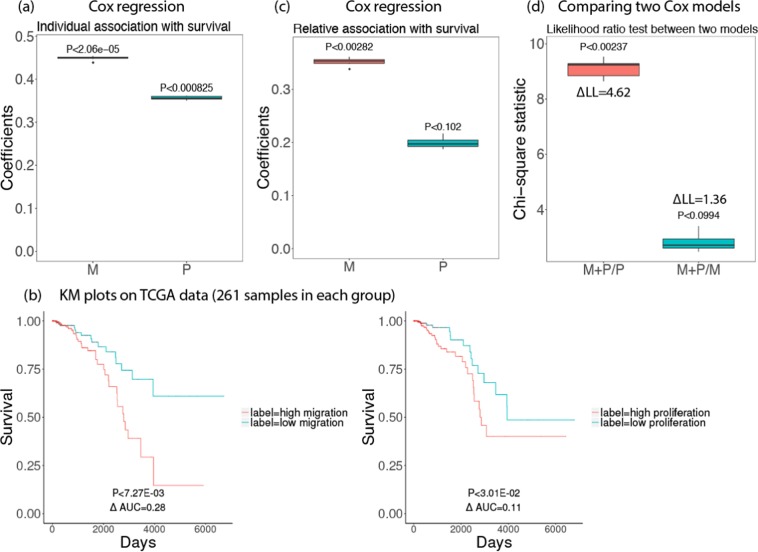
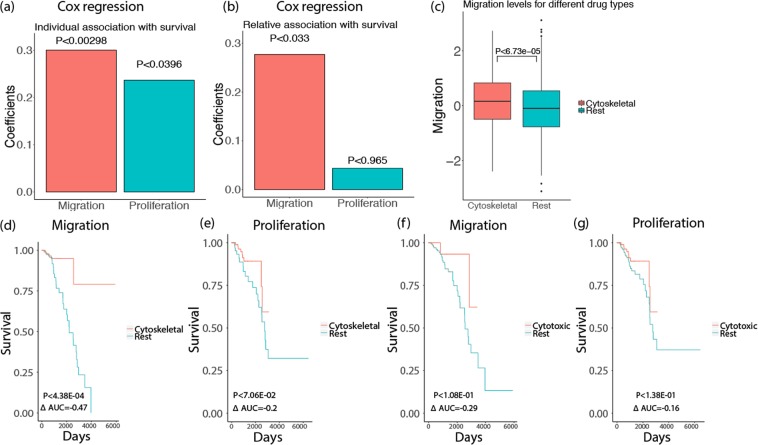
The efficacy of prospective cancer treatments is routinely estimated by in vitro cell-line proliferation screens. However, it is unclear whether tumor aggressiveness and patient survival are influenced more by the proliferative or the migratory properties of cancer cells. To address this question, we experimentally measured proliferation and migration phenotypes across more than 40 breast cancer cell-lines. Based on the latter, we built and validated individual predictors of breast cancer proliferation and migration levels from the cells' transcriptomics. We then apply these predictors to estimate the proliferation and migration levels of more than 1000 TCGA breast cancer tumors. Reassuringly, both estimates increase with tumor's aggressiveness, as qualified by its stage, grade, and subtype. However, predicted tumor migration levels are significantly more strongly associated with patient survival than the proliferation levels. We confirmed these findings by conducting siRNA knock-down experiments on the highly migratory MDA-MB-231 cell lines and deriving gene knock-down based proliferation and migration signatures. We show that cytoskeletal drugs might be more beneficial in patients with high predicted migration levels. Taken together, these results testify to the importance of migration levels in determining patient survival.


Conflict of interest statement

The authors declare no competing interests.

Figures

Figure 1
Figure 1
Overview of the method. (a) CellToPhenotype predictors of migration and proliferation from gene expression are constructed from experimentally determined migration and proliferation measurements across 43 and 46 breast cancer cell lines respectively. The predictors are built using cross-validation, and the correlations obtained between predicted levels and actual experimentally measured values are depicted as scatter plots. (b) The CellToPhenotype predictors are used to analyze the gene expression values of breast cancer patients to predict migration and proliferation levels of 1043 TCGA breast cancer tumors. Subsequently, the association of tumors predicted migration and proliferation levels with different tumor phenotypes and patients’ survival is examined.
Figure 2
Figure 2
(a) Predicted migration (M) and proliferation (P) levels of breast cancer tumors and their association with various clinical phenotypes. (a) M, P levels of 110 breast cancer patients for their tumor (cancer) and matched non-cancerous breast samples (normal). (b) Predicted M, P levels for 937 breast cancer TCGA tumors for which cancer stage information is available. (c) Predicted M, P levels for 1706 METABRIC breast cancer patients for which cancer grade information is available. (d) Predicted M, P levels for 497 breast TCGA tumors dataset having subtype information: Basal or Triple-Negative (91 patients), Her2 (55 patients), Luminal A (LumA, 224 patients), Luminal B (LumB, 127 patients), and noncancerous samples (110 patients). The properties of these subtypes are shown in a table. Significant differences (when comparing tumors to non-cancerous samples) are marked via ‘*’.
Figure 3
Figure 3
Survival analysis for 1043 breast cancer patients in TCGA data using predicted migration (M) and proliferation (P). Box plots of 10 iterations are shown and median p-value of each coefficient is given above the box plots. A positive coefficient (risk factor) for M (or P) indicates that the higher value of M (or P), the lower the patient survival. (a) Coefficients of M, P when used to predict survival individually using Cox regression after controlling for age, race, and genomic instability. (b) A Kaplan Meyer (KM) survival analysis of tumors’ predicted migration and proliferation levels. Top 25 and bottom 25 percentile of the predicted migration/proliferation samples in each group were considered (261 samples in each group). (c) Relative coefficients of M, P when used to predict survival when they are controlled by each other (multivariate Cox-regression). (d) Likelihood ratio test comparing how significantly different are two Cox regression models with each other (Chi-square test statistics with p-values are provided): (i) Migration and Proliferation vs Proliferation only (M + P/P); (ii) Migration and Proliferation vs Migration only (M + P/M). The difference between log-likelihood (∆LL) between the two models is also shown.
Figure 4
Figure 4
(a) Cox regression of KD-migration-scores and KD-proliferation-scores with patients’ survival, after controlling for age, race, and genomic instability for 1043 breast cancer patients in TCGA data. (b) Relative association of KD-migration-scores and KD-proliferation-scores with survival. (c) Migration levels (estimated from CellToPhenotype predictors) for breast cancer patients who have taken cytoskeletal drugs versus the rest. (d) Among the breast cancer patients who have high migration levels (greater than 75 percentile), a KM analysis was done between those who have taken cytoskeletal drugs versus the rest of the patients. (e) Similarly, among the patients that have high proliferation levels, a KM analysis was done between those who have taken cytoskeletal drugs versus the rest of the patients. (f) A KM analysis of patients who have high migration levels and who have taken only cytotoxic drugs versus the rest. (g) A KM analysis of patients who have high proliferation levels and have taken only cytotoxic drugs versus the rest.

References

    1. Kaitlin, K. I. The Landscape for Pharmaceutical Innovation: Drivers of Cost-Effective Clinical Research. Pharm Outsourcing 1–6 (2010). - PMC - PubMed
    1. Torjesen, I. Drug development: the journey of a medicine from lab to shelf. Pharmaceutical Journal (2015).
    1. Arrowsmith J. Trial watch: Phase III and submission failures: 2007–2010. Nat. Rev. Drug Discov. 2011;10:87–87. doi: 10.1038/nrd3375. - DOI - PubMed
    1. Weinstein JN, et al. An Information-Intensive Approach to the Molecular Pharmacology of Cancer. Science (80-.). 1997;275:343–349. doi: 10.1126/science.275.5298.343. - DOI - PubMed
    1. Staunton JE, et al. Chemosensitivity prediction by transcriptional profiling. Proc. Natl. Acad. Sci. 2001;98:10787–10792. doi: 10.1073/pnas.191368598. - DOI - PMC - PubMed

Publication types