. 2019 Aug;121(5):405-416.
doi: 10.1038/s41416-019-0531-5. Epub 2019 Jul 30.

Distinct prognostic value of circulating anti-telomerase CD4+ Th1 immunity and exhausted PD-1+/TIM-3+ T cells in lung cancer

Affiliations

Distinct prognostic value of circulating anti-telomerase CD4+ Th1 immunity and exhausted PD-1+/TIM-3+ T cells in lung cancer

Caroline Laheurte et al. Br J Cancer. 2019 Aug.

Abstract

Background: Despite the critical roles of Th1-polarised CD4+ T cells in cancer immunosurveillance, the translation of their potential to clinical use remains challenging. Here, we investigate the clinical relevance of circulating antitumor Th1 immunity in non-small cell lung cancer (NSCLC).

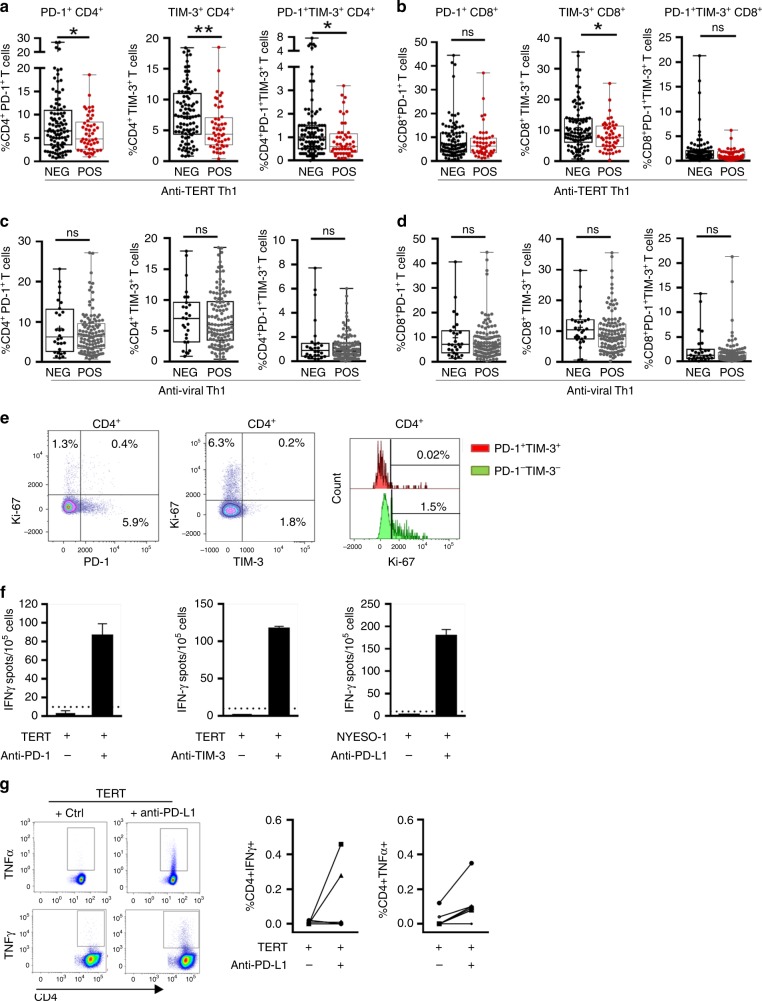
Methods: The circulating antitumor Th1 response was assessed by the ELISpot assay in 170 NSCLC patients using a mixture of HLA class II-restricted peptides from telomerase (TERT). Phenotyping of blood immune cells was performed by flow cytometry.

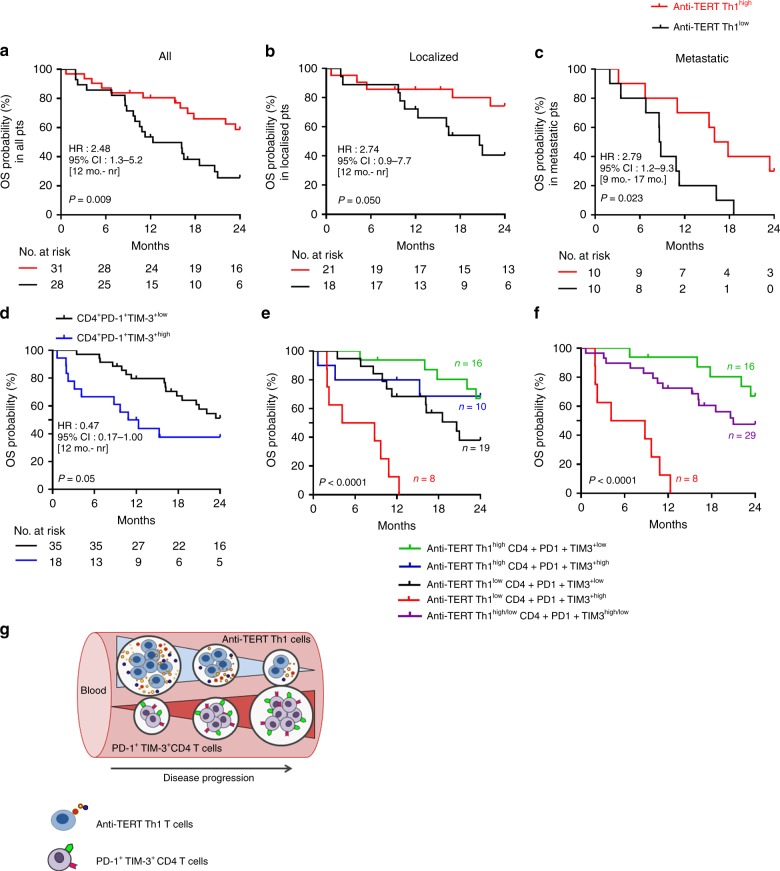
Results: TERT-reactive CD4 T-cell response was detected in 35% of NSCLC patients before any treatment. Functional analysis showed that these cells were effector memory and Th1 polarised capable to produce effector cytokines, such as IFN-γ, TNF-α and IL-2. The presence of anti-TERT Th1 response was inversely correlated with the level of exhausted PD-1+/TIM-3+CD4 T cells. The level of these two immune parameters differentially affected the survival, so that increased level of anti-TERT Th1 response and low rate of exhausted PD-1+TIM-3+CD4+ T cells were associated with a better prognosis.

Conclusions: Systemic anti-TERT Th1 response plays a strong antitumor protective role in NSCLC. This study underlines the potential interest of monitoring circulating antitumor Th1 response for patients' stratification and therapy decision.


Conflict of interest statement

The authors declare no competing interests.

Figures

Fig. 1
Fig. 1
Distribution and functional characterisation of TERT-specific CD4+ T cells in patients with NSCLC. a TERT-specific CD4+ T-cell responses were evaluated in 170 naïve-NSCLC patients by IFN-γ ELISpot assay performed after an in vitro stimulation of PBMC with HLA class II peptides derived from TERT. b, c Distribution of anti-TERT IFN-γ CD4+ T cells in NSCLC patients (n = 170), shown as the number of spots (b), and ratio of spots (c). Grey lines indicate the positivity thresholds, and blue lines indicate the median of spots calculated in responders patients. d Frequency of patients with negative (NEG) and positive (POS) anti-TERT Th1 responses. eg Phenotypic and functional characterisation of anti-TERT CD4+ T cells detected by flow cytometry. e Dot plots of one representative patient show CCR7 and CD45RA and ICOS staining in IFN-γ/IFN-γ+ CD4+ T cells. f Dot plots of one representative patient show CXCR3 and CCR6 staining in IFN-γ+ CD4+ T cells. g Dot plots of one representative patient show IFN-γ, TNF-α, IL-2, IL-4 and IL-17 cytokines production in response to TERT stimulation. The data are representative of three independent experiments
Fig. 2
Fig. 2
Relationship between TERT-specific CD4+ Th1 response and blood immune factors in patients with NSCLC. a Heatmap illustrating hierarchical clustering (Euclidean distance) of 22 blood immune parameters (in rows) from NSCLC patients (n = 110) (in columns). b, c Unsupervised principal component analysis (PCA), including frequency (b) and magnitude (c) of anti-TERT Th1 response in relation to 21 blood immune parameters. d, e Representative dot plots (top row) show expressions of PD-1 and/or TIM-3 among CD4+ T cells (d) and CD8+ T cells (e). Histograms show peripheral T-cell expression levels of PD-1, TIM-3 and PD-1+ TIM-3+ among CD4+ T cells (d) and CD8+ T cells (e) from healthy donors (HD, n = 35) and NSCLC patients (n = 109). Median and interquartile range (IQR) are indicated (Mann–Whitney test). *P < 0.05; **P < 0.01. ns not significant
Fig. 3
Fig. 3
Inverse correlation between the presence of anti-TERT CD4+ Th1 response and the level of exhausted PD-1+TIM-3+ T cells. a, b Levels of circulating PD-1+ and/or TIM-3+ CD4+ T cells (a) and CD8+ T cells (b) in patients with anti-TERT Th1 response (n = 49) and in non-responders (n = 96) (Mann–Whitney test). c, d Levels of circulating PD-1+ and/or TIM-3+ CD4+ T cells (c) and CD8+ T cells (d) in patients with antiviral Th1 response (n = 116) and in non-responders (n = 28) (Mann–Whitney test). Box spans indicate median and 25th–75th percentile, whiskers indicate the highest/lowest datapoints. e Dot plots show Ki-67 staining of unstimulated PBMC from one representative patient. f, g Blood lymphocytes from patients were stimulated with TERT-derived peptides with or without blocking mAb against PD-L1, PD-1 and/or TIM-3. TERT-specific T cells were measured by ICS or ELISpot. f Histograms show IFN-γ spot-forming cells from three representative patients. g In left, representative dot plot of TNF-α and IFN-γ-producing CD4+ T cells; In right, percentage of IFN-γ and TNF-α-secreting anti-TERT CD4 + T cells (n = 6). The data are representative of three independent experiments. *P < 0.05; **P < 0.01. ns not significant
Fig. 4
Fig. 4
Distribution of circulating exhausted PD-1+/TIM-3+ T cells and anti-TERT Th1 response across NSCLC stages. a, b Levels of circulating PD-1+ and/or TIM-3+ CD4+ T cells (a) and CD8+ T cells (b) in localised NSCLC (stages I–III, n = 77) and metastatic NSCLC (stage IV, n = 68) (Mann–Whitney test). Box span indicates 25th–75th percentiles. Whiskers indicate the highest and lowest datapoints. c Frequency of circulating anti-TERT Th1 response in localised versus metastatic NSCLC (χ2 test). d Ratio of anti-TERT IFN-γ spots to exhausted PD-1+/TIM-3+ CD4+ T cells in localised NSCLC (n = 77) and metastatic NSCLC (n = 68) (Mann–Whitney test). e Frequency of circulating IFN-γ antitumor Th1 response against WT-1, and NYESO-1, in localised versus metastatic NSCLC (χ2 test). f Frequency of antiviral T-cell responses in localised NSCLC (n = 87) versus metastatic NSCLC (n = 83) (χ2 test). Histograms indicate mean ± SD. *P < 0.05; **P < 0.01. ns not significant
Fig. 5
Fig. 5
Prognostic value of systemic anti-TERT Th1 response and exhausted PD-1+/TIM-3+ CD4+ T cells in NSCLC. ac Association between the level of circulating anti-TERT CD4 Th1 response and overall survival. A threshold (low < 3.7 < high) was defined based on the ratio of TERT-specific IFN-γ spots. Kaplan–Meier curves according to anti-TERT Th1 ratio: in all TERT responders (n = 59) (a), in localised stages (n = 39) (b) and in metastatic stages (n = 20) (c) (log-rank tests). d Association between the level of circulating PD-1+TIM-3+ CD4+ T-cell subsets and overall survival. Two groups were determined based on the median rate of exhausted PD-1+TIM-3+ CD4+ T-cell (0.9). Kaplan–Meier curves according to PD-1+TIM-3+ T cell (log-rank tests). e, f Patients were classified into distinct groups based on the anti-TERT CD4 Th1 ratio and the median level of PD-1+TIM-3+CD4+T cells. e, f Kaplan–Meier curves for the following groups: anti-TERT Th1high/CD4+PD1+TIM3low (green), anti-TERT Th1high/CD4+PD1+TIM3high (blue), anti-TERT Th1low/CD4+PD1+TIM3low (black), anti-TERT Th1low/CD4+PD1+TIM3high (red) (log-rank test). Patients in the “blue” and “dark” groups are pooled in (f). g Schema of the relationship between anti-TERT Th1 immunity- exhausted PD-1+TIM-3+ CD4+ T cells and NSCLC progression

References

    1. Vesely MD, Kershaw MH, Schreiber RD, Smyth MJ. Natural innate and adaptive immunity to cancer. Annu. Rev. Immunol. 2011;29:71. doi: 10.1146/annurev-immunol-031210-101324. - DOI - PubMed
    1. Kim H-J, Cantor H. CD4 T-cell subsets and tumor immunity: the helpful and the not-so-helpful. Cancer Immunol. Res. 2014;2:91–98. doi: 10.1158/2326-6066.CIR-13-0216. - DOI - PubMed
    1. Zanetti M. Tapping CD4 T cells for cancer immunotherapy: the choice of personalized genomics. J. Immunol. 2015;194:2049–2056. doi: 10.4049/jimmunol.1402669. - DOI - PubMed
    1. Bevan MJ. Helping the CD8(+) T-cell response. Nat. Rev. Immunol. 2004;4:595–602. doi: 10.1038/nri1413. - DOI - PubMed
    1. Kennedy R, Celis E. Multiple roles for CD4+ T cells in anti-tumor immune responses. Immunol. Rev. r. 2008;222:44. - PubMed

Publication types