Review
. 2019 Aug;21(8):924-932.
doi: 10.1038/s41556-019-0362-x. Epub 2019 Jul 29.

Tracing the cellular dynamics of sebaceous gland development in normal and perturbed states

Affiliations
Review

Tracing the cellular dynamics of sebaceous gland development in normal and perturbed states

Marianne Stemann Andersen et al. Nat Cell Biol. 2019 Aug.

Abstract

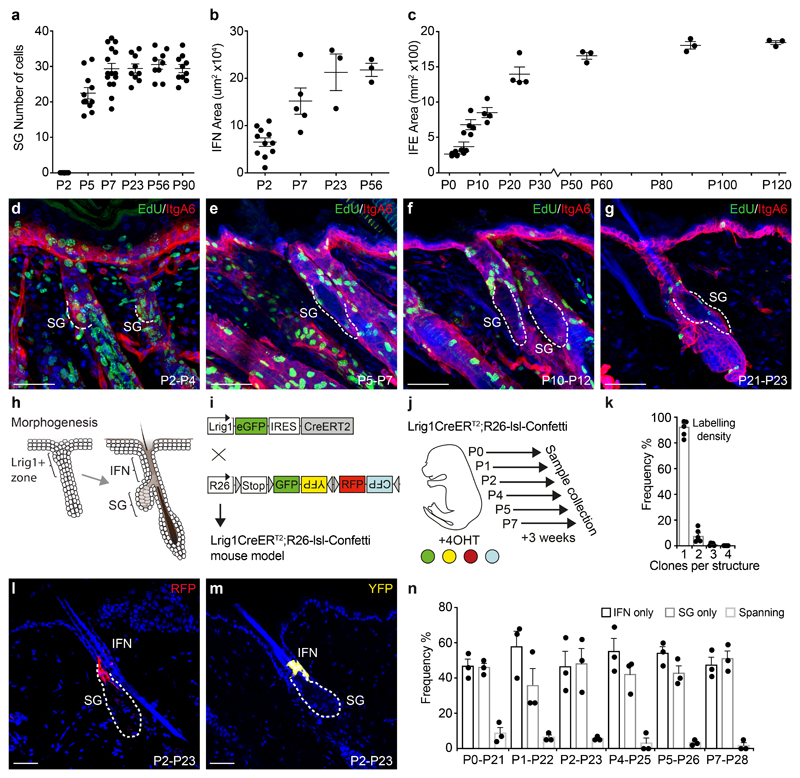
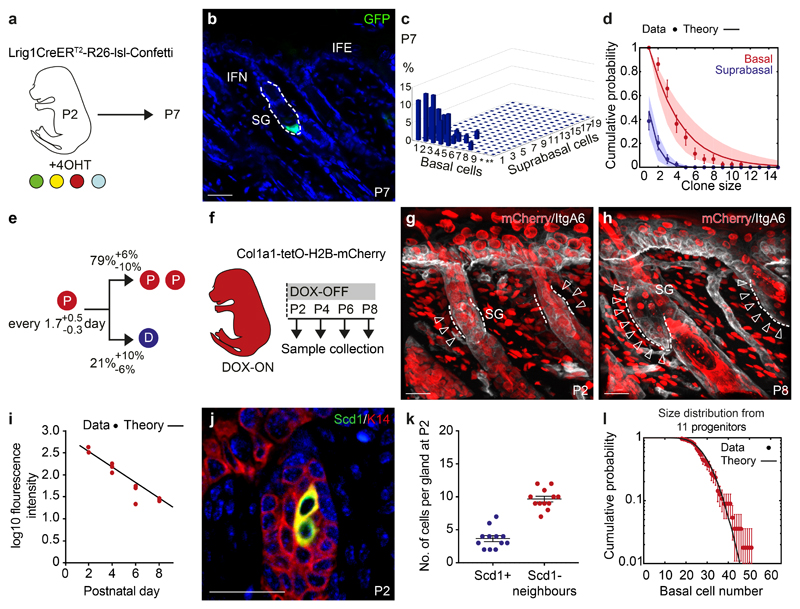
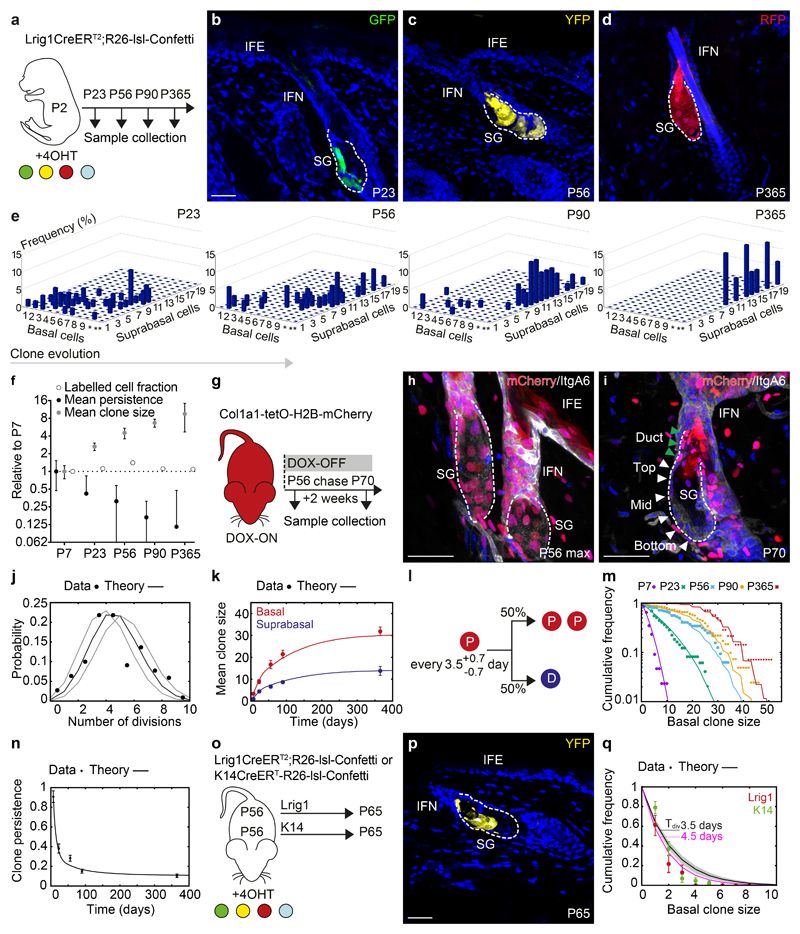
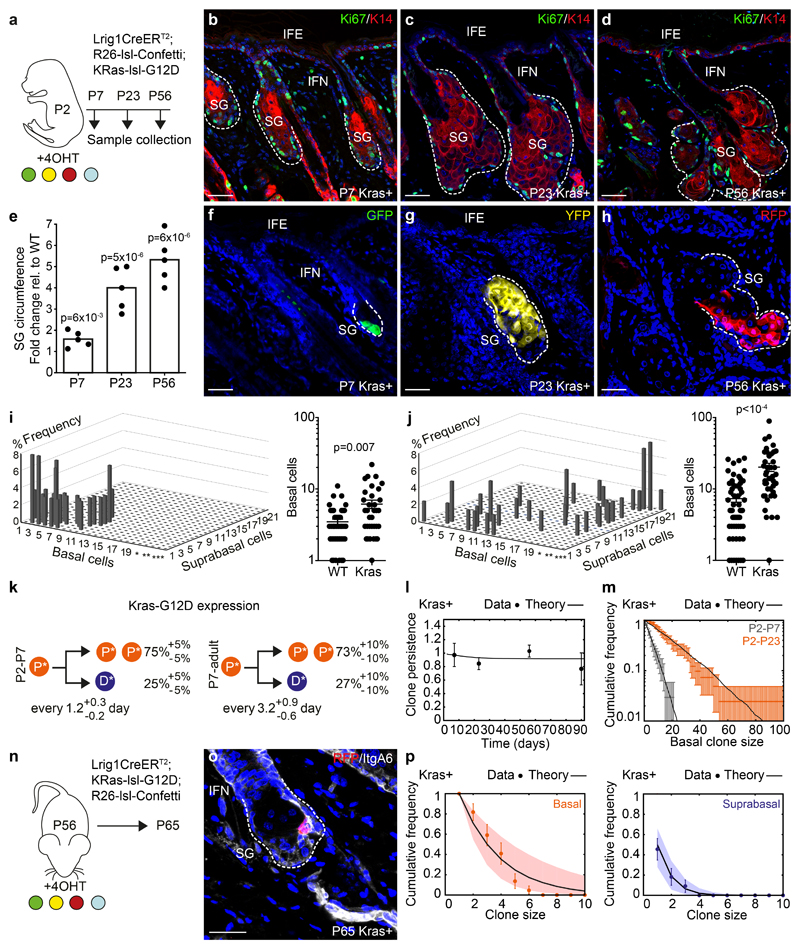
The sebaceous gland (SG) is an essential component of the skin, and SG dysfunction is debilitating1,2. Yet, the cellular bases for its origin, development and subsequent maintenance remain poorly understood. Here, we apply large-scale quantitative fate mapping to define the patterns of cell fate behaviour during SG development and maintenance. We show that the SG develops from a defined number of lineage-restricted progenitors that undergo a programme of independent and stochastic cell fate decisions. Following an expansion phase, equipotent progenitors transition into a phase of homeostatic turnover, which is correlated with changes in the mechanical properties of the stroma and spatial restrictions on gland size. Expression of the oncogene KrasG12D results in a release from these constraints and unbridled gland expansion. Quantitative clonal fate analysis reveals that, during this phase, the primary effect of the Kras oncogene is to drive a constant fate bias with little effect on cell division rates. These findings provide insight into the developmental programme of the SG, as well as the mechanisms that drive tumour progression and gland dysfunction.


Conflict of interest statement

Competing financial interests

The authors declare no competing financial interests.

Figures

Figure 1
Figure 1. Epidermal morphogenesis characterised by tissue-specific growth and rapid sebaceous gland formation.
(a) Individual SG sizes (cell numbers), at P2: n=7 glands, P5: n=11, P7: n=15, P23: n=9, P56: n=9, P90: n=10. Infundibulum (IFN) area at P2: n=11 follicles, P7: n=5, P23: n=3, P56: n=3. Data pooled from 3-5 animals/time point. Interfollicular epidermis (IFE) defined as total back skin area at P2: n=4 mice, P5: n=4, P7: n=4, P12: n=4, P23: n=4, P56: n=3, P90: n=3, P120: n=3. Data are means±S.E.M. (d-g) IntegrinA6 (ItgA6, red) and EdU (green) detected in rendered confocal z-stacks of back skin. Representative images reflect 48-hour EdU pulse chase experiments from day P2, P5, P10 or P21 (h) Schematic illustration of the premature and adult hair follicle with an Lrig1+ area indicating the prospective SG and IFN. (i) Strategy for reporter induction in Lrig1+ cells. (j) Induction of different cohorts to delineate SG morphogenesis. (k) Fraction of clones found in upper hair follicle structures (IFN or SG) at P7 following 4OHT induction at P2. Data are means±S.E.M. (n=5 animals). (l, m) Typical RFP (red) and YFP (yellow) clones detected in rendered confocal z-stacks of back skin following a 3-week chase (Images representative of 3 mice). (n) Clone location within the SG, IFN or both (spanning) following a 3-week trace from P0, P1, P2, P4, P5 or P7. Data are means±S.E.M (n=3 animals/group). Demarcated lines represent the boundary between dermis and epidermis at the site of the prospective and adult SG. Nuclei are counterstained with DAPI (blue). Scale bars, 50μm.
Figure 2
Figure 2. Lineage restriction and cellular dynamics of sebaceous gland morphogenesis
(a) Strategy for tissue collection at P7 following 4OHT administration at P2. (b) Detection of a representative GFP (green) clone at P7 in rendered confocal z stacks. (c) Frequency of individual clones scored in 3D composed of a given number of basal cells and subrabasal cells (d) Biophysical analysis based on an effective model with a single equipotent progenitor pool provides a good fit to the clonal fate data for both the basal (red) and suprabasal (blue) clone size distribution at P7. The model prediction is illustrated by a line and shaded areas represent the 95% confidence interval. Data are means±S.D. (c,d) n=44 clones from a total of five mice, *=10-19 and **=20-39 basal cells. (e) Biophysical modelling predicts the indicated probabilities for either the symmetrical division of a progenitor (P, red) or differentiation (D, blue) every 1.5 days. (f) Strategy for cell cycle analysis using Col1a1-tetO-H2BmCherry mouse model following a 2-week doxycycline (DOX) pulse and chase starting at P2. (g, h) H2BmCherry (red) and Integrin A6 (ItgA6, white) detected in rendered confocal z stacks in back skin at indicated time points. Arrows indicate label-diluted areas lining the Integrin alpha 6+ basal layer. Images representative of 3 animals. (i) Intensity of fluorescence in the basal compartment of individual SGs at indicated time points. Line represents fluorescent decay rate as predicted in (e). Lines indicate the medians. Demarcated lines represent the boundary between dermis and epidermis at the prospective or adult SG. n=3 animals per group with 17-26 glands counted per animal. (j) Detection of K14 (red) and Scd1 (green) in the upper hair follicle at P2. Images representative of 3 experiments. (k) Number of Scd1- cells surrounding Scd1+ cells. Data are means±S.E.M (n=12 SGs in 3 animals). (l) Experimental gland size distribution (number of basal cells, dots), and prediction (thick line) based on the independent behaviour of 11 SG precursors following the stochastic rules of panel (e) (n=44 clones in 5 mice. Data in graphs displayed as mean±S.E.M. Nuclei are counterstained with DAPI (blue). Scale bars, 50μm.
Figure 3
Figure 3. Neutral drift dynamics in the context of spatial restriction
(a) Strategy for clonal labelling of SG-precursors at P2 and tissue collection. (b-d) Representative clones in rendered confocal z-stacks. Images representative of 4-7 animals per timepoint. (e) Composition of clones analysed in 3D projections. Axis indicate clone frequency with a given number of basal and subrabasal cells *=10-19 and **=20-39 basal cells. (f) Labelled cell fraction, clone persistence and clone size (white, black, grey circles respectively) at indicated time points relative to P7. (e,f) P7: n=44 clones from 5 mice, P23: n=49 clones from 4 mice; P56: n=32 clones from 5 mice; P90: n=68 clones from 7 mice; P365: n=15 clones from 3 mice. (g) Strategy for cell cycle analysis using the Col1a1-tetO-H2BmCherry mouse model. (h, i) Detection of H2BmCherry at indicated time points following DOX removal. White and green arrowheads indicate cells in basal layer and SG duct. Images representative of 3 animals. (j) Experimental probability distribution of cell divisions within a 2-week period and stochastic theory based on a fitted proliferation time of 3.5 days (black line) ±0.5 (grey lines, 95% confidence interval). 204 measurements in n=3 animals (k) Biophysical modelling of mean clone size fits the evolution of both basal (red) and suprabasal (blue) compartments. n-numbers as in (e-f) (l) Model-prediction of fate probabilities for equipotent progenitors in the adult SG. P and D refer to progenitor (basal) and differentiated (suprabasal) cells. (m) Experimental basal clone size distributions (dots, same dataset as (b-f) vs. theoretical distribution (lines, using parameters shown in (l)) at all timepoints. (n) Experimental (dots) vs. theoretical (lines, using parameters in (l)) clone persistence in the SG. n-numbers as in (e-f). (o) Strategy for clonal labelling in adulthood using Lrig1CreERT2 and K14CreERT mouse models. (p) Typical clone from Lrig1CreERT2. Image representative of 3 animals. (q) Basal clone size distribution for Lrig1CreERT2 (red) and K14CreERT (green) derived clones (mean±S.D., n=3 mice/group). Black line = model-prediction from panel (l). Best-fit value of 3.5d: line, shaded area: 95% confidence interval. Best-fit division rate (4.5d)=pink line. Data are mean±S.E.M. Nuclei stained with DAPI. Scale bars, 50μm.
Figure 4
Figure 4. Dynamic extracellular matrix remodelling and sebaceous gland development
(a) Principal component analysis of RNA-seq samples from morphogenesis and homeostasis. (b) Heatmap of differentially expressed genes (Log2fold change > 0.5; FDR < 0.05 based on Benjamini-Hochberg multiple correction method following a Wald test for statistical significance), comparing the expression profile of epithelial SG progenitors isolated from P4 to that of P10 and P30. (c-d) GO-term enrichment analysis highlighting the biological processes enriched in the P4 samples compared to P10 and P30 time points. (a-d) The overrepresentation test was performed using a Benjamini-Hochberg False Discovery Rate for multiple correction following a Fisher exact test for statistical significance. (e, f) Detection of fibronectin and (g, h) PDGFRa during morphogenesis (P2) and homeostasis (P23). (i-l) Sirius red staining of back skin sections for collagen deposition in brightfield (i, j) and fibrillisation visualized using polarized light (k, l) during morphogenesis and homeostasis (a-l) 3 mice were analysed for each time point. (m) Quantification of progressive fibrillisation at the indicated time points using the thresholded area method in ImageJ software on histological Sirius red stained sections (P4: n=21, P10: n=10, P30: n=14 individual measurements pooled from 3 animals per timepoint. Axis indicates the percentage of a given area positive for fibrillar collagen visualized in polarized contrast illumination. Data displayed as a scattered dot plot with line indicating means±S.D. (n) Atomic force microscopy measurement of stroma Elastic modulus in areas surrounding the SG using a spherical probe at time points indicated shown as fold change when compared to P30. Data displayed as a scattered dot plot with line indicating median with interquartile range. Number of individual measurements P4: n=103, P10: n=115, P30: n=395 pooled from 3 individual mice per timepoint. (m, n) Significance was estimated based on a Kruskal-Wallis test. Nuclei are counterstained with DAPI (blue). Scale bars are 100 μm.
Figure 5
Figure 5. Cellular dynamics under reduced spatial constraints
(a) Strategy for clonal labelling of precursors with KrasG12D mutation. (b-d) Detection of Ki67 (green) and K14 (red) at indicated timepoints (Images representative of 3 animals/timepoint). (e) Relative SG size as fold change between WT and KrasG12D-mutants. Kras-n=5 glands/timepoint (from 2 animals), WT-n=8 glands/timepoint (P7, P23) and 6 glands (P56)/timepoint (from 3 animals). Statistical significance was assessed using a two-tailed unpaired Student’s t-test (f-h) Detection of typical clones in rendered confocal z-stacks. Images representative of 3 animals/timepoint. (i, j) Left plots: clone-compositions at P7 and P23 in KrasG12D mutants. Here, Y-axis indicate clone frequency, x-axis basal cells and z-axis number of subrabasal cells. *=21-40, **=41-60 and ***=61-100 basal cells. P7-n=34 clones from 3 animals; P23-n=41 clones from 4 animals. Right plots display basal footprint of same KrasG12D clones but compared to WT clones. WT: P7-n=44 clones in 3 animals, P23-n=49 clones from 4 mice. (k) Cell fate probabilities (from l-p) of progenitors between P2-P7 and after P7 in KrasG12D-mutants (*). P: basal progenitors and D: suprabasal differentiated cells. (l) Experimental vs theoretical (line, from parameters in (k) clone persistence (P7: n=426 follicles in 7 animals; P23: n=253 follicles in 4 animals; P56: n=253 follicles in 5 animals; P90: n=160 follicles in 3 animals). (m) Basal clone size distribution at P7 (grey) and P23 (orange) (n as in i, j). Lines represent the best-fit prediction (used to extract P2-P7 parameters in (k)). Data displayed as means±S.D. (n) Strategy for clonal labelling during adulthood in KrasG12D-mutants. (o) Representative clones (RFP) and integrinA6 (grey) in rendered z-stacks in SG with activated KrasG12D. Image representative of 3 animals. (p) Clone size distributions according to basal (red) and suprabasal (blue) cells in KrasG12D-mutants are well-fit by a single exponential, consistent once again with a single equipotent progenitor population. Lines represent the best-fit prediction (used to extract P7-adult parameters in (k), while dots represent the average. (o-p) n=23 clones/3 animals; WT data from Figure 3o). Statistical significance was assessed using a non-paired Mann-Whitney test. Data in graphs displayed as mean±S.E.M. Nuclei stained with DAPI. Scale bars, 50μm.

References

    1. Zouboulis CC, et al. Beyond acne: Current aspects of sebaceous gland biology and function. Rev Endocr Metab Disord. 2016;17:319–334. - PubMed
    1. Ehrmann C, Schneider MR. Genetically modified laboratory mice with sebaceous glands abnormalities. Cell Mol Life Sci. 2016;73:4623–4642. - PMC - PubMed
    1. Paus R, et al. A comprehensive guide for the recognition and classification of distinct stages of hair follicle morphogenesis. J Invest Dermatol. 1999;113:523–532. - PubMed
    1. Fuchs E. Skin stem cells: rising to the surface. J Cell Biol. 2008;180:273–284. - PMC - PubMed
    1. Page ME, Lombard P, Ng F, Gottgens B, Jensen KB. The epidermis comprises autonomous compartments maintained by distinct stem cell populations. Cell stem cell. 2013;13:471–482. - PMC - PubMed

Publication types

MeSH terms