Comparative Study
. 2019 Sep;3(9):940-949.
doi: 10.1038/s41562-019-0651-1. Epub 2019 Jul 29.

Asymmetrical genetic attributions for prosocial versus antisocial behaviour

Affiliations
Comparative Study

Asymmetrical genetic attributions for prosocial versus antisocial behaviour

Matthew S Lebowitz et al. Nat Hum Behav. 2019 Sep.

Abstract

Genetic explanations of human behaviour are increasingly common. While genetic attributions for behaviour are often considered relevant for assessing blameworthiness, it has not yet been established whether judgements about blameworthiness can themselves impact genetic attributions. Across six studies, participants read about individuals engaging in prosocial or antisocial behaviour, and rated the extent to which they believed that genetics played a role in causing the behaviour. Antisocial behaviour was consistently rated as less genetically influenced than prosocial behaviour. This was true regardless of whether genetic explanations were explicitly provided or refuted. Mediation analyses suggested that this asymmetry may stem from people's motivating desire to hold wrongdoers responsible for their actions. These findings suggest that those who seek to study or make use of genetic explanations' influence on evaluations of, for example, antisocial behaviour should consider whether such explanations are accepted in the first place, given the possibility of motivated causal reasoning.


Conflict of interest statement

Competing interests statement: The authors declare no competing interests.

Figures

Fig. 1.
Fig. 1.
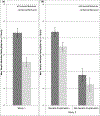
Mean genetic attribution ratings in Study 1 (panel a) and Study 2 (panel b), collapsed across vignettes. After reading two vignettes about either prosocial or antisocial behavior, participants rated how much of a role they believed genetics had played in causing it, on a scale from “1 (No role or a very minor role)” to “7 (A very major role).” Genetic attribution ratings were higher for prosocial behavior than for antisocial behavior in both Study 1, N=251, F(1, 249)=19.47, p<.001, d=.56, 95% CI = [.37, .75], and Study 2, N=250, F(1, 246)=4.48, p=.035, d=.25, 95% CI = [.07, .43]. In Study 2, this was true regardless of whether or not participants were given a genetic explanation for the behavior they read about. Error bars represent +/− 1 SE.
Fig. 2.
Fig. 2.
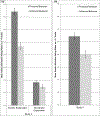
Mean genetic attribution ratings in Study 3 (panel a; divided by explanation) and Study 4 (panel b), collapsed across vignettes. After reading one of six vignettes about either prosocial or antisocial behavior, participants rated how much of a role they believed genetics had played in causing the behavior, on a scale from “1 (No role or a very minor role)” to “7 (A very major role).” Genetic attribution ratings were higher for prosocial behavior than for antisocial behavior in both Study 3, N=609, F(1, 585)=5.71, p=.017, d=.14, 95% CI = [−.01, .29], and Study 4, N=608, F(1, 596)=31.02, p<.001, d=.45, 95% CI = [.33, .58]. In Study 3, this was true regardless of whether or not participants were given a genetic explanation for the behavior they read about. Error bars represent +/− 1 SE.
Fig. 3.
Fig. 3.
Bootstrap mediation analyses in Study 4. After reading one of six vignettes describing a woman named Jane engaging in either prosocial or antisocial behavior, participants rated how much of a role they believed genetics had played in causing Jane’s behavior, on a scale from “1 (No role or a very minor role)” to “7 (A very major role).” They also rated how responsible they considered Jane to be for her behavior and provide a “true self” rating of the extent to which Jane’s behavior reflected “who she truly is” — both rated on a scale from “1 (Not at all)” to “7 (Very Much).” Mediation models were tested using the PROCESS procedure (version 3.2) for SPSS with 5,000 bootstrap samples. There was a significant indirect effect of condition on genetic attributions through responsibility ratings, but the indirect effect through “true self” ratings was not significant. Regression coefficients are unstandardized.
Fig. 4.
Fig. 4.
Image used in the genetic explanation in Study 3. When Study 3 participants read about either prosocial or antisocial behavior, some were randomly assigned to be given a genetic explanation for the behavior. This explanation, designed to be more forceful and compelling than the text-only one used in Study 2, stated, “Scientists have found that people can have genes that lead them to behave this way. Here is a graphic that illustrates the area of the genome where these genes are found.” This image, which actually shows polymorphic simple sequence repeat markers from several individuals (with alleles for one marker from one individual circled in red), was then displayed. Reproduced with permission from Oxford University Press [Ref 18].

Similar articles

Cited by

References

    1. Dar-Nimrod I & Heine SJ Genetic essentialism: On the deceptive determinism of DNA. Psychological Bulletin 137, 800–818, doi:10.1037/a0021860 (2011). - DOI - PMC - PubMed
    1. Tabb K, Lebowitz MS & Appelbaum PS Behavioral Genetics and Attributions of Moral Responsibility. Behavior Genetics 49, 128–135, doi:10.1007/s10519-018-9916-0 (2019). - DOI - PMC - PubMed
    1. Kvaale EP, Haslam N & Gottdiener WH The ‘side effects’ of medicalization: a meta-analytic review of how biogenetic explanations affect stigma. Clinical Psychology Review 33, 782–794, doi:10.1016/j.cpr.2013.06.002 (2013). - DOI - PubMed
    1. Haslam N & Kvaale EP Biogenetic explanations of mental disorder: The mixed-blessings model. Current Directions in Psychological Science 24, 399–404 (2015).
    1. Hoyt CL, Burnette JL, Auster-Gussman L, Blodorn A & Major B The obesity stigma asymmetry model: The indirect and divergent effects of blame and changeability beliefs on antifat prejudice. Stigma and Health 2, 53–65 (2017).

Publication types