. 2019 Sep;20(9):1231-1243.
doi: 10.1038/s41590-019-0441-y. Epub 2019 Jul 29.

PD-1 blockade in subprimed CD8 cells induces dysfunctional PD-1+CD38hi cells and anti-PD-1 resistance

Affiliations

PD-1 blockade in subprimed CD8 cells induces dysfunctional PD-1+CD38hi cells and anti-PD-1 resistance

Vivek Verma et al. Nat Immunol. 2019 Sep.

Erratum in

Abstract

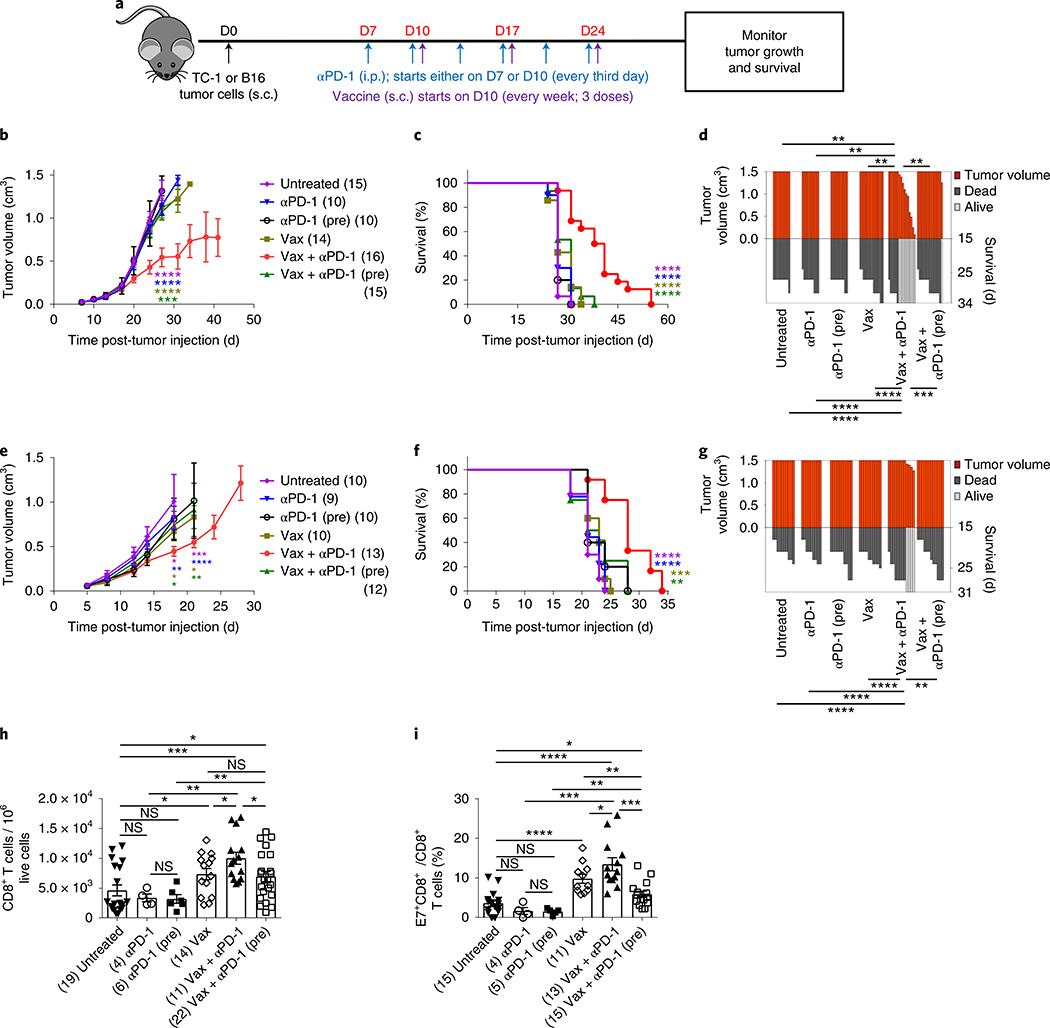
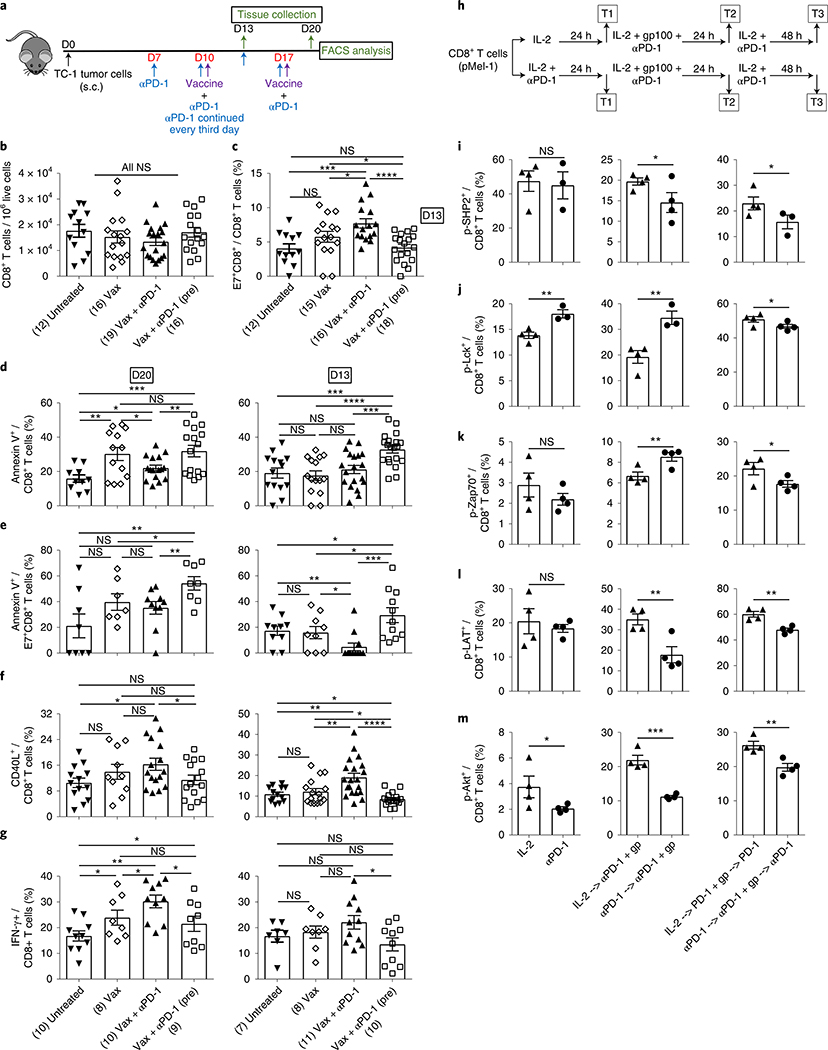
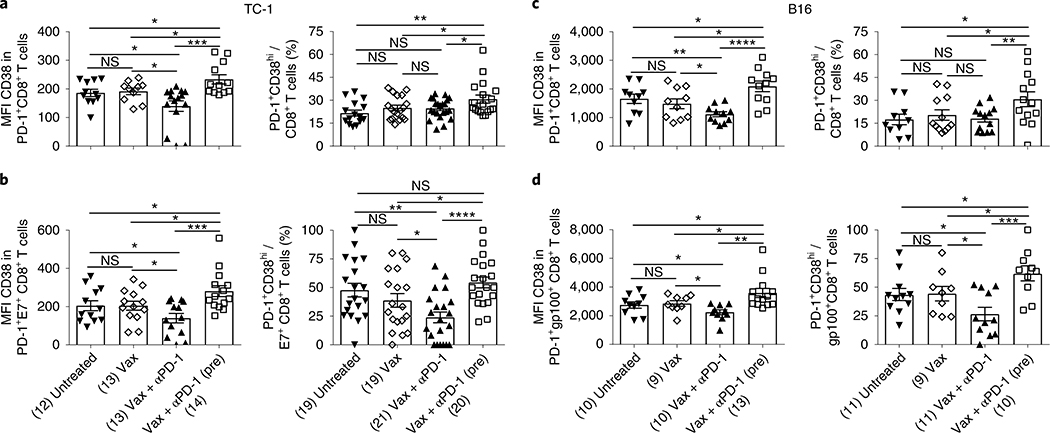
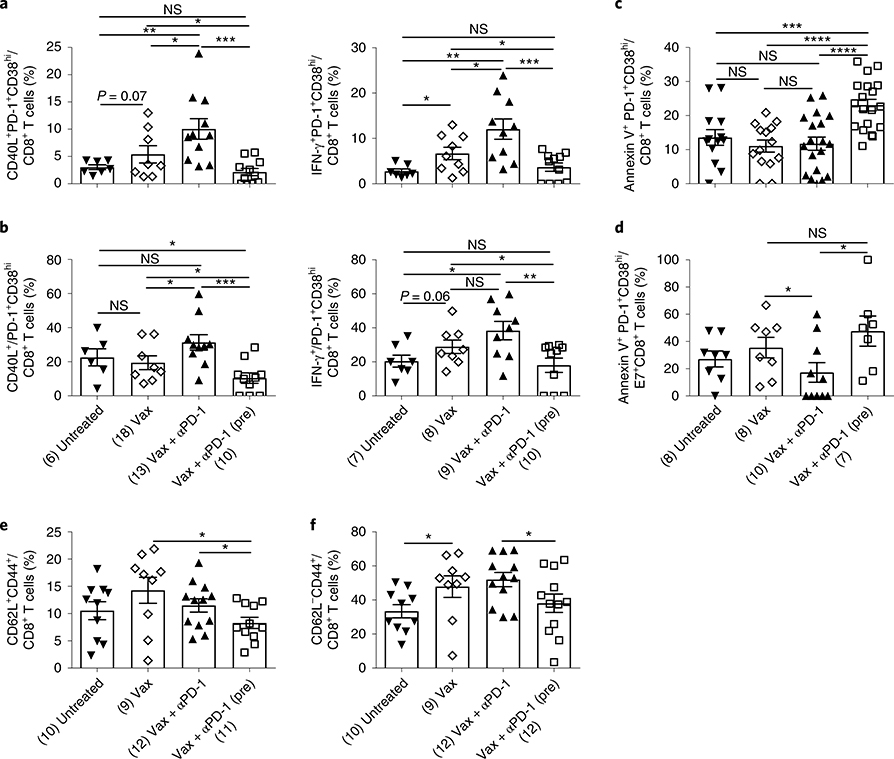
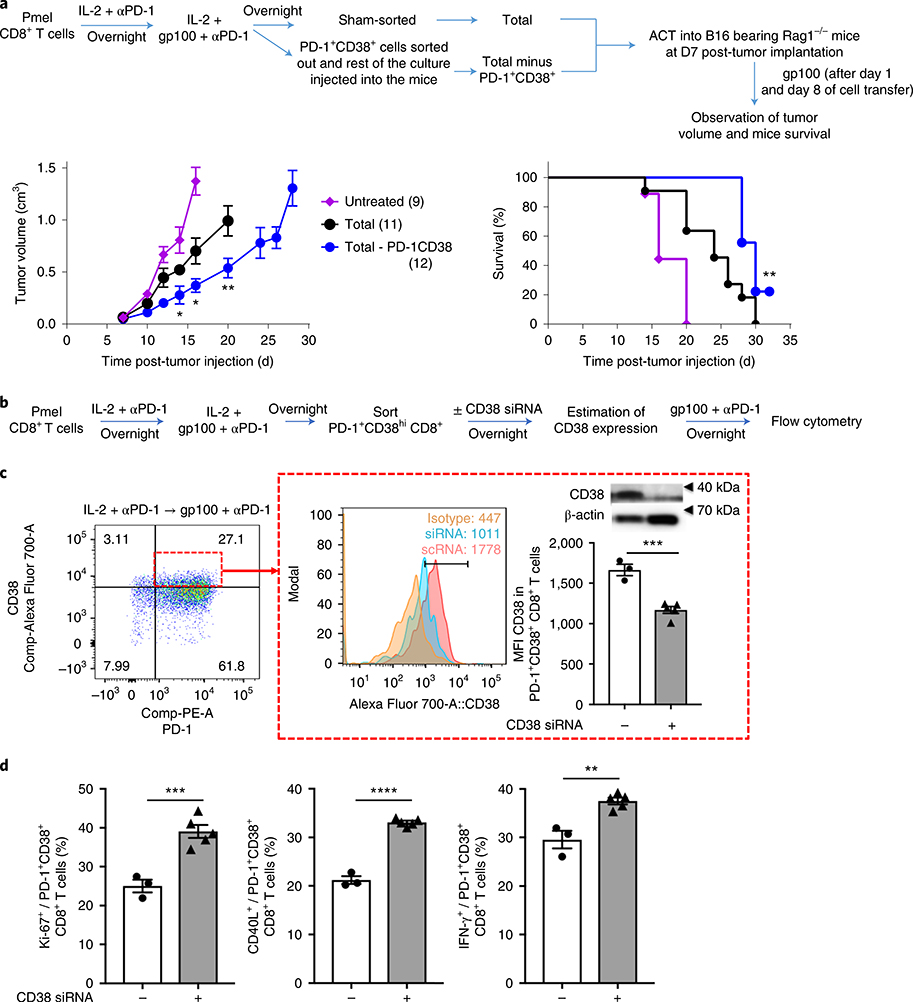
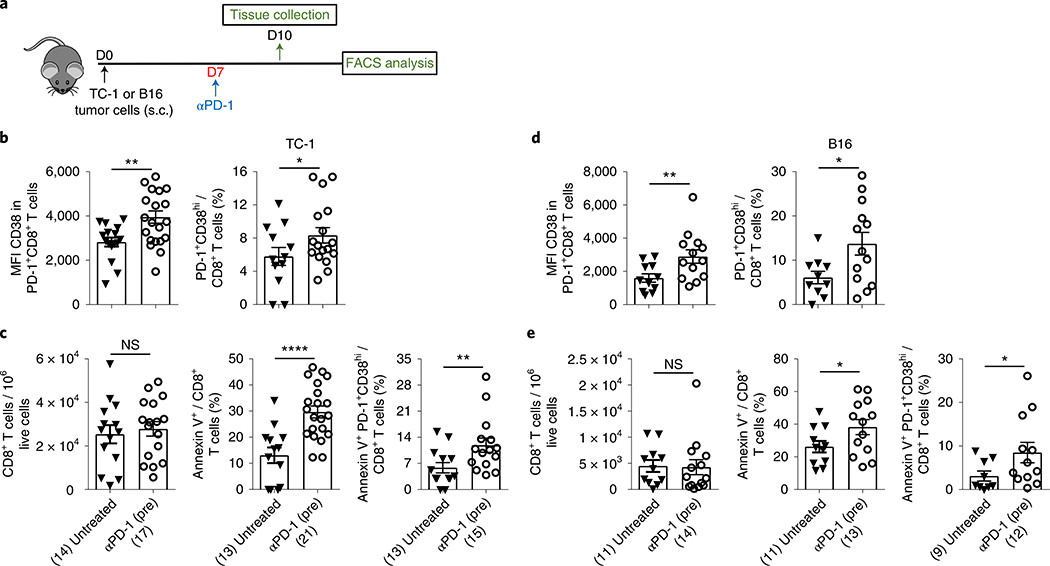
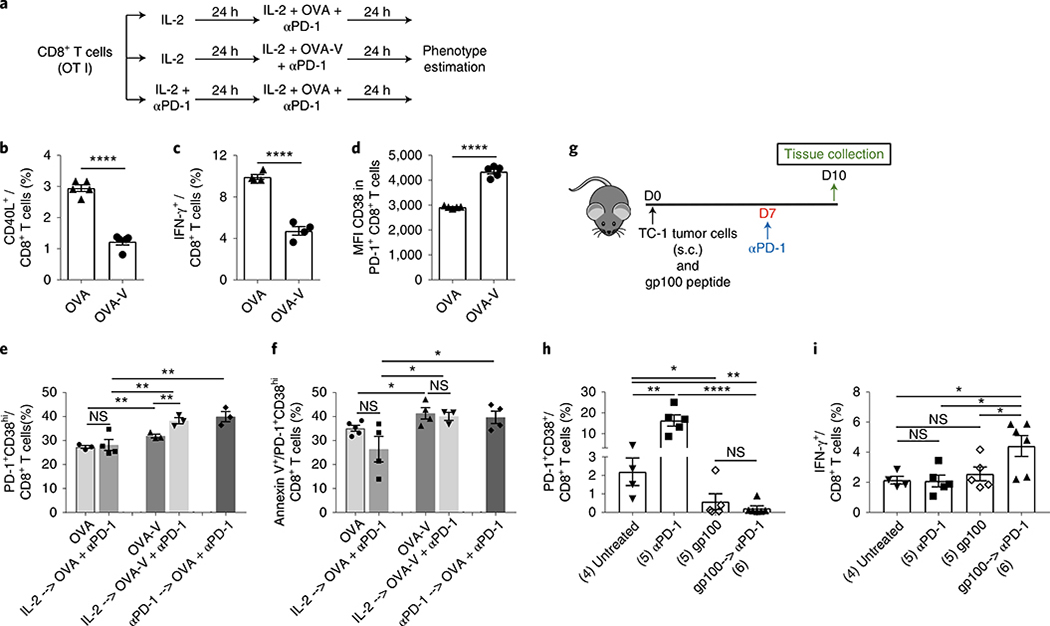
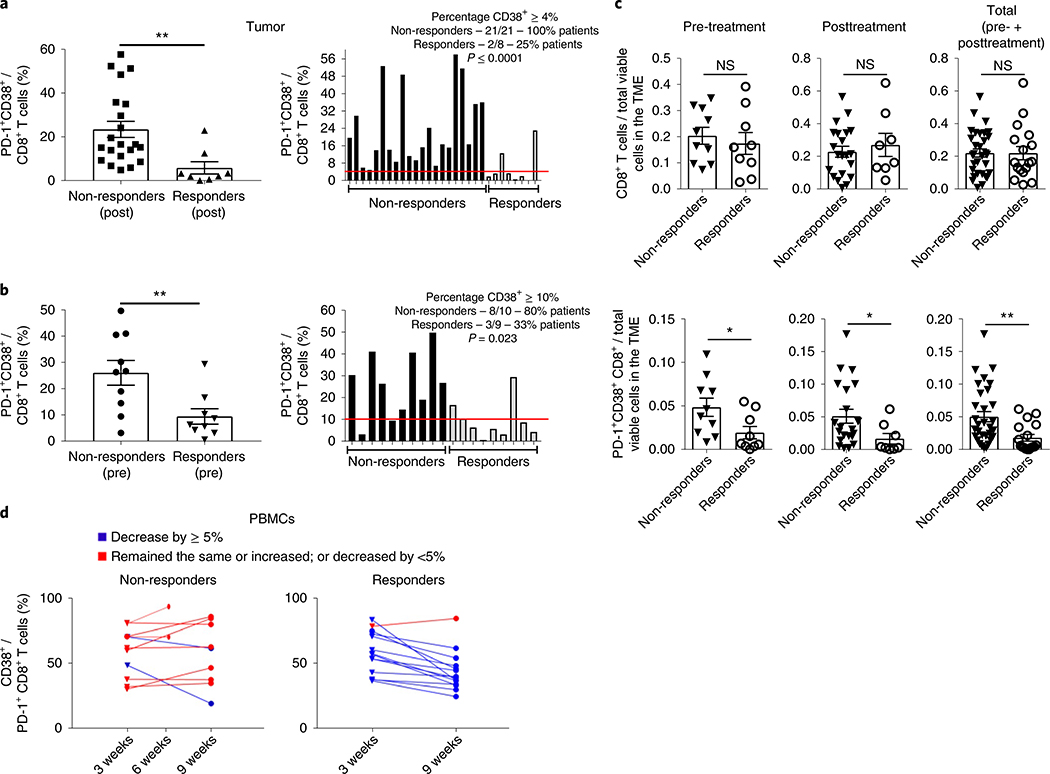
Understanding resistance to antibody to programmed cell death protein 1 (PD-1; anti-PD-1) is crucial for the development of reversal strategies. In anti-PD-1-resistant models, simultaneous anti-PD-1 and vaccine therapy reversed resistance, while PD-1 blockade before antigen priming abolished therapeutic outcomes. This was due to induction of dysfunctional PD-1+CD38hi CD8+ cells by PD-1 blockade in suboptimally primed CD8 cell conditions induced by tumors. This results in erroneous T cell receptor signaling and unresponsiveness to antigenic restimulation. On the other hand, PD-1 blockade of optimally primed CD8 cells prevented the induction of dysfunctional CD8 cells, reversing resistance. Depleting PD-1+CD38hi CD8+ cells enhanced therapeutic outcomes. Furthermore, non-responding patients showed more PD-1+CD38+CD8+ cells in tumor and blood than responders. In conclusion, the status of CD8+ T cell priming is a major contributor to anti-PD-1 therapeutic resistance. PD-1 blockade in unprimed or suboptimally primed CD8 cells induces resistance through the induction of PD-1+CD38hi CD8+ cells that is reversed by optimal priming. PD-1+CD38hi CD8+ cells serve as a predictive and therapeutic biomarker for anti-PD-1 treatment. Sequencing of anti-PD-1 and vaccine is crucial for successful therapy.


Figures

Fig. 1 |
Fig. 1 |. Anti-PD-1 before antigenic stimulation abrogates the antitumor effects of Vax + αPD-1.
a, Schedule of mouse treatments. bg, Tumor growth profiles (b,e), mouse survival (c,f) and SK plots (d,g) after various treatments in TC-1 (bd) and B16 (eg) tumor models. Tumor growth and survival data are the average of two independent experiments with the indicated numbers of mice per group. The error bars indicate the s.e.m. For tumor growth, statistical analysis was performed by unpaired, one-tailed Student’s t-test, with the asterisks colored to indicate the comparison: purple, comparison to untreated; blue, comparison to anti-PD-1; brown, comparison to Vax; green, comparison to Vax + anti-PD-1 (pre). Individual P values (for the same order of comparisons) are as follows: ***P = 0.001, ****P ≤ 0.0001 (b). **P = 0.0078, **P = 0.0078, **P = 0.0022 and **P = 0.0016 (day (D) 34) (d). *P = 0.0244, **P = 0.0037, *P = 0.0313 and *P = 0.0451 (day 18); ***P = 0.0001, ****P ≤ 0.0001, *P = 0.0262 and **P = 0.0086 (day 21) (e). Survival in various groups was compared using log-rank (Mantel–Cox) tests. Individual P values (for the same order of comparisons except where indicated) are as follows: ****P ≤ 0.0001 (all comparisons) (c); ****P ≤ 0.0001, ****P ≤ 0.0001, ****P ≤ 0.0001, ***P = 0.0003 (day 34) (d); ****P ≤ 0.0001, ****P ≤ 0.0001, ***P = 0.0002, **P = 0.0027 (f); ****P ≤ 0.0001, ****P ≤ 0.0001, ***P = 0.0002, **P = 0.0027 (day 31) (g). h,i, Profiles of total CD8+ (h) and antigen-specific CD8+ T cells (i) in the TME of TC-1-bearing mice after various treatments, 3 d after the second vaccination (D20). Flow cytometry data are the average from two independent experiments. Each dot corresponds to one mouse with the indicated number of mice per group given in parentheses. The error bars indicate the s.e.m. Statistical analysis was performed by unpaired, one-tailed Student’s t-test. Individual P values are as follows: *P = 0.0255 (left), *P = 0.0322 (middle), *P = 0.0146 (right), *P = 0.0365 (upper), **P = 0.0018 (lower), **P = 0.01 (upper), ***P = 0.0002 (h). *P = 0.0059 (lower), *P = 0.0273 (upper), **P = 0.0035 (lower), **P = 0.0039 (upper), ***P = 0.0008 (left), ***P = 0.0001 (right), ****P ≤ 0.0001 (i). NS, not significant; *P ≤ 0.05; **P ≤ 0.01; ***P ≤ 0.001; ****P ≤ 0.0001.
Fig. 2 |
Fig. 2 |. Prior PD-1 blockade abrogates vaccine-induced tumor-specific immune responses early during the course of treatment.
a, Schedule of mouse treatments. Tumor tissues were collected 3 d after priming (day 13) or 3 d after boosting (day 20). b,c, Numbers of total (b) and antigen-specific CD8+ T (c) cells at day 13. d,e, Frequencies of annexin V+ total (d) and antigen-specific CD8+ T (e) cells in the TME at days 20 and 13, as shown. f,g, Frequencies of CD40L+ (f) and IFN-γ+ (g) CD8+ T cells in the TME at days 20 and 13 as shown. Flow cytometry data are the average from two independent experiments. Each dot corresponds to one mouse with the indicated number of mice per group given in parentheses. The error bars indicate the s.e.m. For statistical comparison, an unpaired, one-tailed Student’s t-test was used. NS (b); *P = 0.0344 (lower), *P = 0.0448 (upper), ***P = 0.0005, ****P ≤ 0.0001 (c); *P = 0.0229 (lower), *P = 0.0179 (upper), **P = 0.0033 (left), **P = 0.0068 (right), ***P = 0.001 (left panel); ***P = 0.0004 (lower), ***P = 0.0002 (upper), ****P ≤ 0.0001 (right panel) (d); *P = 0.0498, **P = 0.009 (lower), **P = 0.0038 (upper) (left panel); *P = 0.0254 (lower), *P = 0.0479 (middle), *P = 0.0496 (top), **P = 0.0067, ***P = 0.0004 (right panel) (e); *P = 0.0138 (left), *P = 0.0274 (right) (left panel); *P = 0.0187 (lower), *P = 0.0339 (upper), **P = 0.0063 (lower), **P = 0.002 (upper), ****P ≤ 0.0001 (right panel) (f); *P = 0.0264 (left), *P = 0.05 (middle), *P = 0.0177(right), *P = 0.05 (top), ***P = 0.0002 (left panel); *P = 0.015 (right panel) (g). h, Experimental outline for Pmel-1 CD8+ T cell treatment. T1, T2 and T3 refer to various time points during the course of treatment when samples were picked for analysis. im. Flow cytometry analysis of phosphorylated SHP2+ (i), Lck+ (j), Zap70+ (k), LAT+ (l) and Akt+ (m) CD8+ T cells at three time points. Data are representative of two independent experiments with at least 3–4 technical replicates per group. The error bars indicate the s.e.m. For comparisons, an unpaired, one-tailed Student’s t-test was used. T1: NS; T2: *P = 0.0466; T3: *P = 0.05 (i); T1: **P = 0.0042; T2: **P = 0.0043; T3: *P = 0.0457 (j); T1: NS; T2: **P = 0.0086; T3: *P = 0.0363 (k); T1: NS; T2: **P = 0.0054; T3: **P = 0.0017 (l); T1: *P = 0.048; T2: ***P = 0.0002; T3: **P = 0.0034 (m). *P ≤ 0.05; **P ≤ 0.01; ***P ≤ 0.001; ****P ≤ 0.0001.
Fig. 3 |
Fig. 3 |. PD-1 blockade before antigenic stimulation induces PD-1+CD38hi CD8+ T cells.
ad, MFI and frequency of PD-1+CD38hi T cells in total (a,c) and antigen-specific (b,d) CD8+ T cells in TC-1 (a,b) and B16 (c,d) tumor-bearing mice at day 13 post-tumor implantation. Data are the average of two independent experiments. Each dot corresponds to one mouse with the indicated number of mice per group given in parentheses. The error bars indicate the s.e.m. For statistical comparison, an unpaired, one-tailed Student’s t-test was used. NS; versus untreated: *P = 0.0339 (lower) and *P = 0.0164 (upper); versus Vax: *P = 0.0233 (lower) and *P = 0.0269 (upper), ***P = 0.0005 (left panel); *P = 0.0201 (lower), *P = 0.0416 (upper), **P = 0.006 (right panel) (a); versus untreated: *P = 0.0416 (lower) and *P = 0.0316 (upper); versus Vax: *P = 0.0342 (lower) and *P = 0.0261 (upper), ***P = 0.0005 (left panel); *P = 0.028 (lower), *P = 0.0221 (upper), **P = 0.0015, ****P ≤ 0.0001 (right panel) (b); *P = 0.032 (lower), *P = 0.0137 (middle), *P = 0.0482 (upper), **P = 0.0037, ****P ≤ 0.0001 (left panel); *P = 0.0498 (lower), *P = 0.0241 (upper), **P = 0.01 (right panel) (c); versus untreated: *P = 0.0478 (lower) and *P = 0.0273 (upper); versus Vax: *P = 0.0168 (lower) and *P = 0.0464 (upper), **P = 0.0014 (left panel); versus untreated: *P = 0.0213 (lower) and *P = 0.0202 (upper); versus Vax: *P = 0.0272 (lower) and * P = 0.035 (upper), ***P = 0.0003 (right panel) (d). *P ≤ 0.05; **P ≤ 0.01; ***P ≤ 0.001; ****P ≤ 0.0001.
Fig. 4 |
Fig. 4 |. PD-1+CD38hi CD8+ T cells induced as a result of anti-PD-1 pretreatment are dysfunctional.
a,b, Frequency of CD40L+ or IFN-γ+ PD-1+CD38hi cells in total CD8+ T cells (a) and in the PD-1+CD38hi CD8+ T cell population (b). c,d, Frequencies of annexin V+ PD-1+CD38hi cells in total (c) and antigen-specific (d) CD8+ T cells. e,f, Frequencies of CD62L+CD44+ (e) and CD62LCD44+ (f) CD8+ T cells after various treatments as shown. Data at day 13 (ad) and day 20 (e,f) post-TC-1 tumor implantation. Data are representative of two independent experiments. Each dot corresponds to one mouse with the indicated number of mice per group given in parentheses. The error bars indicate the s.e.m. For comparison purposes, an unpaired, one-tailed Student’s t-test was used. *P = 0.0462 (lower), *P = 0.0258 (upper), **P = 0.0052, ***P = 0.0004 (left panel); *P = 0.0148 (lower), *P = 0.0309 (middle), *P = 0.0382 (upper), **P = 0.002, ***P = 0.001 (right panel) (a); *P = 0.0372 (lower), *P = 0.0449 (middle), *P = 0.0225 (upper), ***P = 0.0006 (left panel); *P = 0.0104 (lower), *P = 0.0421 (upper), **P = 0.004 (right panel) (b); ***P = 0.001, ****P ≤ 0.0001 (c); *P = 0.05 (lower), *P = 0.0146 (upper) (d); *P = 0.0299 (lower), *P = 0.012 (upper) (e); *P = 0.0318 (left), *P = 0.0271 (f) (right). *P ≤ 0.05; **P ≤ 0.01; ***P ≤ 0.001; ****P ≤ 0.0001.
Fig. 5 |
Fig. 5 |. Depletion of PD-1+CD38hi CD8+ T cells results in a strong antitumor response.
a, Tumor growth and survival of variously treated B16-bearing Rag1−/− mice following transfer of either total or PD-1+CD38+-depleted, in vitro-activated CD8+ T cells (with the indicated number of mice per group given in parentheses); data are the average of two independent experiments. The error bars indicate the s.e.m. Left panel: for comparison purposes, an unpaired, one-tailed Student’s t-test was used; *P = 0.017 (day 14), *P = 0.0127 (day 16), **P = 0.0074 (day 20). Right panel: survival in various groups was compared using the log-rank (Mantel–Cox) test; **P = 0.0054. b, Experimental outline for Pmel-1 CD8+ T cell treatment. c, MFI and protein expression of CD38 in PD-1+CD8+ T cells (shown in the small red box on the left). The protein expression of CD38 in flow-sorted PD-1+CD38+ T cells transfected with CD38 siRNA or scrambled RNA (scRNA) was determined by immunoblot. The expression of β-actin was used as a loading control (the uncropped full scan of the blot is shown in Supplementary Fig. 5b). d, Frequency of Ki-67+, CD40L+ and IFN-γ+ in the PD-1+CD38+ CD8+ T cell population. Data are representative of two independent experiments with at least 3–5 technical replicates per group. The error bars indicate the s.e.m. For comparison purposes, an unpaired, one-tailed Student’s t-test was used. ***P = 0.0003 (c); ***P = 0.0007 (left panel); ****P ≤ 0.0001 (middle panel); **P = 0.0012 (right panel) (d). *P ≤ 0.05; **P ≤ 0.01; ***P ≤ 0.001; ****P ≤ 0.0001.
Fig. 6 |
Fig. 6 |. PD-1 blockade without proper priming predisposes CD8+ T cells toward dysfunction and apoptosis-mediated cell death.
a, Schedule of mouse treatment. be, Estimation of CD38 MFI and frequency of PD-1+CD38hi CD8+ T cells (b,d) and frequency of total CD8+, Annexin V+ CD8+ and Annexin V+ PD-1+CD38hi CD8+ T cells (c,e) in variously treated TC-1 (b,c) and B16 (d,e) tumor-bearing mice. Day 10 data after tumor implantation; data are the average of two independent experiments. Each dot corresponds to one mouse with the indicated number of mice per group given in parentheses. The error bars indicate the s.e.m. For comparison purposes, an unpaired, one-tailed Student’s t-test was used. *P = 0.0201 (left panel), *P = 0.0435 (right panel) (b); NS (left panel); ****P ≤ 0.0001 (middle panel); **P = 0.0096 (right panel) (c); **P = 0.0083 (left panel), *P = 0.0129 (right panel) (d); NS (left panel), *P = 0.0291 (middle panel), *P = 0.0392 (right panel) (e). *P ≤ 0.05; **P ≤ 0.01; ***P ≤ 0.001; ****P ≤ 0.0001.
Fig. 7 |
Fig. 7 |. PD-1 blockade in suboptimally primed CD8+ T cells induces dysfunctional PD-1+CD38hi CD8+ T cells.
a, Treatment schedule for in vitro activation of OT I CD8+ T cells with OVA or OVA-V as indicated. b,c, Frequency of CD40L+ (b) and IFN-γ+ (c) CD8+ T cells after various treatments. d, MFI of CD38 in PD-1+ CD8+ T cells. e, Frequency of PD-1+CD38hi cells in CD8+ T cells after various treatments. f, Frequency of annexin V+ cells in PD-1+CD38hi CD8+ T cells after various treatments. In vitro data are representative of two independent experiments with at least four technical replicates. g, Schedule of mouse treatment. h,i, Frequency of PD-1+CD38hi (h) and IFN-γ+ (i) CD8+ T cells after various treatments in TC-1 tumor-bearing mice. Day 10 data after tumor implantation; data are representative of one of two independent experiments. Each dot corresponds to one mouse with the indicated number of mice per group given in parentheses. The error bars indicate the s.e.m. For comparison purposes, an unpaired, one-tailed Student’s t-test was used. ****P ≤ 0.0001 (b); ****P ≤ 0.0001 (c); ****P ≤ 0.0001 (d); NS, OVA versus OVA-V: **P = 0.0047, **P = 0.0067 (lower), **P = 0.009 (middle), **P = 0.0073 (upper) (e); *P = 0.0211 (lower), *P = 0.0436 (middle), *P = 0.0328 (upper) (f); *P = 0.044, **P = 0.0015 (left), **P = 0.0061 (right), ****P ≤ 0.0001 (h); *P = 0.0312 (lower), *P = 0.0112 (middle), *P = 0.0172 (upper) (i). *P ≤ 0.05; **P ≤ 0.01; ***P ≤ 0.001; ****P ≤ 0.0001.
Fig. 8 |
Fig. 8 |. The frequency of PD-1+CD38+ CD8+ T cells is a pharmacodynamic and predictive biomarker of anti-PD-1 therapy.
a, The posttreatment average frequency of PD-1+CD38+ CD8+ T cells in 21 non-responding and 8 responding tumor lesions, as determined by single-cell RNA sequencing analysis, is shown on the left and the individual frequencies are shown on the right. The red line depicts the cutoff limit where at least 4% or more CD8+ T cells were PD-1+CD38+ in the tumors. b, The pretreatment average frequency of PD-1+CD38+ CD8+ T cells in 10 non-responding and 9 responding tumors lesions is shown on left and the individual frequencies are shown on the right. The red line depicts the cutoff limit where at least 10% or more CD8+ T cells were PD-1+CD38+ in the tumors. The error bars indicate the s.e.m. Left panels: an unpaired, one-tailed Student’s t-test was used. **P = 0.0045 (a); **P = 0.0048 (b). The post- and pretreatment cutoffs that best predicted responders from non-responders were determined a priori and were further confirmed using ROC analysis (right panels). c, Absolute numbers of CD8+ (top) and PD-1+CD38+ CD8+ (bottom) T cells in total viable cells in the TME in the pretreatment (non-responders: n = 10; responders: n = 9), posttreatment (non-responders: n = 21; responders: n = 8) or total (non-responders: n = 31; responders: n = 17) number of responding and non-responding tumor lesions. Each dot corresponds to one tumor lesion. The error bars indicate the s.e.m. For comparison purposes, a one-tailed Student’s t-test was used. Top panels: NS; bottom panels: *P = 0.019 (pretreatment); *P = 0.034 (posttreatment); **P = 0.0034 (total). d, Flow cytometry measurements of CD38+ cells in PD-1+CD8+ T cells in PBMCs from advanced melanoma patients at 3 and 9 weeks after anti-PD-1 treatment. For two non-responding patients, data are shown at 6 weeks since samples were not available at week 9.

References

    1. Kyi C & Postow MA Checkpoint blocking antibodies in cancer immunotherapy. FEBS Lett. 588, 368–376 (2014). - PubMed
    1. Topalian SL, Drake CG & Pardoll DM Immune checkpoint blockade: a common denominator approach to cancer therapy. Cancer Cell 27, 450–461 (2015). - PMC - PubMed
    1. Dong H et al. Tumor-associated B7-H1 promotes T-cell apoptosis: a potential mechanism of immune evasion. Nat. Med 8, 793–800 (2002). - PubMed
    1. Iwai Y et al. Involvement of PD-L1 on tumor cells in the escape from host immune system and tumor immunotherapy by PD-L1 blockade. Proc. Natl Acad. Sci. USA 99, 12293–12297 (2002). - PMC - PubMed
    1. Page DB, Postow MA, Callahan MK, Allison JP & Wolchok JD Immune modulation in cancer with antibodies. Annu. Rev. Med 65, 185–202 (2014). - PubMed

Publication types

MeSH terms