. 2019 Aug;25(8):1280-1289.
doi: 10.1038/s41591-019-0512-5. Epub 2019 Jul 29.

Atheroprotective roles of smooth muscle cell phenotypic modulation and the TCF21 disease gene as revealed by single-cell analysis

Affiliations

Atheroprotective roles of smooth muscle cell phenotypic modulation and the TCF21 disease gene as revealed by single-cell analysis

Robert C Wirka et al. Nat Med. 2019 Aug.

Abstract

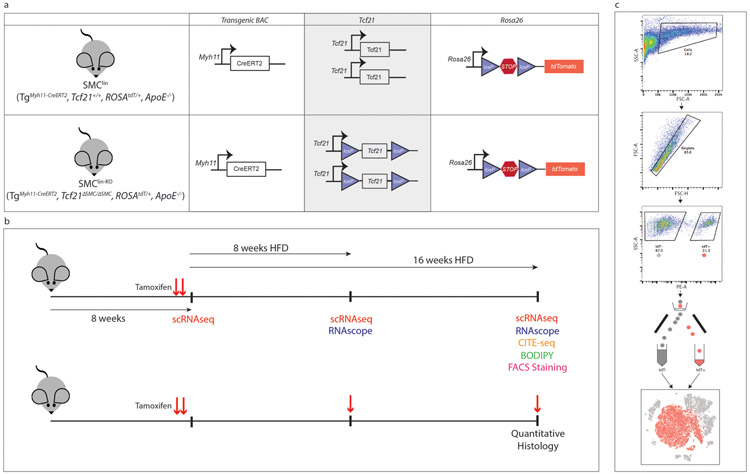
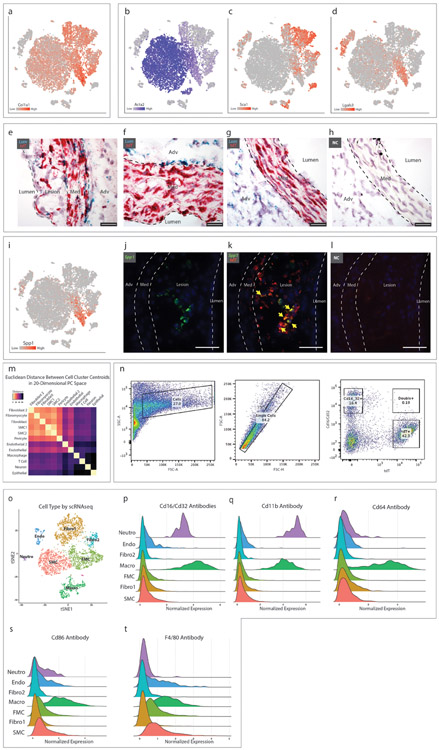
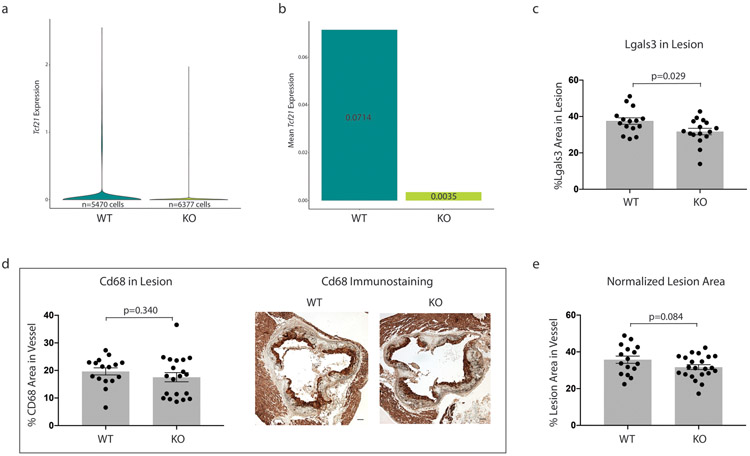
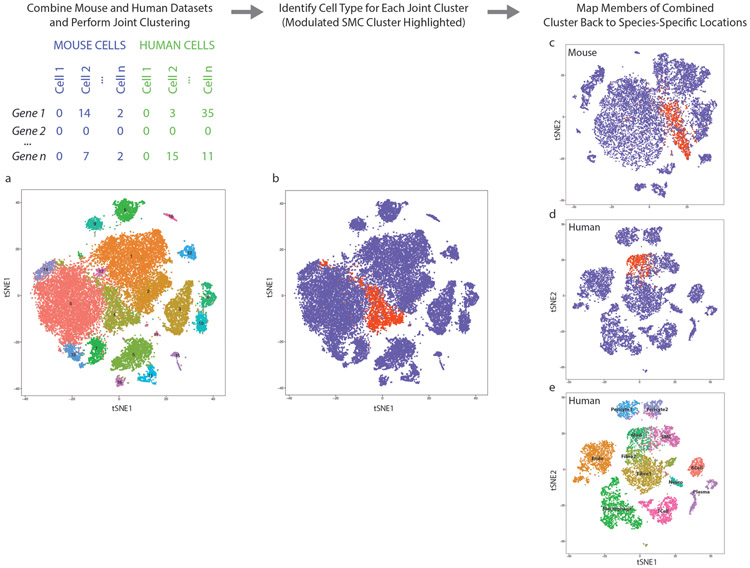
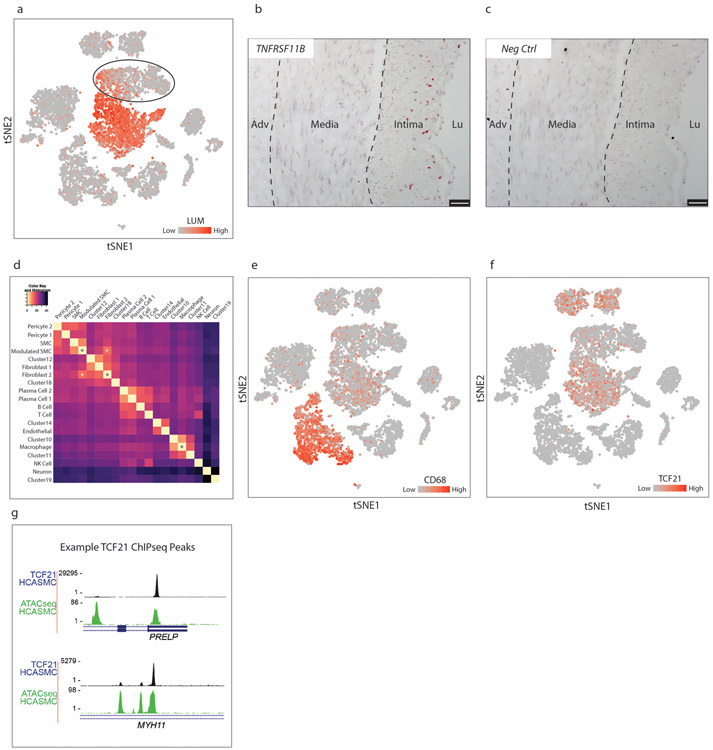
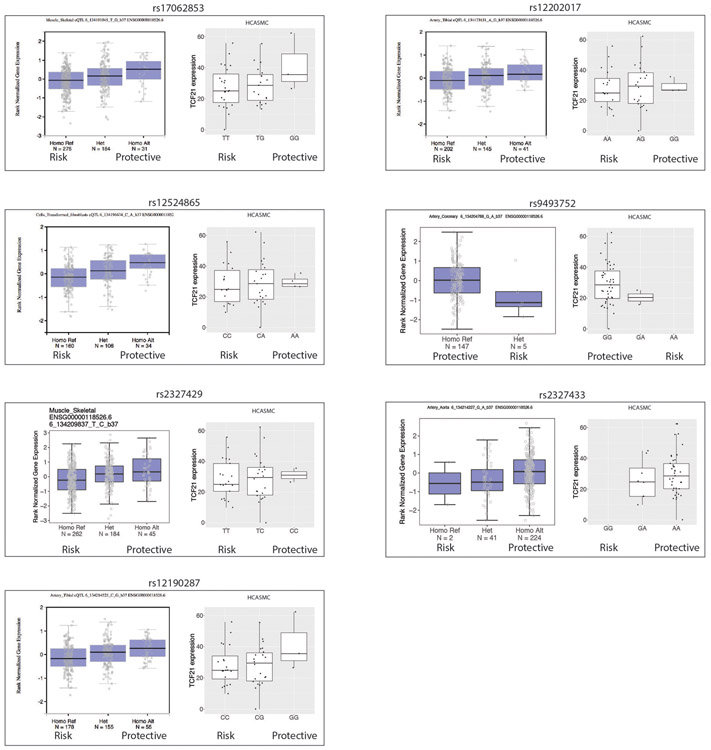
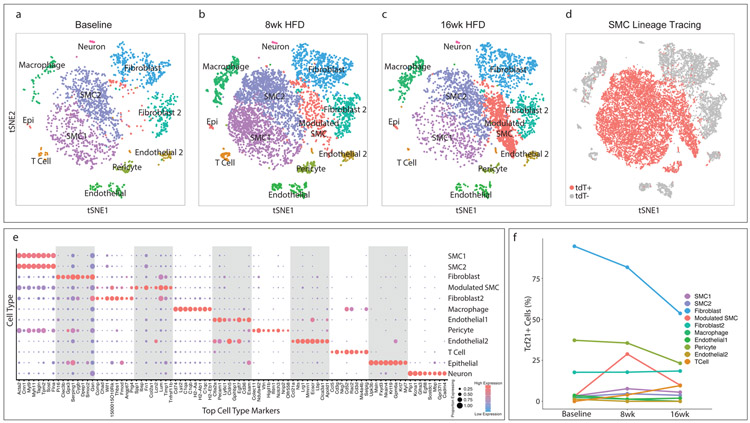
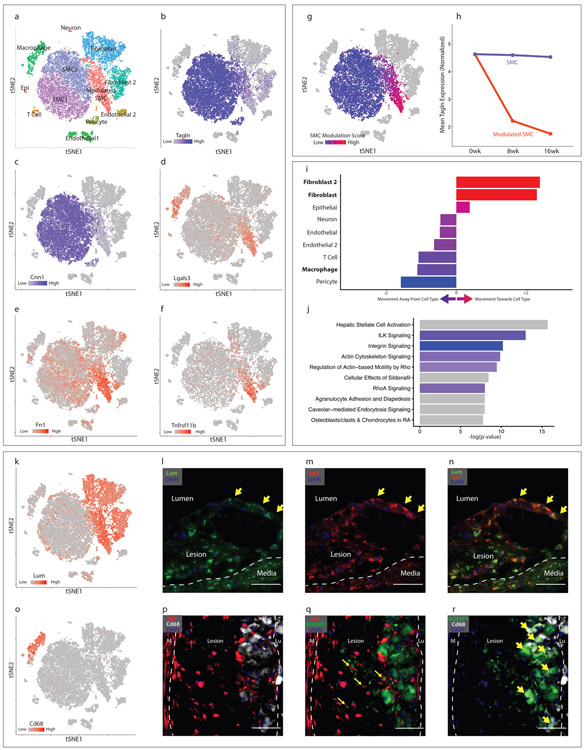
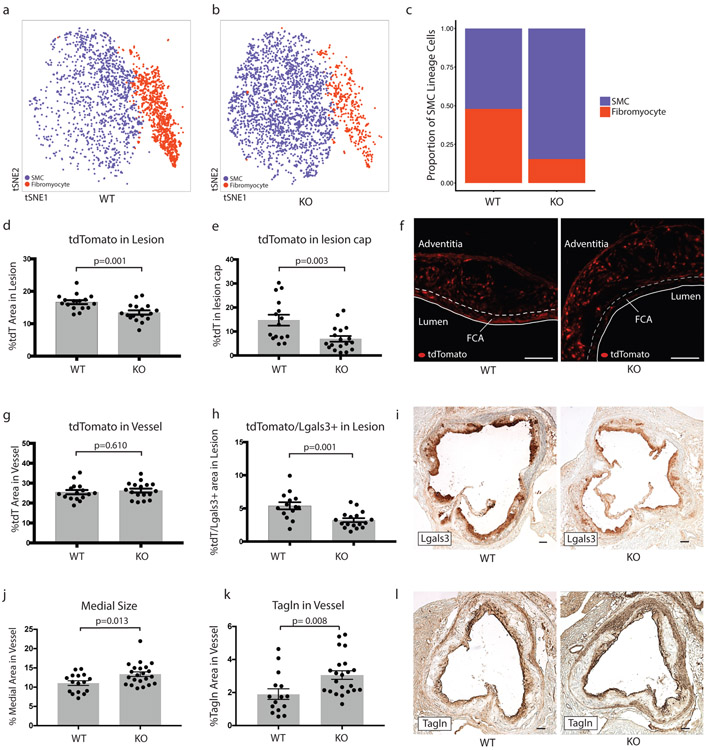
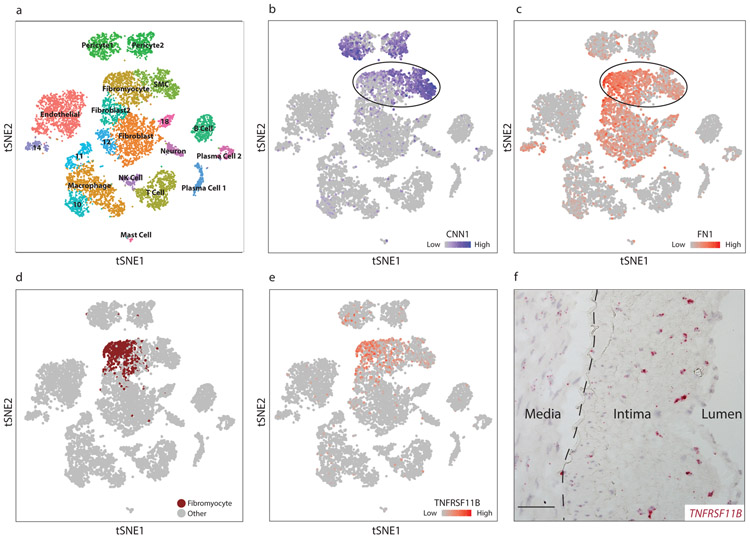
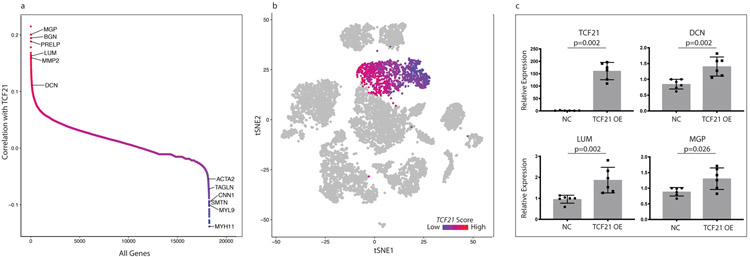
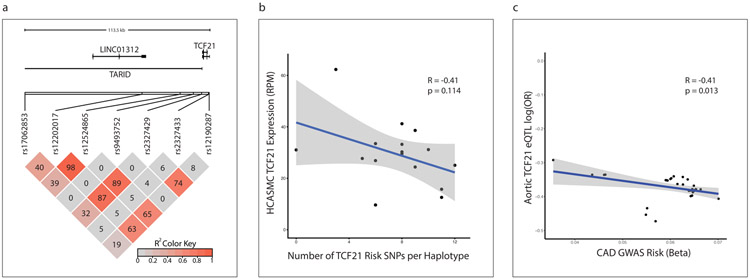
In response to various stimuli, vascular smooth muscle cells (SMCs) can de-differentiate, proliferate and migrate in a process known as phenotypic modulation. However, the phenotype of modulated SMCs in vivo during atherosclerosis and the influence of this process on coronary artery disease (CAD) risk have not been clearly established. Using single-cell RNA sequencing, we comprehensively characterized the transcriptomic phenotype of modulated SMCs in vivo in atherosclerotic lesions of both mouse and human arteries and found that these cells transform into unique fibroblast-like cells, termed 'fibromyocytes', rather than into a classical macrophage phenotype. SMC-specific knockout of TCF21-a causal CAD gene-markedly inhibited SMC phenotypic modulation in mice, leading to the presence of fewer fibromyocytes within lesions as well as within the protective fibrous cap of the lesions. Moreover, TCF21 expression was strongly associated with SMC phenotypic modulation in diseased human coronary arteries, and higher levels of TCF21 expression were associated with decreased CAD risk in human CAD-relevant tissues. These results establish a protective role for both TCF21 and SMC phenotypic modulation in this disease.


Conflict of interest statement

DECLARATION OF COMPETING INTERESTS

The authors claim no conflicts of interest relating to this manuscript.

Figures

Extended Data Figure 1.
Extended Data Figure 1.. Design of mouse experiments.
(a) Alleles present in SMClin and SMClin-KO mice. KO (knockout) refers to Tcf21, lin = lineage tracing, Tg = transgene, ΔSMC = SMC cell-specific KO (b) Mice were maintained on chow diet from birth until 7 weeks of age, then underwent gavage and high-fat diet (HFD) treatment. For single-cell RNAseq (scRNAseq), RNAscope, CITE-seq, histology involving BODIPY and FACS staining experiments (upper timeline), mice were gavaged only at 7 weeks of age, prior to onset of HFD, as denoted by red arrows. For scRNAseq experiments, mice were sacrificed at baseline (72 hours after initial tamoxifen gavage), or after 8 weeks or 16 weeks of HFD. For RNAscope experiments, mice were sacrificed after either 8 weeks or 16 weeks of HFD. For the CITE-seq experiment, mice were sacrificed after 16 weeks of HFD. For BODIPY studies, mice were sacrificed after 16 week of HFD. For the FACS staining experiment two mice, one after 12 weeks HFD and another after 15 weeks HFD were used. For quantitative histology experiments (lower timeline), mice were gavaged at 7 weeks of age, after 8 weeks of HFD and after 16 weeks of HFD (48 hours prior to sacrifice) as denoted by red arrows. For these quantitative histology experiments, all mice were sacrificed after 16 weeks of HFD. (c) Fluorescence activated cell sorting (FACS) workflow for isolating single cells from the mouse aortic root.
Extended Data Figure 2.
Extended Data Figure 2.. SMC phenotypic modulation in the mouse aortic root.
(a-d) t-SNE visualization of cell types present in the wild-type mouse aortic root from all timepoints overlaid with expression of Col1a1, Acta2, Sca1 and Lgals3. n=9 mice. (e-f) RNAscope staining for lumican (Lum, green) and tdT (red) in (e) a plaque after 8 weeks HFD, (f) the non-diseased media of a mouse on 16 weeks HFD and (g) in a baseline healthy aorta. (h) RNAscope negative control. Images in (e-h) are representative from 2 experiments and scale bars indicate 25μm. (i) t-SNE visualization of cell types present in the wild-type mouse aortic root from all timepoints overlaid with osteopontin (Spp1) expression. n=9 mice. (j-k) RNAscope co-localization of Spp1 (green) and tdT (red) in a plaque after 16 weeks HFD. Yellow arrows indicate co-localization of Spp1 and tdT. (l) RNAscope negative control. Images from (j-l) are representative of 4 experiments, and scale bars indicate 50μm. (m) Heatmap representation of the Euclidean distance between cell cluster centroids in 20-dimensional principal component space with smallest distances in yellow and largest distances in black. Data are after 16 weeks of HFD. (n) Staining of a single cell suspension from the atherosclerotic mouse aortic root and ascending aorta with antibodies against the macrophage markers Cd16 and Cd32, and analysis of co-expression with the tdT SMC lineage marker. Data are from one experiment and n=2 mice (after 12 and 15 weeks HFD). (o-t) Single cells from the atherosclerotic mouse aortic root and ascending aorta at 16 weeks HFD were incubated with DNA-barcoded antibodies against the macrophage markers Cd16, Cd32, Cd11b, Cd64, Cd86 and F4/80 prior to undergoing scRNAseq (CITE-seq), yielding simultaneous transcriptomic and antibody binding data within each individual cell. (o) Cell type assignments were determined with scRNAseq as described previously. (p-t) Quantitative antibody binding within each cell type. Results are from one experiment and n=2 mice.
Extended Data Figure 3.
Extended Data Figure 3.. Additional characteristics of SMClin vs SMClin-KO mice.
(a-b) Tcf21 expression in SMC lineage-labeled cells from SMClin (WT) and SMClin-KO (KO) mice from all timepoints combined. n=13 mice. (a) Tcf21 expression for all WT cells (left, min=0, max=2.55, mean=0.071) and all KO cells (right, min=0, max=1.97, mean=0.004). (b) Mean Tcf21 expression visualized for all SMC lineage-labeled WT and KO cells. (c) Total Lgals3+ area in the lesion is reduced in SMClin-KO mice. (d) Cd68 immunohistochemistry quantification (left) and representative images (right). Scale bars represent 100μm. (e) Lesion area, normalized to the total vessel area. Data from (c-e) are after 16 weeks HFD, and analyzed using a two-sided student’s t-test. Error bars indicate standard error.
Extended Data Figure 4.
Extended Data Figure 4.. Human phenotypically modulated SMCs.
(a) t-SNE visualization of celltypes in the right coronary artery of 4 patients, overlaid with LUM expression. Expression levels are indicated by scales in the lower right. (b) TNFRSF11B RNAscope staining in a human coronary artery section. Hybridization events are seen as red dots. (c) Negative control RNAscope probe shows no staining. Images in (b-c) are representative of 4 experiments, and scale bars represent 50μm. (d) Heatmap representation of the Euclidean distance between cell cluster centroids in 20-dimensional principal component space, with smallest distances in yellow and largest distances in black. Relationship between “Fibromyocyte” and “Fibroblast 2” clusters is highlighted with white asterisks. The “Fibromyocyte”, “SMC” and the main “Macrophage” clusters are denoted by black asterisks. (e-f) t-SNE visualization of celltypes in the right coronary artery of 4 patients overlaid with (e) CD68 expression and (f) TCF21 expression. (g) UCSC Genome Browser shots of representative TCF21 ChIPseq peaks within the PRELP and MYH11 genes, which are highly correlated and anti-correlated, respectively, with TCF21 and the fibromyocyte phenotype. Images are from one ChIPseq experiment.
Extended Data Figure 5.
Extended Data Figure 5.. Joint clustering approach identifies human phenotypically modulated SMCs.
(a) Joint clustering of mouse and human datasets using canonical correlation analysis (CCA) as per the Seurat package. (b) The shared mouse/human cluster containing bona fide SMC lineage-traced, phenotypically modulated SMCs (fibromyocytes) from the mouse is highlighted in red. (c) Mouse cells in the shared mouse/human fibromyocyte cluster in (b) are highlighted in the independently-clustered mouse dataset, confirming their location within the known fibromyocyte cell cluster. (d) Human cells in the shared mouse/human fibromyocyte cluster in (b) are highlighted in the independently-clustered human dataset, illustrating their location predominantly in the “Fibromyocyte” cluster (also shown in brown in Fig. 4d). (e) All joint mouse/human clusters in (a) were mapped back to the human dataset. Agreement is identified in cell type assignment between the joint clustering approach and the independently-clustered human dataset.
Extended Data Figure 6.
Extended Data Figure 6.. Association of genome-wide significant CAD risk SNPs at the 6q23.2 locus with TCF21 expression.
Seven SNPs in the 6q23.2 locus were associated with CAD at genome-wide significance. The association between risk and protective genotypes and TCF21 expression for each of these SNPs was determined using the gene-tissue expression database (GTEx) in CAD-relevant tissues and a cohort of 52 HCASMC lines. Number of independent tissue samples included for each SNP is indicated in the GTEx data (‘N’), and n=52 cell lines for the HCASMC data. In each box plot, the middle line represents the median, box represents the 1st to 3rd quartile range, and whiskers represent 1.5 times the interquertile range.
Figure 1.
Figure 1.. Transcriptomic characterization of mouse aortic root atherosclerotic plaques and Tcf21 expression.
(a–c) t-Stochastic Neighbor Embedding (t-SNE) visualization of cell types present in the mouse aortic root at (a) baseline, n=3 mice, (b) after 8 weeks of high-fat diet (HFD), n = 3 mice and (c) 16 weeks of HFD, n= 3 mice , illustrating the appearance of a disease-specific cell type, the “modulated SMC” cluster. All cell cluster identities are indicated in a-c. (d) SMC lineage traced cells, identified by their expression of the tdT reporter gene via FACS, are labeled in red for all timepoints. tdT+, cells expressing tdT; tdt−, cells not expressing tdT. (e) The top 8 genes defining each type of cell cluster in (a–c) are listed. The size of each circle represents the fraction of cells in each cluster that express at least 1 detected transcript of each gene; the color scale indicates expression level (blue = low, red = high). (f) Percentage of cells of each cell type that contained detectable (non-zero) Tcf21 levels at baseline, 8 weeks and 16 weeks of disease. Epi = epithelial-like cell.
Figure 2.
Figure 2.. Characterization of SMC phenotypic modulation in the mouse aortic root.
(a-g) t-SNE visualization of cell types present in the wild-type mouse aortic root from all timepoints combined (n=9 mice). (a) Cell types are indicated for each cluster. (b–f) t-SNE visualization at all timepoints combined, overlaid with expression of Tagln, Cnn1, Lgals3, Fn1 and Tnfrsf11b. Expression levels are indicated by scales in the lower left of each panel. n=9 mice. (g) A SMC modulation score was calculated for each cell based upon the expression of top differentially expressed genes between modulated SMC and contractile SMC clusters. Blue indicates more similarity to contractile SMC, red indicates more similarity to phenotypically modulated SMC. (h) Tagln expression in quiescent and modulated SMCs at 0, 8 and 16 weeks of high-fat diet (HFD). All expression levels are normalized for library size and log-transformed. (i) Transcriptional shift from contractile SMC to phenotypically modulated SMC phenotype at 16 weeks HFD, from the viewpoint of each non-SMC cell type within the lesion. Bars to the right of center indicate that, relative to contractile SMCs, modulated SMCs have shifted toward a given cell type. Bars to the left indicate that they have shifted away. Color represents the magnitude of shift (blue = farther away, red = closer towards). (j) Top enriched pathways for gene expression changes seen with SMC phenotypic modulation, as performed with Ingenuity Pathway Analysis (IPA). The top 200 differentially-expressed genes were analyzed with Fisher’s exact test (right-sided). Blue bars indicate negative Z-scores of predicted activation, and grey bars indicate that the pathway had not yet been annotated by IPA to yield an activity pattern. (k) t-SNE visualization at all timepoints combined, overlaid with expression of Lum. n=9 mice. (l-n) RNAscope staining in the mouse aortic root at 8 weeks of high-fat diet. Yellow arrows highlight cells at the fibrous cap expressing both Lum (green, in l) and tdT (red, in m), with merged Lum and tdT staining shown in (n). Dapi staining is shown in blue. Images in (l-n) are representative of 3 experiments, and scale bars represent 50μm. (o) t-SNE visualization at all timepoints combined, overlaid with expression of Cd68. n=9 mice. (p) tdT expression (red) and Cd68 immunostaining (white). Dapi staining is shown in blue. (q) tdT expression (red) and BODIPY lipid stain (green). Co-localization of tdT and BODIPY is highlighted with yellow arrows. (r) BODIPY lipid stain (green) and Cd68 immunostaining (white). Co-localization of BODIPY and Cd68 is highlighted with yellow arrows. Lu = lumen, M = media. Images in (p-r) are representative of 3 experiments, and scale bars represent 50μm.
Figure 3.
Figure 3.. SMC-specific Tcf21 knockout markedly inhibits SMC phenotypic modulation in mice.
(a,b) Prevalence of contractile SMCs (blue) and fibromyocytes (red) at 16 weeks of disease in (a) SMClin (n=3 mice) and (b) SMClin-KO (n=3 mice). (c) Proportions of contractile (blue) and modulated (red) SMCs after 16 weeks of disease in SMClin and SMClin-KO mice (n=3 mice for each genotype, chi-square p = 2.2e−16). (d,e) Percentage of tdT-positive staining area in the lesion (d) and in the fibrous cap (e) defined as the area of the lesion within 30 μm of the luminal surface). (f) Representative images of tdT positive cells in SMClin and SMClin-KO mice. FCA = fibrous cap area. (g) Total tdT content of the vessel. (h) tdT+/Lgals3+ area in the lesion. (i) Representative images of Lgals3+ staining in the lesions of SMClin and SMClin-KO mice. Medial size (j) and Tagln content (k) in SMClin and SMClin-KO mice. Representative images of Tagln staining are shown in (l). All data in (d-l) were at 16 weeks of disease. Scale bars in (f,i and l) represent 100μm. Data in (d,e,g,h,j,k) were analyzed using a two-sided Student’s t-test. Error bars denote standard error.
Figure 4.
Figure 4.. Identification of modulated SMCs in diseased human coronary arteries.
(a) t-SNE visualization of cell types isolated from the right coronary artery of four human patients, with assigned cell cluster identities indicated. (b-c) t-SNE visualization overlaid with expression of CNN1 (b) and FN1 (c). Expression levels are indicated by scales in the lower right of each panel. Data from n=4 patients. (d) In a joint mouse/human clustering analysis, a distinct population of human cells (brown) clustered together with lineage-traced fibromyocytes in the mouse. (e) t-SNE visualization overlaid with expression of TNFRSF11B. (f) RNAscope in-situ hybridization of TNFRSF11B in a human coronary artery. Image is representative of 4 experiments, and scale bar represents 50μm.
Figure 5.
Figure 5.. TCF21 is associated with SMC modulation in human coronary arteries.
(a) Pairwise Pearson correlation of TCF21 with every other gene in cells across the “SMC” and “Fibromyocyte” clusters from Fig. 4a. Selected examples of genes regulated during SMC modulation are labeled. (b) t-SNE visualization of cell clusters of the human coronary samples (n=4 patients). The 20 most highly correlated and anti-correlated genes from Fig. 5a were used to calculate a TCF21-associated human cell gene expression score, which ranges from highly anti-correlated (blue) to highly correlated (red). (c) Expression of SMC modulation marker genes with TCF21 overexpression in HCASMCs. Results are from 6 independent experiments each with 3 technical replicates. Statistical significance was determined by comparing fold-change values using a two-sided Mann-Whitney U test. NC = empty vector negative control, OE = overexpression. Error bars denote standard deviation.
Figure 6.
Figure 6.. Reduced TCF21 expression is associated with increased coronary disease risk.
(a) Linkage disequilibrium relationships (LD, R2 measure) of all genome-wide significant CAD-associated SNPs at the 6q23.2 locus (bottom), relative to the position of TCF21 and long non-coding RNAs (LINC01312 and TARID) within the locus (top). The R2 color indicates the degree of LD between each pair of SNPs, and ranges from 0 (grey) to 1 (red). The corresponding R2 values are also shown in each box. (b) Relationship between the number of genome-wide significant CAD risk alleles in each haplotype (x-axis) and TCF21 expression (y-axis) in 52 primary human coronary artery smooth muscle cell (HCASMC) lines. (c) Correlation between the magnitude of CAD risk imparted by each risk allele (x-axis) with relative TCF21 expression from that allele (y-axis) in 36 CAD-associated SNPS at the 6q23.2 locus in aortic tissue from the STARNET database. p-value was calculated using Pearson’s moment correlation coefficient. Grey shaded areas indicate 95% confidence intervals are based on Fisher’s Z-transform.

References

    1. Davies MJ, Richardson PD, Woolf N, Katz DR & Mann J Risk of thrombosis in human atherosclerotic plaques: role of extracellular lipid, macrophage, and smooth muscle cell content. British heart journal 69, 377–381 (1993). - PMC - PubMed
    1. Libby P & Aikawa M Stabilization of atherosclerotic plaques: new mechanisms and clinical targets. Nature medicine 8, 1257–1262, doi:10.1038/nm1102-1257 (2002). - DOI - PubMed
    1. Ross R & Glomset JA Atherosclerosis and the arterial smooth muscle cell: Proliferation of smooth muscle is a key event in the genesis of the lesions of atherosclerosis. Science (New York, N.Y.) 180, 1332–1339 (1973). - PubMed
    1. Bennett MR, Sinha S & Owens GK Vascular Smooth Muscle Cells in Atherosclerosis. Circulation research 118, 692–702, doi:10.1161/circresaha.115.306361 (2016). - DOI - PMC - PubMed
    1. Gomez D & Owens GK Smooth muscle cell phenotypic switching in atherosclerosis. Cardiovascular research 95, 156–164, doi:10.1093/cvr/cvs115 (2012). - DOI - PMC - PubMed

Publication types

MeSH terms

Substances