. 2019 Aug;25(8):1251-1259.
doi: 10.1038/s41591-019-0522-3. Epub 2019 Jul 29.

Clonal replacement of tumor-specific T cells following PD-1 blockade

Affiliations

Clonal replacement of tumor-specific T cells following PD-1 blockade

Kathryn E Yost et al. Nat Med. 2019 Aug.

Abstract

Immunotherapies that block inhibitory checkpoint receptors on T cells have transformed the clinical care of patients with cancer1. However, whether the T cell response to checkpoint blockade relies on reinvigoration of pre-existing tumor-infiltrating lymphocytes or on recruitment of novel T cells remains unclear2-4. Here we performed paired single-cell RNA and T cell receptor sequencing on 79,046 cells from site-matched tumors from patients with basal or squamous cell carcinoma before and after anti-PD-1 therapy. Tracking T cell receptor clones and transcriptional phenotypes revealed coupling of tumor recognition, clonal expansion and T cell dysfunction marked by clonal expansion of CD8+CD39+ T cells, which co-expressed markers of chronic T cell activation and exhaustion. However, the expansion of T cell clones did not derive from pre-existing tumor-infiltrating T lymphocytes; instead, the expanded clones consisted of novel clonotypes that had not previously been observed in the same tumor. Clonal replacement of T cells was preferentially observed in exhausted CD8+ T cells and evident in patients with basal or squamous cell carcinoma. These results demonstrate that pre-existing tumor-specific T cells may have limited reinvigoration capacity, and that the T cell response to checkpoint blockade derives from a distinct repertoire of T cell clones that may have just recently entered the tumor.


Conflict of interest statement

Competing Interests

H.Y.C. is a co-founder of Accent Therapeutics and an advisor for 10x Genomics and Spring Discovery. A. L. S. C. was an advisory board member and clinical investigator for studies sponsored by Merck, Regeneron, Novartis, Galderma, Genentech Roche. A.T.S. and D.K.W. are advisors for Immunai.

Figures
Extended Data Fig. 1
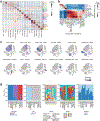
Extended Data Fig. 1. Mutational landscape of BCC tumors following PD-1 blockade, Related to Figure 1.
(a) Summary of mutation burden, potential driver mutations, and mutation frequencies detected in WES data. Potential driver mutations were selected based on frequently mutated genes in BCC identified by Bonilla et al., 2015. (b) Bar plots of nonsynonymous mutation burden pre- and post-treatment detected by exome sequencing (top) and predicted neoepitope burden using only the predicted binding strength of the mutant peptide, for peptides with <500 nM binding strength (left), or <50 nM binding strength (right). (c) Changes in clonal mutation composition detected in exome sequencing data following treatment, with persistent mutation clusters in grey, mutation clusters decreasing in cellular prevalence following treatment in blue or green, and mutation clusters increasing in cellular prevalence following treatment in red. For clonal composition analysis, variant allele information from matched pre- and post-treatment tumor samples was leveraged to rescue shared low-frequency variants that did not pass standard variant filtering (Methods). Bar plots of the ratio of predicted neoepitopes to nonsynomymous mutations in each mutation cluster (right), with two novel tumor subclones emerging post-treatment devoid of predicted neoepitopes. Predicted neoepitopes were based on binding strength of <500 nM binding strength for the mutant peptide and >500 nM binding strength of the corresponding WT peptide (as in Fig. 1c). (d) Representative flow cytometry staining of dissociated BCC cells. Similar results were obtained for each sorted sample (including SCC samples, n = 32). Cells were stained for expression of the indicated markers, and two-color histograms are shown for cells pregated as indicated by the arrows and above each diagram. Numbers represent the percentage of cells within the indicated gate. Bottom panels demonstrate cell size differences between tumor and stromal cells, immune cells (non-T cells), and T cells.
Extended Data Fig. 2
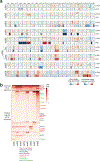
Extended Data Fig. 2. Characterization of cell types present in BCC TME, Related to Figure 1.
(a) Heatmap of differentially expressed genes (rows) between cells belonging to each cell type cluster (columns). All malignant cells were treated as one cluster. (b) Correlation between aggregated expression profiles from immune cell type clusters identified in BCC TME and bulk RNA-seq profiles from sorted reference populations (from Calderon et al., 2018, n = 1–4 biologically independent samples from different donors). (c) UMAP of all BCC TME cells colored by cell type-specific markers. (d) Bar plots indicating relative proportions of sort markers detected in each cluster (excluding cells that were not sorted on any markers), relative proportions of cells for which a TCR sequence was detected in each cluster, relative proportions of each non-malignant cell type detected per patient, relative proportions of cells from each patient detected in each cluster, and relative proportions of pre- and post-treatment cells detected in each cluster.
Extended Data Fig. 3
Extended Data Fig. 3. Copy number alterations and gene expression of individual BCC tumors, Related to Figure 1.
(a) Inferred CNV profiles for malignant cells separated by patient based on scRNA-seq (scCNV) and WES. Dashed line indicates a potential subclone identified by scCNV highlighted for su005. For all patients, pre and post-treatment malignant cells were analyzed together and exhibited similar CNV profiles, with the exception of su006. For su006, differences between timepoints were apparent in CNV profiles obtained from both scRNA-seq as well as exome, analogous to the changes in mutation composition identified in Extended Data Fig. 1a. (b) Heatmap of differentially expressed genes (rows, n = 577) across malignant BCC cells (n = 3,548) aggregated by patient (columns, n = 8). Cutoffs for differential expression were less than 0.01 adjusted P-value (Wilcoxon rank sum test, two-tailed, Bonferroni corrected), greater than 0.3 average log fold change and greater than 0.3 difference in fraction of positive cells. Core BCC genes that are differentially expressed between all malignant cells and other TME cells are shown in top cluster. Genes differentially expressed between patients are shown in the bottom clusters. Specific genes associated with cancer-associated pathways are highlighted.
Extended Data Fig. 4
Extended Data Fig. 4. Characterization of T cell subtypes present in BCC TME, Related to Figure 2.
(a) Enrichment of bulk T cell subtype signatures for each T cell cluster identified in the BCC TME. T cell subtype signatures were derived from bulk datasets (from this study and Simoni et al., 2018, n = 3–7 biologically independent samples from different donors) and single T cells from BCC dataset were scored for signature enrichment. Heatmaps represents the z-scored average signature enrichment for each cluster. (b) Heatmap of Pearson correlation between T cell clusters based on first 20 PCs used for clustering (n = 33,106 cells). (c) UMAP of all T cells colored by marker gene expression. (d) UMAP of all T cells separated by patient and colored by anti-PD-1 treatment status.
Extended Data Fig. 5
Extended Data Fig. 5. Characterization of activation/exhaustion trajectories and increase in Tfh cell clonality accompanied by B cell expansion, Related to Figure 2.
(a) Violin plots of cell coordinates in diffusion components 1 and 2 separated by cluster identity (left, middle). Violin plot of pseudotime values separated by cluster identity (right). N = number of cells. (b) Heatmap of expression of genes with highest correlation with diffusion components 1 and 2 (rows) across cells belonging to each cell type cluster (columns). (c) Boxplot of Gini indices for each CD4+ T cell cluster separated by timepoint, showing clonal expansion of Tfh cells following treatment. Each point represents a patient with more than 10 cells belonging to a cluster at that timepoint, with the size proportional to the number of cells. (d) UMAP of all cells detected for patient su001 colored by treatment timepoint (left) and relative proportions of each immune cell type (right), showing increased frequency of B cells posttreatment. (e) UMAP of T cells detected for patient su001 colored by treatment timepoint (left) and relative proportions of CD4+ phenotype (right), showing increased frequency of Tfh cells post-treatment. (f) Bar plot of percent AICDA positive B cells, separated by patient. (g) H&E staining of post-treatment BCC tumor from patient su001 post-treatment demonstrating islands of BCC in sclerotic stroma with a peripheral cuff of dense lymphoid tissue. Scale bar for top image represents 400 μm and scale bar for bottom image represents 100 μm. H&E staining was performed once for each sample.
Extended Data Fig. 6
Extended Data Fig. 6. Correlations between T cell clones or TCR specificity groups and scRNA-seq phenotype, Related to Figure 3.
(a) Distributions of the proportion of cells within each clone (>=3 cells) that share a common cluster identity, separated by patient (for patients with >3 clones with >=3 cells), compared to randomly selected and size matched groups of T cells (n = number of clones, unpaired t-test, two-tailed). (b) Distribution of the proportion of CD4+ cells (left) and CD8+ cells (right) within each clone or TCRβ clones within each TCR specificity group (>=3 cells) that share a common cluster identity, separated by treatment timepoint, compared to randomly selected and size matched groups of T cells from the same sample (left, n = number of clones, unpaired t-test, two-tailed). (c) Bar plot of T cell cluster assignments for all clones with greater than 10 cells, separated by patient and treatment status. (d) Bar plot of T cell cluster assignments for the largest 10 TCR specificity groups, separated by TCRβ clone. Conserved motifs between TCRβ clones identified by GLIPH highlighted in red. Representative TCRβ sequences shown for TCR specificity groups with more than four unique clonotypes. (e) Heatmap of the fraction of TCR specificity groups with clones belonging to a given primary phenotype (rows) that also contain clones belonging to a secondary phenotype (columns).
Extended Data Fig. 7
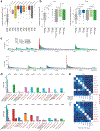
Extended Data Fig. 7. Details of clone transitions, Related to Figure 3.
(a) Heatmap of TCRβ clonotype overlap between all samples, indicating correct pairing of samples and a significant number of overlapping clones between timepoint within individual patients with the exception of one pair with limited cell numbers and no clonotype overlap (su003) (b) Bar plot of T cell cluster assignments for matched TCRβ clones between timepoints for top 60 clones with at least 3 cells per timepoint. Related to Figure 3e.
Extended Data Fig. 8
Extended Data Fig. 8. Clonal expansion in tumor and peripheral blood detected by bulk TCR sequencing, Related to Figure 4.
(a) Scatterplots comparing TCRβ clone frequencies pre- and post-treatment measured by single-cell RNA+TCR-seq, separated by patient. Clones where the majority of cells share an exhausted CD8+ phenotype (red) or a memory CD8+ phenotype (blue) are highlighted. Patient su003 without no clonotype overlap between timepoints excluded. In this and subsequent panels, exhausted refers to both exhausted and exhausted/activated clusters. (b) Boxplot of the fraction of novel TCR specificity groups within each cluster following treatment for TCR specificity groups containing at least two distinct TCRβ sequences and at least 3 cells, separated by patient (n = number of patients). (c) Bar plot of fraction of clones with significant expansion post-treatment based on bulk TCRseq, separated by patient and phenotype and colored by replacement status. (d) Scatterplots comparing TCRβ clone frequencies between timepoints measured by bulk TCR-seq for sequential timepoints in patient su001, with clones where the majority of cells share an exhausted CD8+ phenotype (red) or a memory CD8+ phenotype (blue) highlighted. Novel clones emerging between timepoints are highlighted in dark red and are detected only in pre- and post-treatment comparisons, but not in comparisons between pre-treatment timepoints, suggesting that replacement is primarily a result of PD-1 blockade rather than time between sampling.
Extended Data Fig. 9
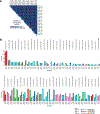
Extended Data Fig. 9. TCR overlap between peripheral blood and tumor detected by bulk TCR sequencing, Related to Figure 4.
(a) Pie chart of percentage of TCRβ clones detected in peripheral blood that were also detected by scRNA-seq, expanded to show distribution of phenotypes in tumor, as well as fraction of exhausted clones detected in peripheral blood, colored by replacement status in tumor. In this and subsequent panels, the exhausted category includes both exhausted and exhausted/activated clusters. (b) Bar plot of percentage peripheral T cells matching tumor-infiltrating TCRβ clones with exhausted phenotypes post-treatment as detected by scRNA-seq. (c) Violin plot of TCR specificity group enrichment (tumor frequency / PBMC frequency) detected by bulk TCRseq, separated by phenotype and treatment status (n = number of TCR specificity groups, unpaired t-test, one-tailed).
Extended Data Fig. 10
Extended Data Fig. 10. Clonal replacement analysis in SCC TILs following PD-1 blockade, Related to Figure 4.
(a) UMAP of tumor-infiltrating T cells present in SCC samples pre- and post-PD-1 blockade colored by patient (top right) and anti-PD-1 treatment status (bottom right). (b) Heatmap of correlation between averaged RNA expression between BCC and SCC T cell clusters. (c) Boxplot of Gini indices for each CD8+ T cell cluster calculated for each patient (n = number of patients). In this and subsequent panels, exhausted refers to both exhausted and exhausted/activated clusters, unless otherwise noted. (d) Abundance of the top 12 exhausted clones in sample su010-S identified by unsupervised clustering compared to the abundance of the same clones in sorted CD8+ CD39+ T cells, colored by assigned phenotype. (e) Distribution of the proportion of cells within each clone or TCRβ clones within each TCR specificity group (>=3 cells) that share a common cluster identity, separated by treatment timepoint, compared to randomly selected and size matched groups of T cells from the same sample (left, n = number of TCRβ clones or TCR specificity groups, unpaired t-test, two-tailed). (f) Heatmap of the fraction of clonotypes belonging to a given primary phenotype cluster (rows) that are shared with other secondary phenotype clusters (columns). (g) Heatmap of all observed phenotype transitions for matched clones during PD-1 blockade for clones with at least 3 cells for each timepoint. (h) TCF7+/stem-like score (from Im et al. 2016) versus exhaustion score for all CD8+ T cells, colored by gene expression (left). TCF7+/stem-like score versus exhaustion score for exhausted cells and cells of other phenotypes belonging to primarily exhausted clones, colored by phenotype (top right). Violin plot of TCF7+/stem-like score for exhausted cells and cells of other phenotypes belonging to primarily exhausted clones, demonstrating that the highest TCF7+/stem-like score is observed in cells with an exhausted phenotype (bottom right, n = number of cells). (i) Violin plot of TCF7+/stemlike score for memory and exhausted cells separated by change in clone abundance following treatment (left, n = number of cells, unpaired t-test, two-tailed). Clones were defined as expanded or contracted if they significantly changed in abundance by a Fisher exact test (P < 0.05 and fold change > 0.5), and persistent if they did not significantly change in abundance and at least one cell was detected at each timepoint. (j) Scatterplots comparing TCRβ clone frequencies pre- and post-treatment measured by single-cell TCR sequencing for all BCC patients. Clones that were significantly expanded or contracted post-treatment based on a binomial test (two-sided, Bonferroni corrected P value < 0.01) are highlighted on the left. Clones where the majority of cells share an exhausted CD8+ phenotype (middle, red) or a memory CD8+ phenotype (right, blue) are also highlighted.</Figure_Caption>
Figure 1.
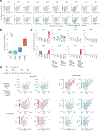
Figure 1.. Characterization of the BCC TME pre- and post-PD-1 blockade by single-cell RNA-seq.
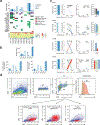
(a) Workflow for sample processing and scRNA-seq analysis of advanced BCC samples collected pre- and post-PD-1 blockade. Graphics courtesy of the Parker Institute for Cancer Immunotherapy. (b) Immunohistochemistry staining for CD3+ cells in representative BCC tumors before and after PD-1 blockade. Tumor boundaries denoted with dashed lines. All scale bars represent 100 μm. IHC staining was performed once for each sample (n = 16 samples). (c) Bar plot of neoepitope burden pre- and post-treatment based on exome sequencing. Variants were classified as predicted neoepitopes if the peptide was found to bind to the MHC allele with less than 500 nM binding strength and its wildtype cognate bound to the same allele with greater than 500 nM binding strength. (d) UMAP of all tumor-resident cells pre- and post-therapy for all 11 BCC patients. Clusters denoted by color are labeled with inferred cell types, which include 2 malignant clusters, 2 CD4+ T cell clusters, 3 CD8+ T cell clusters, and proliferating T cells, endothelial cells, melanocytes, myofibroblasts, and cancer-associated fibroblasts (CAFs), dendritic cells (DCs), macrophages, and plasmacytoid dendritic cells (pDCs), 3 B cell clusters, and 1 NK cell cluster. (e) UMAP of tumor-resident cells colored by patient identity (top left), FACS sort markers (top right), anti-PD1 treatment status (bottom left), and TCR detection (bottom right). (f) Inferred CNV profiles based on scRNA-seq data. Non-immune, non-malignant cells (fibroblasts and endothelial cells, n = 2,122) were used as normal reference for malignant cell CNV inference (n = 3,548). (g) Representative examples of hematoxylin and eosin (H&E) staining of different BCC subtypes. All scale bars represent 100 μm. H&E staining was performed once for each sample (n = 9 samples). (h) UMAP of malignant cells colored by patient (left) and clinical subtype (right). (i) UMAP of malignant cells colored by enrichment of basal and squamous cell carcinoma gene signatures (from Atwood et al., 2015 and Hoang et al., 2017) (top). Malignant cells ordered based on the difference between basal and squamous signatures (bottom). The clinical diagnosis associated with each cell and expression of signature associated genes are indicated below.
Figure 2.
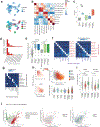
Figure 2.. Exhausted CD8+ T cells are clonally expanded and express markers of tumor-specificity.
(a) UMAP of tumor-infiltrating T cells present in BCC samples pre- and post-PD-1 blockade. Clusters denoted by color labeled with inferred cell types (left). UMAP also colored by patient (top right) and anti-PD-1 treatment status (bottom right). (b) Heatmap of differentially expressed genes (rows) between cells belonging to different T cell subsets (columns). Specific genes associated with different T cell clusters are highlighted. Bars at top of heatmap indicate the number of cells, post-therapy enrichment, and number of patients in each cluster. (c) Diffusion map of naïve, memory, activated and exhausted CD8+ T cells using the first two diffusion components (left). Cells colored based on cluster identities from Fig. 2a. Cells are also colored by diffusion pseudotime and treatment status (top right). Average expression of selected core activation and exhaustion genes is quantified along diffusion components 1 and 2 (bottom right). (d) Co-expression analysis of differentially expressed genes (n = 146 genes) between activated, exhausted and activated/exhausted CD8+ T cells (n = 5454 cells). Inset indicates core exhaustion module identified by hierarchical clustering, with canonical exhaustion genes highlighted. (e) Diffusion map of CD8+ T cell subsets colored by clone size (left) and boxplot of Gini indices for each CD8+ T cell cluster calculated for each patient (right), showing significant clonal expansion within exhausted CD8+ T cells (n = number of patients, unpaired t-test, one-tailed, relative to basemean; box center line, median; box limits, upper and lower quartiles; box whiskers, 1.58× interquartile range, here and throughout). Exhausted refers to both exhausted and exhausted/activated clusters. (f) Activation score (based on expression of top 50 genes most correlated with IFNG expression) versus exhaustion score (based on expression of top 50 genes most correlated with HAVCR2 expression) for all CD8+ T cells (n = 17,561), colored by expression levels of indicated genes. (g) Activation score versus exhaustion score enrichment for TCR clones with >1 cell (n = 6,422) based on average activation and exhaustion scores of individual cells belonging to that clone, colored by the most frequent assigned phenotype for cells belonging to that clone, and size based on clone size (top right) or cell cycle score (bottom right).
Figure 3.
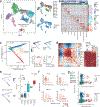
Figure 3.. Clonal dynamics and phenotype transitions of tumor-infiltrating T cells.
(a) UMAP of tumor-infiltrating T cells colored by selected TCR clones (left). UMAP of T cells colored by TCRβ clones belonging to the same TCR specificity (GLIPH) group (right). (b) Phenotypes of single cells belonging to the same TCR clone or TCR specificity group. Shown are the top five most abundant clones (top and middle) larger than 10 cells for each patient. Each bar is colored by individual phenotypes of single cells within the clone. The bottom plots show phenotypes of distinct TCR clones within a TCR specificity group. Both analyses show substantial phenotypic similarity among single cells belonging to a clone or group. (c) Distribution of the proportion of cells within each clone, or TCRβ clones within each TCR specificity group, (>=3 cells) that share a common cluster identity compared to randomly selected and size matched groups of T cells from the same sample (left, n = number of TCRβ clones or TCR specificity groups, unpaired t-test, two-tailed). Distribution of cell-cell correlations between cells that belong to the same TCR clone or cells within the same TCR specificity group but different clonotypes, compared to randomly selected and size matched groups of T cells from the same sample (bottom, n = number of cells or clones, unpaired t-test, two-tailed). Cell-cell correlations were calculated using log-transformed expression of differentially expressed genes. (d) Heatmap showing the fraction of clonotypes belonging to a primary phenotype cluster (rows) that are shared with other secondary phenotype clusters (columns). (e) Heatmap of all observed phenotype transitions for matched clones during PD-1 blockade for clones with at least 3 cells for each timepoint. (f) TCF7+/stem-like score (from Im et al., 2016) versus exhaustion score for all CD8+ T cells (n = 17,561), colored by expression of indicated genes (left). TCF7+/stem-like score versus exhaustion score for cells belonging to primarily exhausted clones, colored by phenotype (top right). Violin plot of TCF7+/stem-like score for memory and exhausted clones separated by change in clone abundance following treatment (bottom right, n = number of clones, unpaired t-test, two-tailed). Clones were defined as expanded or contracted if they significantly changed in abundance by a Fisher exact test (P < 0.05 and fold change > 0.5), and persistent if they did not significantly change in abundance and at least one cell was detected at each timepoint. Exhausted refers to both exhausted and exhausted/activated clusters. (g) Pie charts showing clone size and distribution of phenotypes for matched clones pre- and post-therapy. Selected clones had a primarily exhausted phenotype pre-therapy and increased in abundance post-therapy, and are separated by the presence of a high TCF7+ signature prior to treatment. (h) Pie chart of all clones with an exhausted phenotype post-treatment, colored by whether the clone contained TCF7 high cells pre-therapy.
Figure 4.
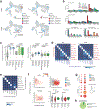
Figure 4.. Clonal replacement of exhausted CD8+ T cells following PD-1 blockade.
(a) Scatterplots comparing TCRβ clone frequencies pre- and post-treatment measured by scRNA+TCR-seq for all BCC patients (n = 11 patients). Clones that were significantly expanded or contracted post-treatment based on a Fisher exact test (P < 0.05) are highlighted on the left. Clones where the majority of cells exhibit an exhausted CD8+ phenotype (middle, red) or a memory CD8+ phenotype (right, blue) highlighted. In this and subsequent panels, exhausted refers to both exhausted and exhausted/activated clusters. (b) Boxplot of the fraction of novel clones detected by scRNA+TCR-seq within each cluster following treatment (n = number of patients, unpaired t-test, two-tailed). Clones with only one cell detected and cells from su003 with no clonotype overlap between timepoints were excluded. (c) Lorenz curve of TCRβ clone frequencies based on scRNA+TCR-seq for exhausted CD8+ T cell clones (left) and memory CD8+ T cell clones (middle) greater than or equal to 5 cells, colored by presence of each clone prior to treatment. Proportion of novel clones in each phenotype quantified on the right. (d) Fraction of exhausted cells out of total T cells detected by single cell RNA+TCR-seq for each patient, separated by treatment status. Cells belonging to novel clones detected post-treatment are highlighted. (e) Scatterplots comparing TCRβ clone frequencies pre- and post-treatment measured by bulk TCR-seq (n = 8 patients). Clones that were significantly expanded or contracted post-treatment based on a binomial test (two-sided, Bonferroni corrected P value < 0.01) are highlighted on the left, with expanded clones further separated based on their detection pre-treatment. Clones where the majority of cells share an exhausted CD8+ phenotype based on scRNA-seq (middle, red) or a memory CD8+ phenotype (right, blue) highlighted. (f) Bar plot of fraction of clones with significant expansion post-treatment based on bulk TCR-seq, separated by phenotype and colored by replacement status. (g) Overlap between TCRβ clones in peripheral blood and tumor infiltrating T cells detected by bulk TCR-seq (n = 5 patients, left). Fraction of TIL clones detected in peripheral blood, separated by sample (top right). Fraction of novel exhausted TIL clones detected in PBMCs, separated by treatment status (bottom right). (h) Violin plot of clone enrichment (tumor frequency / PBMC frequency) detected by bulk TCR-seq, separated by phenotype and treatment status (data from 5 patients, n = number of clones, unpaired t-test, one-tailed). (i) Characteristics of squamous cell carcinoma (SCC) samples treated with anti-PD-1 (left) and UMAP of tumor-infiltrating T cells present in SCC samples pre- and post-PD-1 blockade (right). Clusters denoted by color are labeled with inferred cell types. Graphics courtesy of the Parker Institute for Cancer Immunotherapy. (j) Fraction of exhausted cells out of total T cells detected by single-cell RNA+TCR-seq for each patient, separated by treatment status. Novel clones detected post-treatment are highlighted (bottom left). Sample su010-S derived from an SCC lesion from patient su010 who presented with both BCC and SCC lesions. (k) Bar plot of fraction of clones with significant expansion based on bulk TCR sequencing post-treatment, separated by phenotype and colored by replacement status (bottom right).

Comment in

References

    1. Sharma P & Allison JP The future of immune checkpoint therapy. Science 348, 56–61 (2015). - PubMed
    1. Sakuishi K et al. Targeting Tim-3 and PD-1 pathways to reverse T cell exhaustion and restore anti-tumor immunity. J. Exp. Med 207, 2187–2194 (2010). - PMC - PubMed
    1. Wherry EJ & Kurachi M Molecular and cellular insights into T cell exhaustion. Nat. Rev. Immunol 15, 486–499 (2015). - PMC - PubMed
    1. Pauken KE et al. Epigenetic stability of exhausted T cells limits durability of reinvigoration by PD-1 blockade. Science 354, 1160–1165 (2016). - PMC - PubMed
    1. Riaz N et al. Tumor and Microenvironment Evolution during Immunotherapy with Nivolumab. Cell 171, 934–949.e16 (2017). - PMC - PubMed

Publication types

MeSH terms

Substances