

P-value evaluation, variability index and biomarker categorization for adaptively weighted Fisher's meta-analysis method in omics applications
- PMID: 31359040
- PMCID: PMC7867999
- DOI: 10.1093/bioinformatics/btz589
P-value evaluation, variability index and biomarker categorization for adaptively weighted Fisher's meta-analysis method in omics applications
Abstract
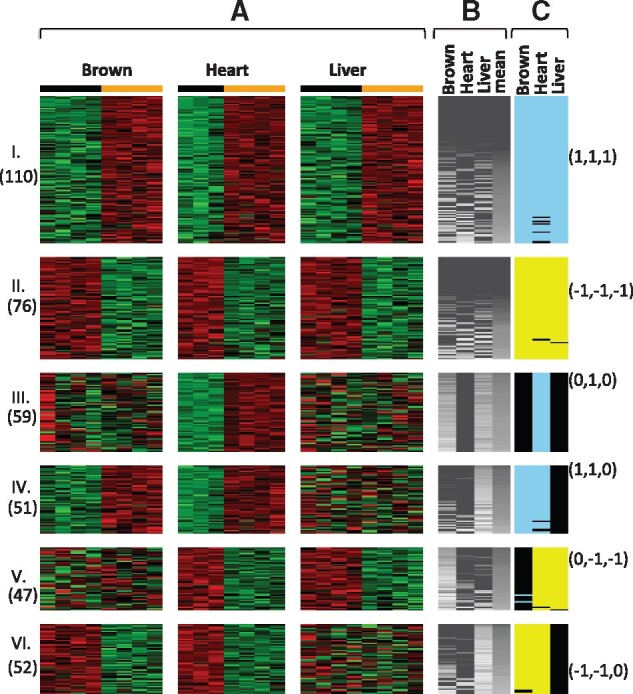
Motivation: Meta-analysis methods have been widely used to combine results from multiple clinical or genomic studies to increase statistical powers and ensure robust and accurate conclusions. The adaptively weighted Fisher's method (AW-Fisher), initially developed for omics applications but applicable for general meta-analysis, is an effective approach to combine P-values from K independent studies and to provide better biological interpretability by characterizing which studies contribute to the meta-analysis. Currently, AW-Fisher suffers from the lack of fast P-value computation and variability estimate of AW weights. When the number of studies K is large, the 3K - 1 possible differential expression pattern categories generated by AW-Fisher can become intractable. In this paper, we develop an importance sampling scheme with spline interpolation to increase the accuracy and speed of the P-value calculation. We also apply bootstrapping to construct a variability index for the AW-Fisher weight estimator and a co-membership matrix to categorize (cluster) differentially expressed genes based on their meta-patterns for intuitive biological investigations.
Results: The superior performance of the proposed methods is shown in simulations as well as two real omics meta-analysis applications to demonstrate its insightful biological findings.
Availability and implementation: An R package AWFisher (calling C++) is available at Bioconductor and GitHub (https://github.com/Caleb-Huo/AWFisher), and all datasets and programing codes for this paper are available in the Supplementary Material.
Supplementary information: Supplementary data are available at Bioinformatics online.
© The Author(s) 2019. Published by Oxford University Press. All rights reserved. For permissions, please e-mail: journals.permissions@oup.com.
Figures
References
-
- Benjamini Y., Heller R. (2008) Screening for partial conjunction hypotheses. Biometrics, 64, 1215–1222. - PubMed
-
- Benjamini Y., Hochberg Y. (1995) Controlling the false discovery rate: a practical and powerful approach to multiple testing. J. R. Stat. Soc. Series B Methodol., 57, 289–300.
-
- Birnbaum A. (1954) Combining independent tests of significance. J. Am. Stat. Assoc., 49, 559–574.
