. 2019 Nov;19(6):1497-1515.
doi: 10.1111/1755-0998.13070. Epub 2019 Sep 9.

An evaluation of sequencing coverage and genotyping strategies to assess neutral and adaptive diversity

Affiliations

An evaluation of sequencing coverage and genotyping strategies to assess neutral and adaptive diversity

Badr Benjelloun et al. Mol Ecol Resour. 2019 Nov.

Abstract

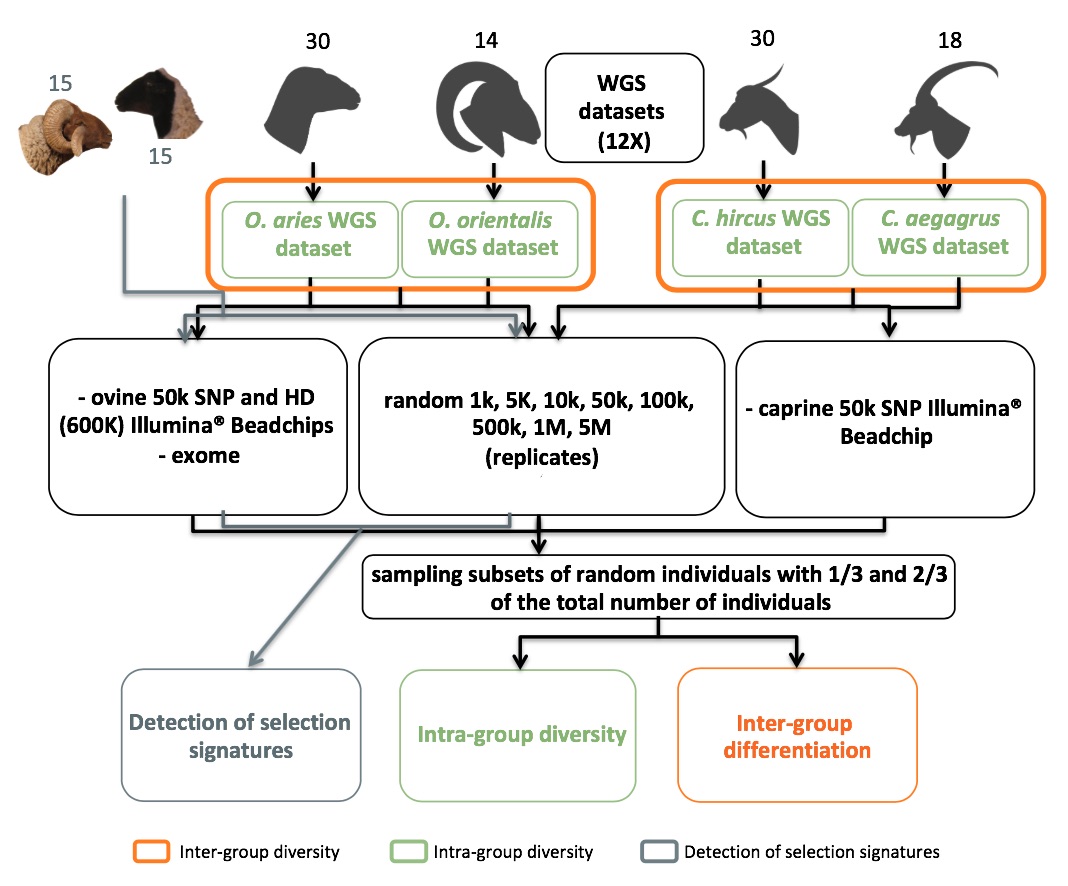
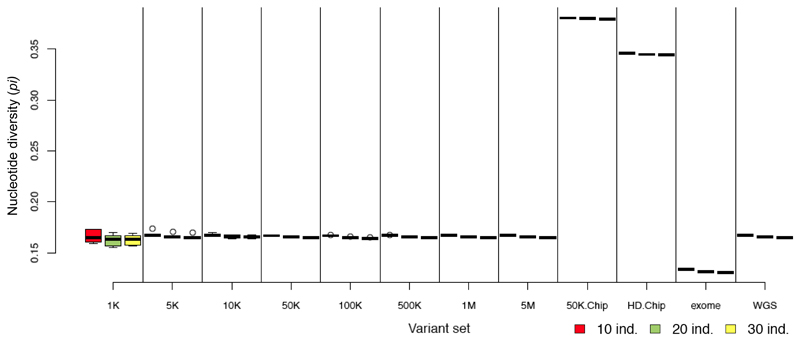
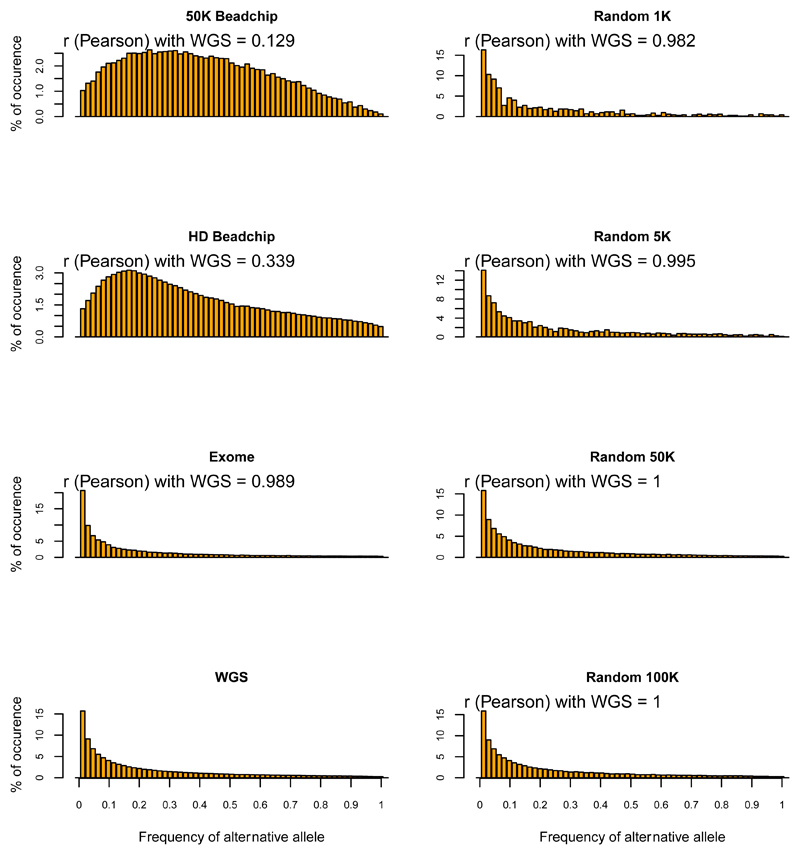
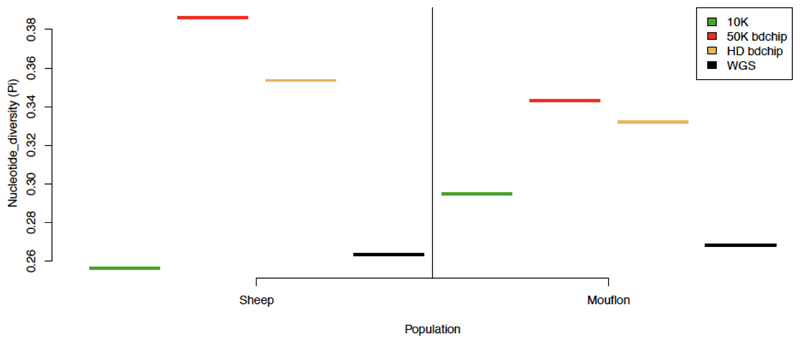
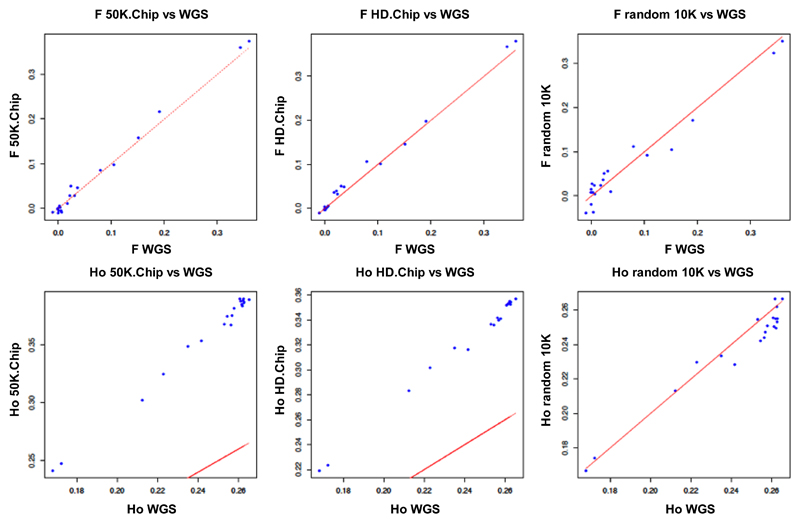
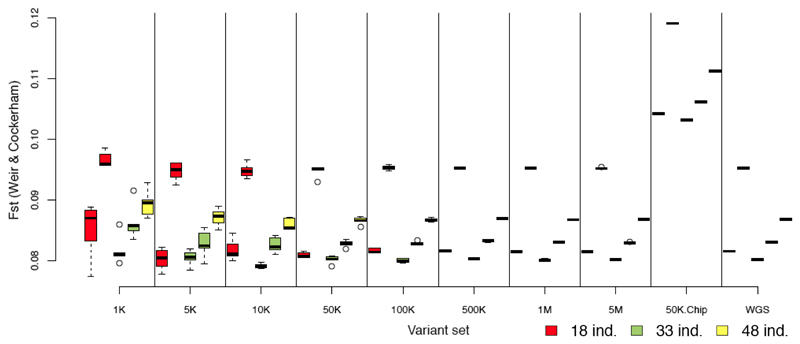
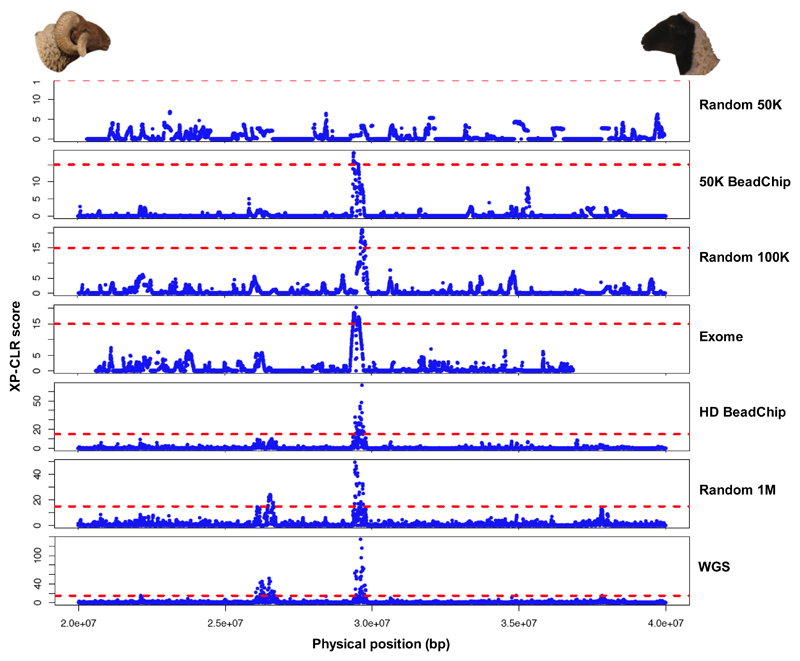
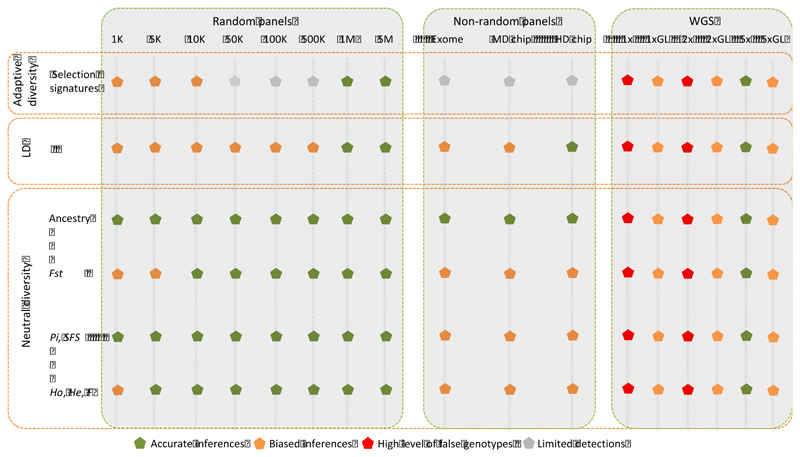
Whole genome sequences (WGS) greatly increase our ability to precisely infer population genetic parameters, demographic processes, and selection signatures. However, WGS may still be not affordable for a representative number of individuals/populations. In this context, our goal was to assess the efficiency of several SNP genotyping strategies by testing their ability to accurately estimate parameters describing neutral diversity and to detect signatures of selection. We analysed 110 WGS at 12× coverage for four different species, i.e., sheep, goats and their wild counterparts. From these data we generated 946 data sets corresponding to random panels of 1K to 5M variants, commercial SNP chips and exome capture, for sample sizes of five to 48 individuals. We also extracted low-coverage genome resequencing of 1×, 2× and 5× by randomly subsampling reads from the 12× resequencing data. Globally, 5K to 10K random variants were enough for an accurate estimation of genome diversity. Conversely, commercial panels and exome capture displayed strong ascertainment biases. Besides the characterization of neutral diversity, the detection of the signature of selection and the accurate estimation of linkage disequilibrium (LD) required high-density panels of at least 1M variants. Finally, genotype likelihoods increased the quality of variant calling from low coverage resequencing but proportions of incorrect genotypes remained substantial, especially for heterozygote sites. Whole genome resequencing coverage of at least 5× appeared to be necessary for accurate assessment of genomic variations. These results have implications for studies seeking to deploy low-density SNP collections or genome scans across genetically diverse populations/species showing similar genetic characteristics and patterns of LD decay for a wide variety of purposes.

Keywords: SNP chip; depth of coverage; genotyping-by-sequencing; mammals; population genomics; whole genome sequencing.


Figures

Figure 1
Figure 1. Flow-chart describing sampling random and non-random panels of variants and individuals.
Whole genome sequences are denoted by WGS.
Figure 2
Figure 2. Nucleotide diversity (π) in sheep calculated from WGS data and from random and non-random panels of variants.
Nucleotide diversity (π) was estimated for each replicate of the different numbers of variants of the random panels and for each non-random panel. Sample sizes varied for each estimate from 10 to 30 individuals. Random panels are denoted by their number of variants (from 1K to 5M) and non-random panels by: 50K.Chip (Illumina® ovine 50K SNP Beadchip), HD.Chip (Illumina® ovine HD Beadchip) exome (exome capture simulation), WGS (all variants extracted from whole genome sequences). For each panel of variants the sample sizes are from left to right: 10 (red), 20 (green) and 30 (yellow) individuals.
Figure 3
Figure 3. Site frequency spectra (SFS) in sheep inferred from WGS data and from random and non-random panels of variants.
Site frequency spectra were estimated using different random and non-random panels for 30 sheep. Random panels are denoted by their number of variants (from 1K to 5M) and non-random panels by: 50K.Beadchip (Illumina® ovine 50K SNP Beadchip), HD.Beadchip (Illumina® ovine HD Beadchip) exome (exome capture simulation), WGS (all variants extracted from whole genome sequences). Pearson correlation coefficients with the WGS inferences are shown for each panel.
Figure 4
Figure 4. Nucleotide diversity (π) estimated in two Ovis groups with random and commonly used panels of variants.
Plot of Nucleotide diversity (π) estimated with a random set of 10K variants sampled in sheep data (10K), and with Illumina® ovine 50K SNP Beadchip (50K.Chip), Illumina® ovine HD Beadchip (HD.Chip), and variants extracted from whole genome sequences (WGS).
Figure 5
Figure 5. Estimates of individual inbreeding coefficient (F) and observed heterozygosity (Ho) from different panels of variants compared to WGS data estimates in sheep.
Plot of individual inbreeding coefficient (F; top) and observed Heterozygosity (Ho; bottom) estimated with variants extracted from whole genome sequences (WGS) versus inferences with Illumina® ovine 50K SNP Beadchip (50K.Chip), Illumina® ovine HD Beadchip (HD.Chip), and 1 set of 10K variants defined in Moroccan sheep (random 10K). The red lines represent the relationship for which the estimates of the different panels are identical to the ones of WGS inferences.
Figure 6
Figure 6. Fixation index (Fst) between Moroccan goats and Bezoar ibex for different panels of variants and different samples of individuals.
The fixation index Fst (Weir & Cockerham, 1984) was estimated for each random panel for the 5 independent replicates, and for each non-random dataset for each sample size. Random panels are denoted by their number of variants (from 1K to 5M) and non-random panels by: 50K.Chip (Illumina® caprine 50K SNP Beadchip), WGS (all variants extracted from whole genome sequences). For each panel of variants the sample sizes are from left to right: 18 (red), 33 (green) and 48 (yellow) individuals.
Figure 7
Figure 7. XP-CLR scores calculated along the 20M-40M bp segment on chromosome 10 in a horned-polled Moroccan sheep comparison for different sets of variants.
The two peaks of XP-CLR scores showed in the WGS data plot are located respectively in the two genes NBEA (chr 10: 26,007,917 - 26,592,574) and MAB21L1 (chr 10: 26,231,353 - 26,232,432) and in the RXFP2 gene (chr 10: 29,454,677 - 29,502,617 bp). The horizontal dashed line represents a XP-CLR score of 15 to represent a scale among the different plots.
Figure 8
Figure 8. Efficiency and accuracy of different genotyping strategies
For each purpose, the different strategies are rated according to the accuracy of the estimates taking as a reference the WGS 12x depth inferences. Grey dots indicate that the genotyping approach allow detecting some selection signatures but could miss some further signals detected by high density panels and WGS (12x depth) data. MD chip = 50K SNP BeadChip (caprine and ovine); HD chip = 600K SNP Ovine BeadChip. Low and medium re-sequencing coverages are represented by: (i) classical variant calling and filtering denoted by 1x, 2x and 5x and (ii) variant discovery based on genotype likelihoods denoted by 1xGL, 2xGL and 5xGL.

Similar articles

Cited by

  • An 85K SNP Array Uncovers Inbreeding and Cryptic Relatedness in an Antarctic Fur Seal Breeding Colony.
    Humble E, Paijmans AJ, Forcada J, Hoffman JI. Humble E, et al. G3 (Bethesda). 2020 Aug 5;10(8):2787-2799. doi: 10.1534/g3.120.401268. G3 (Bethesda). 2020. PMID: 32540866 Free PMC article.
  • Genomic Uniqueness of Local Sheep Breeds From Morocco.
    Ouhrouch A, Boitard S, Boyer F, Servin B, Da Silva A, Pompanon F, Haddioui A, Benjelloun B. Ouhrouch A, et al. Front Genet. 2021 Dec 2;12:723599. doi: 10.3389/fgene.2021.723599. eCollection 2021. Front Genet. 2021. PMID: 34925440 Free PMC article.
  • Genomic Characterization and Initial Insight into Mastitis-Associated SNP Profiles of Local Latvian Bos taurus Breeds.
    Gudra D, Valdovska A, Jonkus D, Galina D, Kairisa D, Ustinova M, Viksne K, Fridmanis D, Kalnina I. Gudra D, et al. Animals (Basel). 2023 Aug 31;13(17):2776. doi: 10.3390/ani13172776. Animals (Basel). 2023. PMID: 37685039 Free PMC article.
  • Genomic diversity of the locally developed Latvian Darkheaded sheep breed.
    Gudra D, Valdovska A, Kairisa D, Galina D, Jonkus D, Ustinova M, Viksne K, Kalnina I, Fridmanis D. Gudra D, et al. Heliyon. 2024 May 16;10(10):e31455. doi: 10.1016/j.heliyon.2024.e31455. eCollection 2024 May 30. Heliyon. 2024. PMID: 38807890 Free PMC article.
  • Unlocking the African bioeconomy and strengthening biodiversity conservation through genomics and bioinformatics.
    Hayah I, Ezebuiro V, Kagame SP, Kuja JO, Waruhiu C, Nesengani LT, Mdyogolo S, Molotsi AH, Abechi P, Abushady AM, Amor N, Andika B, Barakat A, Beedessee G, Botes M, David X, Ebuzoeme N, Edea Z, El Allali A, Elekima OP, Elsherif AK, Gaouar SBS, Gebre YG, Georgewill OA, Hadjeras L, Hassan MA, Hijri M, Houaga I, Ideozu JE, Igoh M, Iwundu MP, Jaffer Ali SAS, Jaouani A, Kermouni Serradj AM, Khedim R, Kilian M, Kivuva DM, Knidiri M, Koukoura KK, Kwasi ER, Labuschagne K, Mafwila AL, Mensah I, Modebelu U, Mokgokong P, Mokhtar MM, Muzemil S, Nigussie H, Ntui VO, Ogwang J, Olivier NA, Olufowobi O, Omotoriogun TC, Folarin O, Eromon P, Orina J, Ouardi F, Parish T, Peter M, Potgieter J, Radouani F, Ramantswana M, Reda SRA, Salifu SP, Schwartz SB, Shabangu N, Sharaf A, Siminialayi IM, Smith RM, Taniguchi H, Tari-Ukuta PM, Tesfaye K, Tmimi FZ, Tonfack LB, Udensi OU, Wambua VW, Wambua S, Were K, Wood TT, Wurdeman BM, Zoclanclounon YAB, Adu AF, Gillis-Harry SL, Opoku NKO, Tshilate TS, Dede S, Minimah SO, Tchiechoua YH, Gisel A, Hamdi C, Mafokwane T, Odogwu BA, Nwachukwu G, Mungloo-Dilmohamud Z, Ghodhbane-Gtari F, Ibeachu C, Zipfel RD, Madu WC, Okorocha JC, Masebe T, Borgbara K, Goosen W, Fortuin S,… See abstract for full author list ➔ Hayah I, et al. NPJ Biodivers. 2025 Jul 29;4(1):29. doi: 10.1038/s44185-025-00102-9. NPJ Biodivers. 2025. PMID: 40730905 Free PMC article. Review.

References

    1. Ai H, Huang L, Ren J. Genetic Diversity, Linkage Disequilibrium and Selection Signatures in Chinese and Western Pigs Revealed by Genome-Wide SNP Markers. Plos One. 2013;8(2) doi: 10.1371/journal.pone.0056001. - DOI - PMC - PubMed
    1. Albrechtsen A, Nielsen FC, Nielsen R. Ascertainment Biases in SNP Chips Affect Measures of Population Divergence. Molecular Biology and Evolution. 2010;27(11):2534–2547. doi: 10.1093/molbev/msq148. - DOI - PMC - PubMed
    1. Alex Buerkle C, Gompert Z. Population genomics based on low coverage sequencing: how low should we go? Molecular ecology. 2013;22(11):3028–3035. doi: 10.1111/mec.12105. - DOI - PubMed
    1. Alhaddad H, Khan R, Grahn RA, Gandolfi B, Mullikin JC, Cole SA, et al. Lyons LA. Extent of Linkage Disequilibrium in the Domestic Cat, Felis silvestris catus, and Its Breeds. Plos One. 2013;8(1) doi: 10.1371/journal.pone.0053537. - DOI - PMC - PubMed
    1. Altshuler DM, Durbin RM, Abecasis GR, Bentley DR, Chakravarti A, Clark AG, et al. Genomes Project, C An integrated map of genetic variation from 1,092 human genomes. Nature. 2012;491(7422):56–65. doi: 10.1038/nature11632. - DOI - PMC - PubMed