. 2019 Jun 4;15(8):1637-1653.
doi: 10.7150/ijbs.33790. eCollection 2019.

PERK/eIF-2α/CHOP Pathway Dependent ROS Generation Mediates Butein-induced Non-small-cell Lung Cancer Apoptosis and G2/M Phase Arrest

Affiliations

PERK/eIF-2α/CHOP Pathway Dependent ROS Generation Mediates Butein-induced Non-small-cell Lung Cancer Apoptosis and G2/M Phase Arrest

Shouyin Di et al. Int J Biol Sci. .

Abstract

Butein, a member of the chalcone family, is a potent anticarcinogen against multiple cancers, but its specific anti-NSCLC mechanism remains unknown. The present study examined the effects of butein treatment on NSCLC cell lines and NSCLC xenografts. Butein markedly decreased NSCLC cell viability; inhibited cell adhesion, migration, invasion, and colony forming ability; and induced cell apoptosis and G2/M phase arrest in NSCLC cells. Moreover, butein significantly inhibited PC-9 xenograft growth. Both in vivo and in vitro studies verified that butein exerted anti-NSCLC effect through activating endoplasmic reticulum (ER) stress-dependent reactive oxygen species (ROS) generation. These pro-apoptotic effects were reversed by the use of 4- phenylbutyric acid (4-PBA), CHOP siRNA, N-acetyl-L-cysteine (NAC) and Z-VAD-FMK (z-VAD) in vitro. Moreover, inhibition of ER stress markedly reduced ROS generation. In addition, in vivo studies further confirmed that inhibition of ER stress or oxidative stress partially abolished the butein-induced inhibition of tumor growth. Therefore, butein is a potential therapeutic agent for NSCLC, and its anticarcinogenic action might be mediated by ER stress-dependent ROS generation and the apoptosis pathway.

Keywords: Apoptosis; Butein; Endoplasmic reticulum stress; Non-small-cell lung cancer; Oxidative stress.


Conflict of interest statement

Competing Interests: The authors have declared that no competing interest exists.

Figures

Figure 1
Figure 1
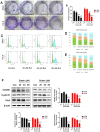
Effects of butein treatment on NSCLC cell viability and adhesion, migration, invasion ability. (A) Morphology of A549 and PC-9 cells after butein treatment for 24 h. (B) Viability of NSCLC cells and HBE cells after exposed to butein for 24 h. (C) Viability of NSCLC cells and HBE cells after exposed to butein for 48 h. The results are expressed as the mean ± SEM, n=6. aP < 0.05 versus control group, bP < 0.05 versus 20 μM butein group, cP < 0.05 versus 40 μM butein group. (D) Representative adhesion images of A549 and PC-9 cells after butein treatment. (E) The adhesion ability of A549 and PC-9 cells after butein treatment. (F) Representative wound healing images of A549 and PC-9 cells after butein treatment. (G) The migration ability of A549 and PC-9 cells after butein treatment. (H) Representative matrigel invasion images of A549 and PC-9 cells after butein treatment. (I) The migration ability of A549 and PC-9 cells after butein treatment. In Figure D-I, the results are expressed as the mean ± SEM, n=6. aP < 0.05 versus control group, bP < 0.05 versus 5 μM butein group, cP < 0.05 versus 10 μM butein group.
Figure 2
Figure 2
Effects of butein treatment on NSCLC cell proliferation ability and cell cycle distribution. (A) Representative images of clonogenic survival assay after butein treatment. (B) The clonogenicity of A549 and PC-9 cells after butein treatment. the results are expressed as mean ± SEM, n=6. aP < 0.05 versus control group, bP < 0.05 versus 5 μM butein group, cP < 0.05 versus 10 μM butein group. (C) Representative images of cell cycle distribution after butein treatment. (D) Cell cycle distribution of A549 cells after butein treatment. (E) Cell cycle distribution of PC-9 cells after butein treatment. (F) Expressions of cell cycle markers. In Figure C-F, all of the results are expressed as mean ± SEM, n=6. aP < 0.05 versus control group, bP < 0.05 versus 20 μM butein group, cP < 0.05 versus 40 μM butein group.
Figure 3
Figure 3
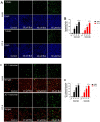
Effects of butein treatment on NSCLC cell apoptosis rate and MMP. (A) Representative images of A549 and PC-9 TUNEL staining. (B) Analysis of A549 and PC-9 apoptosis rate. (C) Representative images of A549 and PC-9 MMP detection. (D) Analysis of A549 and PC-9 MMP lose. All of the results are expressed as mean ± SEM, n=6. aP < 0.05 versus control group, bP < 0.05 versus 20 μM butein group, cP < 0.05 versus 40 μM butein group.
Figure 4
Figure 4
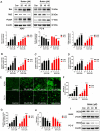
Effects of butein treatment on NSCLC cell apoptosis pathways and oxidative stress. (A) Expressions of apoptosis associated proteins. (B) Analysis of caspase-3 activities. (C) Analysis of caspase-8 activities. (D) Analysis of caspase-9 activities. (E) Representative images of cellular ROS detection in A549 and PC-9 cells. (F) Analysis of ROS level in A549 and PC-9 cells. (G) Analysis of NADPH oxidase activities. (H) Analysis of GSH concentrations. (I) Expressions of SOD2. All of the results are expressed as the mean ± SEM, n=6. aP < 0.05 versus control group, bP < 0.05 versus 20 μM butein group, cP < 0.05 versus 40 μM butein group.
Figure 5
Figure 5
Effects of butein treatment on NSCLC cell ER stress pathways. (A) Representative Heatmap of gene expression levels. The black arrows indicate ER stress associated genes; the red arrows indicate apoptosis associated genes. (B-C) Representative bands and quantitative analysis of ER stress markers are shown. All of the results are expressed as the mean ± SEM, n=6. aP < 0.05 versus Control, bP < 0.05 versus 20 μM butein group, cP < 0.05 versus 40 μM butein group.
Figure 6
Figure 6
Effects of ER stress inhibition on butein induced NSCLC cell apoptosis. (A) Representative band and quantitative analysis of ER stress markers. (B) Cell viability of PC-9 cells. (C) ROS detection in PC-9 cells. (D) Apoptosis detection via TUNEL staining in PC-9 cells. (E) Analysis of activities of caspase-3, caspase-8 and caspase-9 in PC-9 cells. (F) Representative bands and quantitative analysis of apoptosis associated proteins. All of the results are expressed as the mean ± SEM, n=6. ***P < 0.01.
Figure 7
Figure 7
Effects of NAC or z-VAD treatment on butein induced anti-NSCLC activity. (A) Cell viability of PC-9 cells after co-treatment of butein and NAC. (B) ROS detection in PC-9 cells. (C) Apoptosis rate detection via TUNEL staining in PC-9 cells. (D) Representative bands and quantitative analysis of apoptosis associated proteins. (E) Representative images and analysis of cell cycle distribution of PC-9 cells. All of the results in (A-E) are expressed as the mean ± SEM, n=6. aP < 0.05 versus Control group, bP < 0.05 versus NAC group, cP < 0.05 versus butein group. (F) Cell viability of PC-9 cells after co-treatment of butein and z-VAD. (G) Apoptosis detection via TUNEL staining in PC-9 cells. All of the results in (F, G) are expressed as the mean ± SEM, n=6. aP < 0.05 versus Control group, bP < 0.05 versus z-VAD group, cP < 0.05 versus butein group.
Figure 8
Figure 8
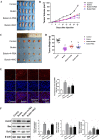
Inhibitory effects of butein on in vivo xenografts and the role of ER strass and ROS generation. PC-9 cells were subcutaneously injected into right rear limbs. Over the course of 22 days, butein significantly suppressed the growth of PC-9 tumor xenografts compared to the vehicle control; Co-treatment of 4-PBA or NAC impaired this effect. (A) Photograph of the nude mice on day 22. (B) Tumor volumes of the xenografts. (C) Photographs of the collected xenografts following 22 days of treatment. (D) Tumor weights of the collected xenografts. (E) Immunofluorescent staining of apoptosis associated protein PUMA. (E) Representative band and quantitative analysis of apoptosis associated proteins. All of the results are expressed as the mean ± SEM, n=6. aP < 0.05 versus Control group, bP < 0.05 versus butein group.
Figure 9
Figure 9
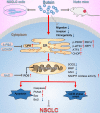
Schematic diagram summarizing the anti-NSCLC action of butein via activation of ER stress and ROS generation. The in vivo and in vitro experiments showed that butein triggered ER stress and upregulated p-PERK, p-eIF2α levels and ATF4, CHOP, IRE1α, XBP1 expressions. Activation of ER stress further induced oxidative stress, indicated by increased ROS concentration, down-regulated SOD2 expression, decreased the MMP, decreased GSH and increased NADPH oxidase activity, which contributed to cell apoptosis, cell cycle arrest and inhibition of tumor behaviors. However, administration of 4-PBA, CHOP siRNA or NAC partially blocked the anti-NSCLC action of butein. Butein also inhibited cell adhesion, migration and invasion, and the underlying mechanisms still needs further investigation.

Similar articles

Cited by

References

    1. Ettinger DS, Akerley W, Borghaei H. et al. Non-small cell lung cancer, version 2.2013. Journal of the National Comprehensive Cancer Network: JNCCN. 2013;11:645–53. - PubMed
    1. Devarakonda S, Morgensztern D, Govindan R. Genomic alterations in lung adenocarcinoma. The Lancet Oncology. 2015;16:e342–51. - PubMed
    1. Pandey MK, Sandur SK, Sung B. et al. Butein, a tetrahydroxychalcone, inhibits nuclear factor (NF)-kappaB and NF-kappaB-regulated gene expression through direct inhibition of IkappaBalpha kinase beta on cysteine 179 residue. The Journal of biological chemistry. 2007;282:17340–50. - PubMed
    1. Alshammari GM, Balakrishnan A, Chinnasamy T. Butein protects the nonalcoholic fatty liver through mitochondrial reactive oxygen species attenuation in rats. BioFactors. 2018;44:289–98. - PubMed
    1. Bai X, Ma Y, Zhang G. Butein suppresses cervical cancer growth through the PI3K/AKT/mTOR pathway. Oncology reports. 2015;33:3085–92. - PubMed

Publication types

MeSH terms