

Nephropathy in Hypertensive Animals Is Linked to M2 Macrophages and Increased Expression of the YM1/Chi3l3 Protein
- PMID: 31360120
- PMCID: PMC6652056
- DOI: 10.1155/2019/9086758
Nephropathy in Hypertensive Animals Is Linked to M2 Macrophages and Increased Expression of the YM1/Chi3l3 Protein
Abstract
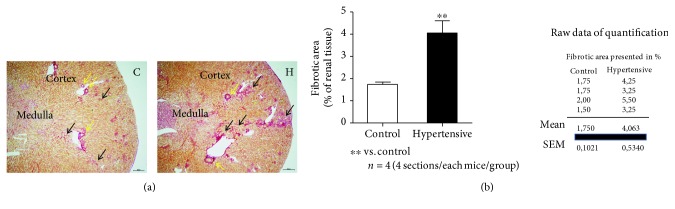
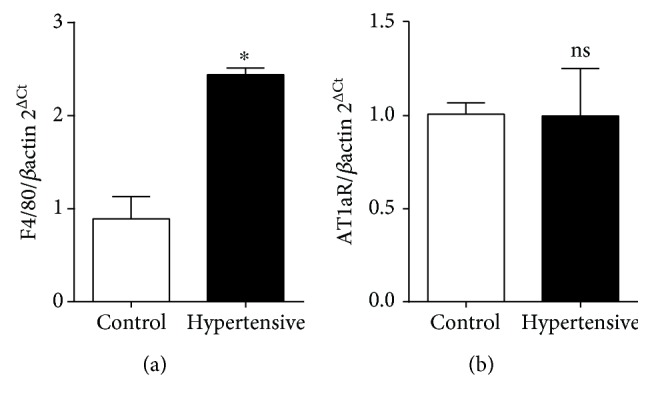
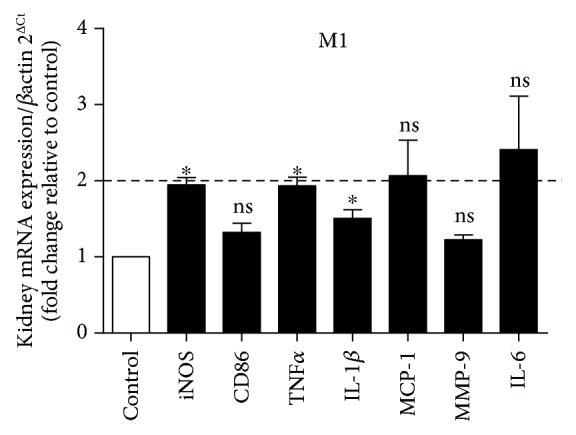
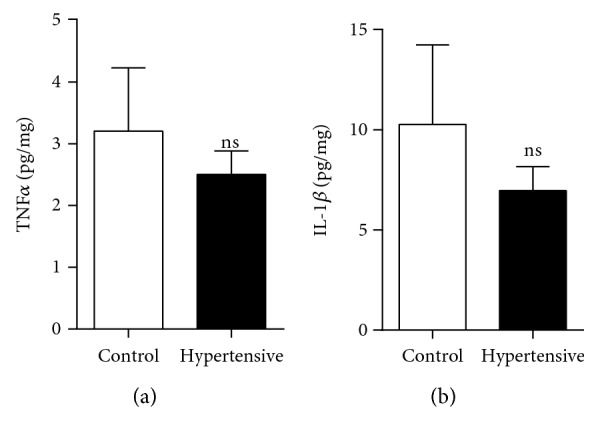
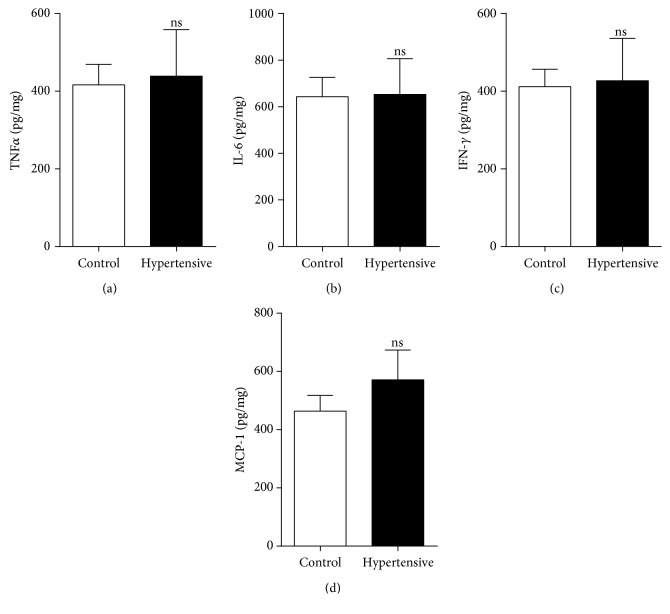
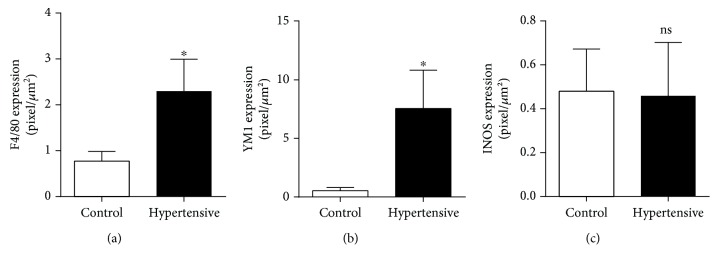
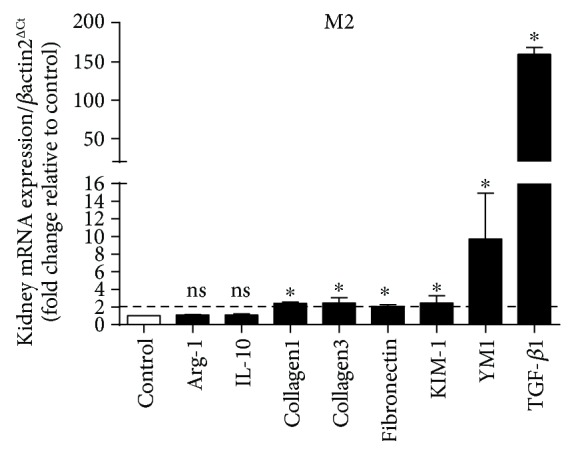
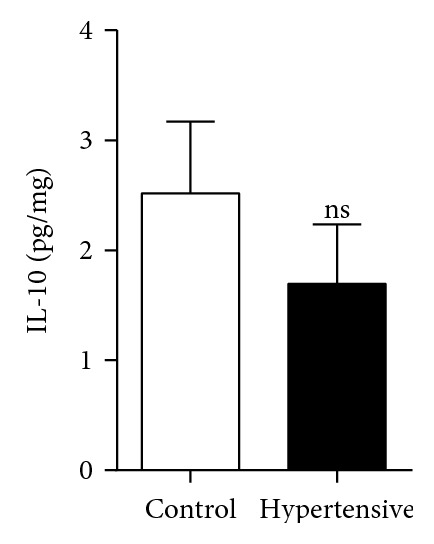
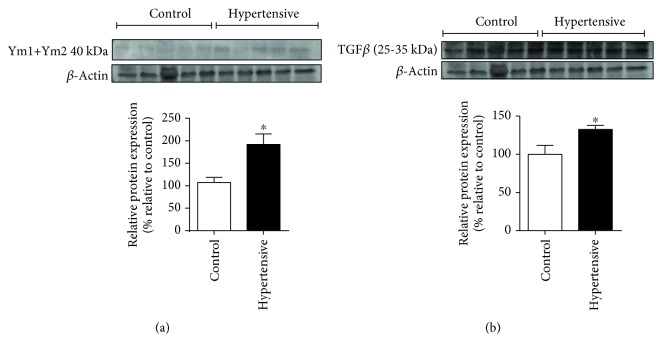
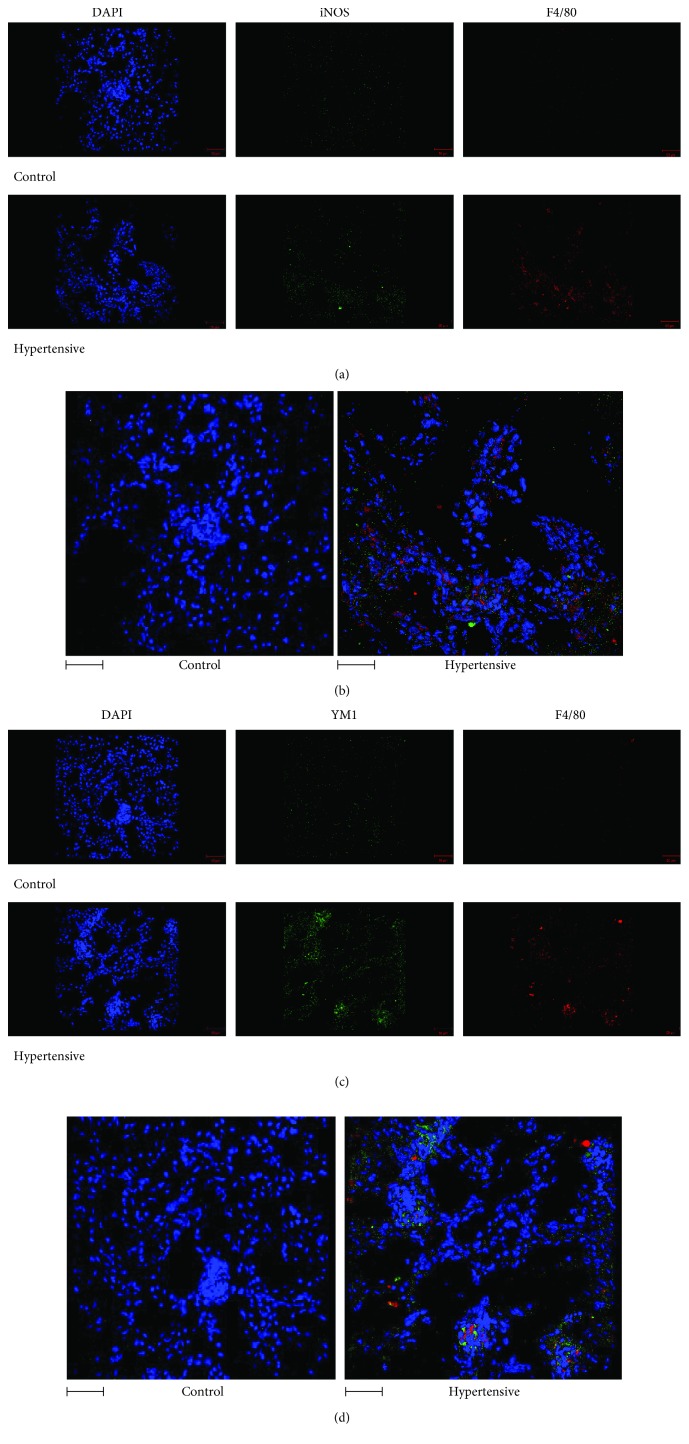
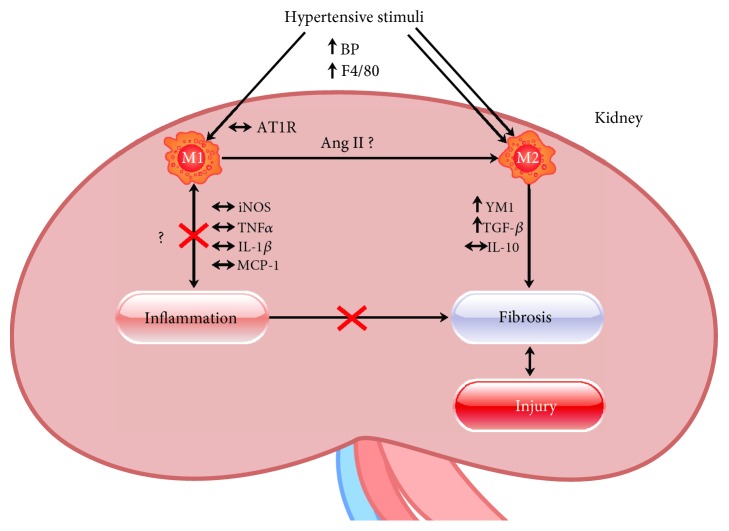
Macrophages contribute to a continuous increase in blood pressure and kidney damage in hypertension, but their polarization status and the underlying mechanisms have not been clarified. This study revealed an important role for M2 macrophages and the YM1/Chi3l3 protein in hypertensive nephropathy in a mouse model of hypertension. Bone marrow cells were isolated from the femurs and tibia of male FVB/N (control) and transgenic hypertensive animals that overexpressed the rat form of angiotensinogen (TGM(rAOGEN)123, TGM123-FVB/N). The cells were treated with murine M-CSF and subsequently with LPS+IFN-γ to promote their polarization into M1 macrophages and IL-4+IL-13 to trigger the M2 phenotype. We examined the kidneys of TGM123-FVB/N animals to assess macrophage polarization and end-organ damage. mRNA expression was evaluated using real-time PCR, and protein levels were assessed through ELISA, CBA, Western blot, and immunofluorescence. Histology confirmed high levels of renal collagen. Cells stimulated with LPS+IFN-γ in vitro showed no significant difference in the expression of CD86, an M1 marker, compared to cells from the controls or the hypertensive mice. When stimulated with IL-4+IL-13, however, macrophages of the hypertensive group showed a significant increase in CD206 expression, an M2 marker. The M2/M1 ratio reached 288%. Our results indicate that when stimulated in vitro, macrophages from hypertensive mice are predisposed toward polarization to an M2 phenotype. These data support results from the kidneys where we found an increased infiltration of macrophages predominantly polarized to M2 associated with high levels of YM1/Chi3l3 (91,89%), suggesting that YM1/Chi3l3 may be a biomarker of hypertensive nephropathy.
Figures

Similar articles
-
[Adipose-derived stem cells promote the polarization from M1 macrophages to M2 macrophages].Xi Bao Yu Fen Zi Mian Yi Xue Za Zhi. 2016 Mar;32(3):332-8. Xi Bao Yu Fen Zi Mian Yi Xue Za Zhi. 2016. PMID: 26927552 Chinese.
-
[Spleen-derived CD4+ T cells of asthmatic mice promote M2 polarization of macrophages in vitro].Xi Bao Yu Fen Zi Mian Yi Xue Za Zhi. 2019 Apr;35(4):289-295. Xi Bao Yu Fen Zi Mian Yi Xue Za Zhi. 2019. PMID: 31167686 Chinese.
-
Expression of chitinase-like proteins in the skin of chronic proliferative dermatitis (cpdm/cpdm) mice.Exp Dermatol. 2006 Oct;15(10):808-14. doi: 10.1111/j.1600-0625.2006.00483.x. Exp Dermatol. 2006. PMID: 16984263
-
An update on Ym1 and its immunoregulatory role in diseases.Front Immunol. 2022 Jul 28;13:891220. doi: 10.3389/fimmu.2022.891220. eCollection 2022. Front Immunol. 2022. PMID: 35967383 Free PMC article. Review.
-
Inflammatory macrophages in the kidney contribute to salt-sensitive hypertension.Am J Physiol Renal Physiol. 2020 Mar 1;318(3):F544-F548. doi: 10.1152/ajprenal.00454.2019. Epub 2020 Jan 27. Am J Physiol Renal Physiol. 2020. PMID: 31984790 Free PMC article. Review.
Cited by
-
Effect of botanical drugs in improving symptoms of hypertensive nephropathy: Analysis of real-world data, retrospective cohort, network, and experimental assessment.Front Pharmacol. 2023 Apr 4;14:1126972. doi: 10.3389/fphar.2023.1126972. eCollection 2023. Front Pharmacol. 2023. PMID: 37089916 Free PMC article.
-
[Interleukin-17A is closely correlated with the progression of renal epithelial-mesenchymal transition in spontaneously hypertensive rats].Nan Fang Yi Ke Da Xue Xue Bao. 2022 May 20;42(5):772-779. doi: 10.12122/j.issn.1673-4254.2022.05.21. Nan Fang Yi Ke Da Xue Xue Bao. 2022. PMID: 35673924 Free PMC article. Chinese.
-
Mechanisms of inflammation modulation by different immune cells in hypertensive nephropathy.Front Immunol. 2024 Mar 13;15:1333170. doi: 10.3389/fimmu.2024.1333170. eCollection 2024. Front Immunol. 2024. PMID: 38545112 Free PMC article. Review.
-
Therapeutic effect of YiQi HuoXue BuShen decoction combined with Western medicine on hypertensive nephropathy: a meta-analysis.Am J Transl Res. 2023 Jun 15;15(6):3815-3824. eCollection 2023. Am J Transl Res. 2023. PMID: 37434822 Free PMC article. Review.
-
Advance on Chinese Medicine for Hypertensive Renal Damage: Focus on the Complex Molecular Mechanisms.Chin J Integr Med. 2024 Oct;30(10):938-948. doi: 10.1007/s11655-024-3662-3. Epub 2024 Jul 3. Chin J Integr Med. 2024. PMID: 38958884 Review.
References
MeSH terms
Substances
LinkOut - more resources
Full Text Sources
Medical
Research Materials
Miscellaneous
