

Association of systolic blood pressure and pulse pressure with microalbuminuria in treatment-naïve hypertensive patients
- PMID: 31360177
- PMCID: PMC6657244
- DOI: 10.5114/aoms.2018.77727
Association of systolic blood pressure and pulse pressure with microalbuminuria in treatment-naïve hypertensive patients
Abstract
Introduction: To investigate the association between blood pressure components and microalbuminuria (MAU) in newly diagnosed and treatment-naïve hypertensive patients.
Material and methods: A total of 1858 newly diagnosed and treatment-naïve hypertensive patients were enrolled. Based on 24 h urine albumin concentration, all patients were divided into MAU and normo-albuminuria groups. The associations between blood pressure (BP) components, namely systolic/diastolic BP (SBP/DBP) and pulse pressure (PP) and MAU, as well as the sensitivity and specificity of each BP component in predicting MAU, were evaluated.
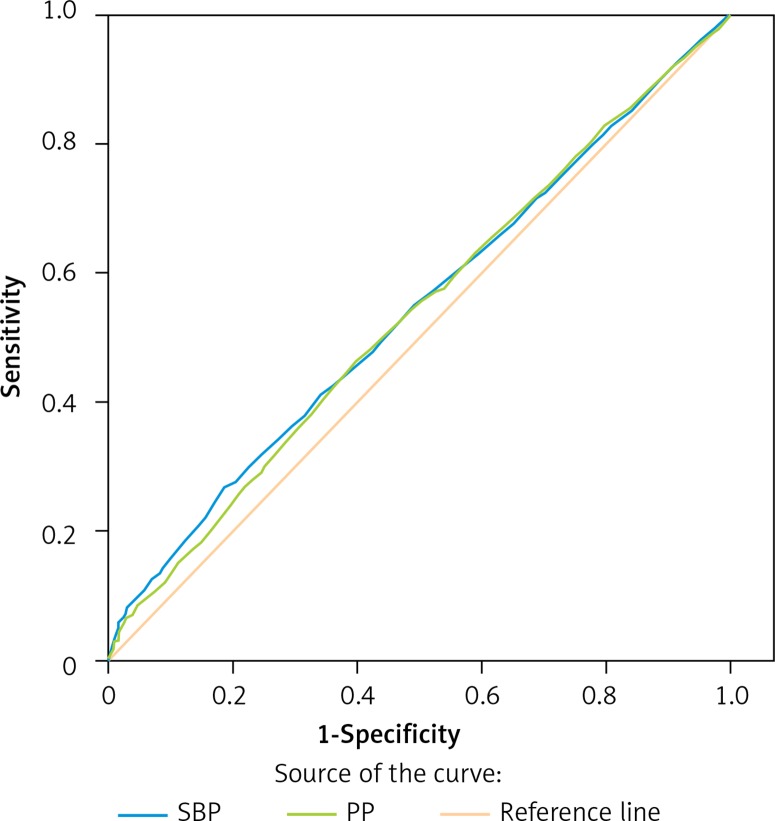
Results: Compared to the normo-albuminuria group, patients in the MAU group were older and had significantly higher SBP and PP (p < 0.05). Serum levels of fasting blood glucose, total protein and creatinine were significantly higher in the MAU group (p < 0.05). 24-hour urine albumin excretion was significantly higher in the MAU group than the normo-albuminuria group (182.5 ±156.5 mg vs. 17.6 ±7.1 mg, p < 0.001). Logistic regression analyses revealed that SBP and PP were significantly associated with MAU, with an odds ratio (OR) of 1.010 (95% confidence interval (CI): 1.005-1.016, p < 0.001) in SBP and OR of 1.009 (95% CI: 1.003-1.015, p = 0.003) in PP. The receiver operating characteristic curve showed that the area under the curve for SBP to predict MAU was 0.541 ±0.013, and PP was 0.536 ±0.013. The difference in predicting MAU by SBP or PP was non-significant.
Conclusions: In newly diagnosed and treatment-naïve hypertensive patients, increased SBP and PP were independently associated with MAU.
Keywords: arterial hypertension; blood pressure; microalbuminuria.
Conflict of interest statement
The authors declare no conflict of interest.
Figures
Similar articles
-
Association Between Plasma Homocysteine and Microalbuminuria in Untreated Patients with Essential Hypertension: a Case-Control Study.Kidney Blood Press Res. 2017;42(6):1303-1311. doi: 10.1159/000486013. Epub 2017 Dec 15. Kidney Blood Press Res. 2017. PMID: 29262410
-
[Metabolic syndrome and microalbuminuria accompanied with hyperglycemia in community subjects].Zhonghua Yi Xue Za Zhi. 2012 Sep 25;92(36):2526-9. Zhonghua Yi Xue Za Zhi. 2012. PMID: 23158790 Chinese.
-
Central diastolic blood pressure, plasma aldosterone and uric acid are associated with microalbuminuria in essential hypertension: a case-control study.BMC Cardiovasc Disord. 2023 Oct 17;23(1):511. doi: 10.1186/s12872-023-03515-1. BMC Cardiovasc Disord. 2023. PMID: 37848834 Free PMC article.
-
Subclinical Kidney Damage in Hypertensive Patients: A Renal Window Opened on the Cardiovascular System. Focus on Microalbuminuria.Adv Exp Med Biol. 2017;956:279-306. doi: 10.1007/5584_2016_85. Adv Exp Med Biol. 2017. PMID: 27873229 Review.
-
Hypertension and microalbuminuria: the new detrimental duo.Blood Press. 2004;13(4):198-211. doi: 10.1080/08037050410016456. Blood Press. 2004. PMID: 15581333 Review.
Cited by
-
High prevalence of albuminuria among adult males living with HIV in Botswana.Sci Rep. 2024 Jun 23;14(1):14432. doi: 10.1038/s41598-024-65099-w. Sci Rep. 2024. PMID: 38910157 Free PMC article.
References
-
- Kottke TE, Stroebel RJ, Hoffman RS. JNC 7--it’s more than high blood pressure. JAMA. 2003;289:2573–5. - PubMed
-
- Ettehad D, Emdin CA, Kiran A, et al. Blood pressure lowering for prevention of cardiovascular disease and death: a systematic review and meta-analysis. Lancet. 2016;387:957–67. - PubMed
-
- Xie X, Atkins E, Lv J, et al. Effects of intensive blood pressure lowering on cardiovascular and renal outcomes: updated systematic review and meta-analysis. Lancet. 2016;387:435–43. - PubMed
-
- Yano Y, Fujimoto S, Kramer H, et al. Long-term blood pressure variability, new-onset diabetes mellitus, and new-onset chronic kidney disease in the Japanese general population. Hypertension. 2015;66:30–6. - PubMed
LinkOut - more resources
Full Text Sources
Miscellaneous