Review
. 2019 May 24;10(24):6035-6071.
doi: 10.1039/c9sc01652j. eCollection 2019 Jun 28.

Fluorescent probes for organelle-targeted bioactive species imaging

Affiliations
Review

Fluorescent probes for organelle-targeted bioactive species imaging

Peng Gao et al. Chem Sci. .

Abstract

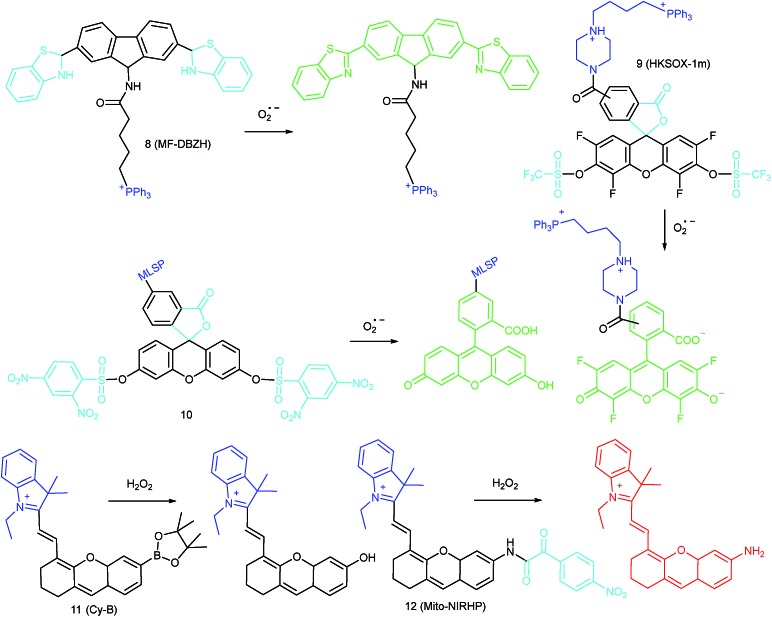
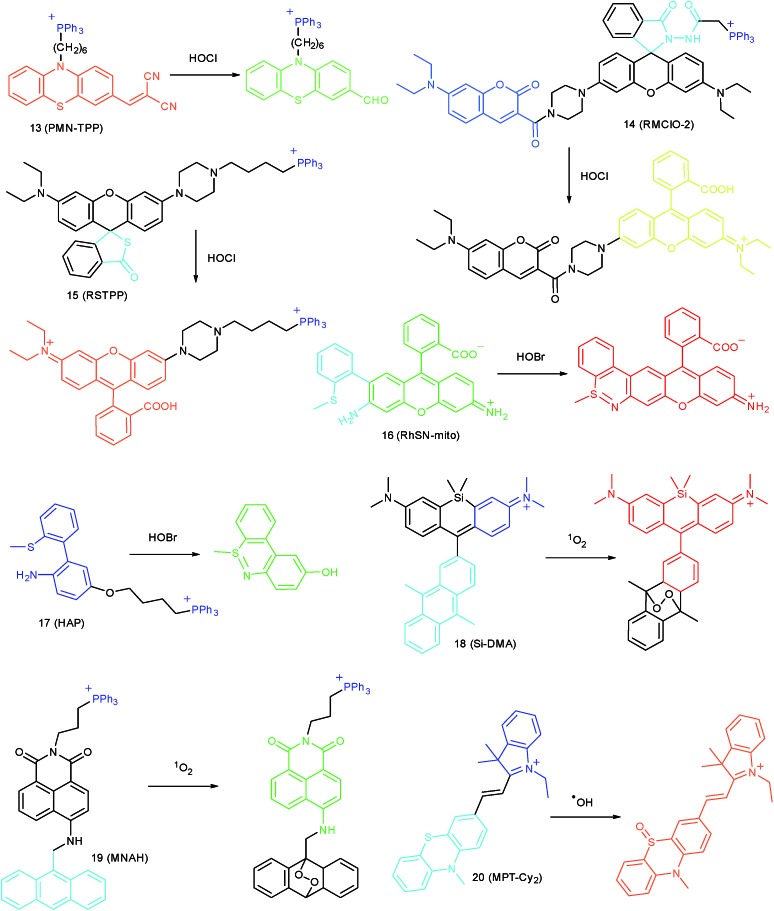
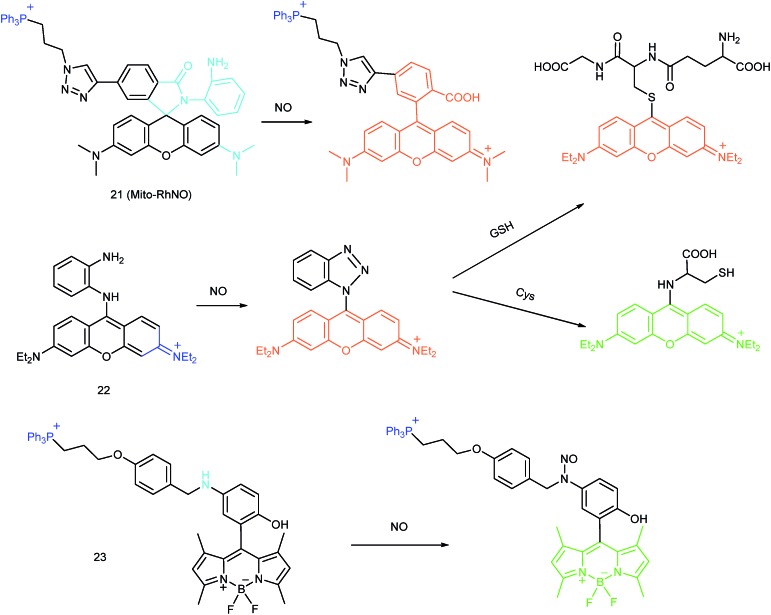
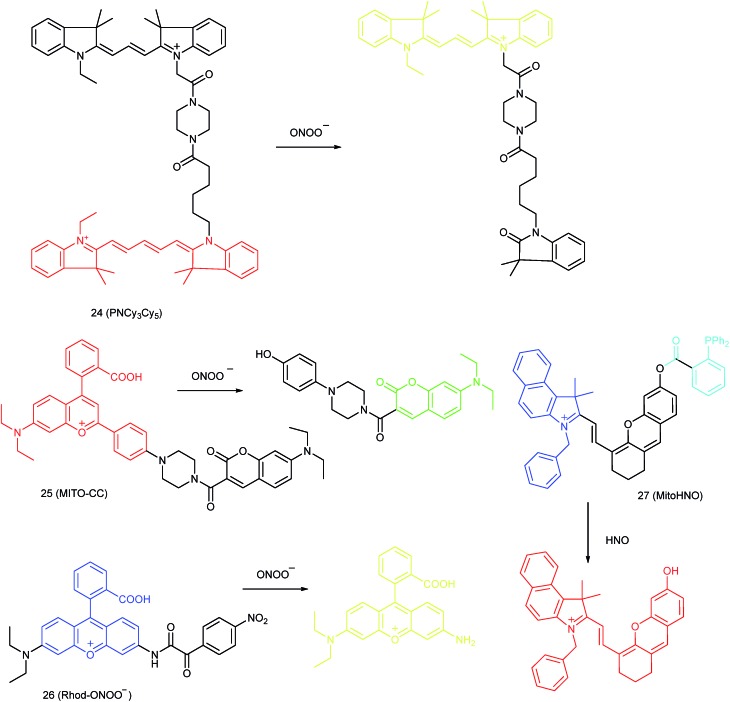
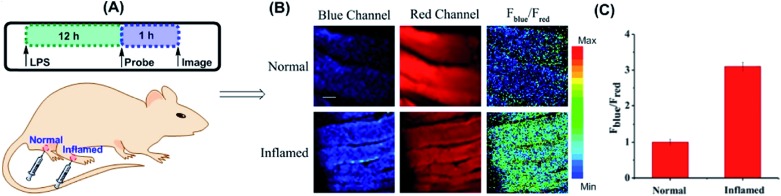
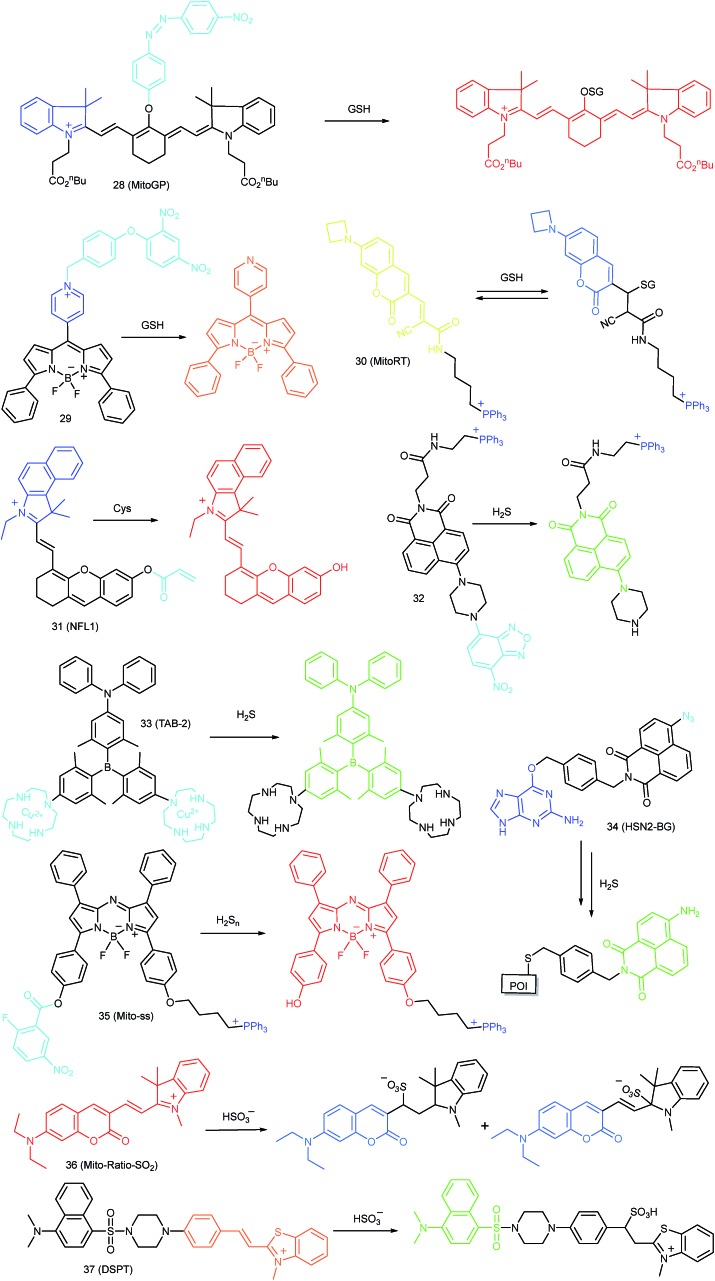
Bioactive species, including reactive oxygen species (ROS, including O2˙-, H2O2, HOCl, 1O2, ˙OH, HOBr, etc.), reactive nitrogen species (RNS, including ONOO-, NO, NO2, HNO, etc.), reactive sulfur species (RSS, including GSH, Hcy, Cys, H2S, H2S n , SO2 derivatives, etc.), ATP, HCHO, CO and so on, are a highly important category of molecules in living cells. The dynamic fluctuations of these molecules in subcellular microenvironments determine cellular homeostasis, signal conduction, immunity and metabolism. However, their abnormal expressions can cause disorders which are associated with diverse major diseases. Monitoring bioactive molecules in subcellular structures is therefore critical for bioanalysis and related drug discovery. With the emergence of organelle-targeted fluorescent probes, significant progress has been made in subcellular imaging. Among the developed subcellular localization fluorescent tools, ROS, RNS and RSS (RONSS) probes are highly attractive, owing to their potential for revealing the physiological and pathological functions of these highly reactive, interactive and interconvertible molecules during diverse biological events, which are rather significant for advancing our understanding of different life phenomena and exploring new technologies for life regulation. This review mainly illustrates the design principles, detection mechanisms, current challenges, and potential future directions of organelle-targeted fluorescent probes toward RONSS.


Figures

Fig. 1
Fig. 1. Structures of diverse commercialized organelle-labelling dyes and common groups for organelle-targeted probe design: (A) for nucleus, (B) for mitochondria, (C) for lysosomes, (D) for endoplasmic reticulum, (E) for Golgi apparatus and (F) substrates for protein tagging probes.
Fig. 2
Fig. 2. Response mechanisms for organelle-targeted probe design: (A) FRET, (B) PET, (C) ICT and (D) ESIPT.
Fig. 3
Fig. 3. Fluorescent probes for imaging RONSS in the nucleus.
Fig. 4
Fig. 4. CLSM ratio images of HeLa cells loaded with 50 μM 2 and stimulated with 200 μM H2O2 for (a) 0, (b) 15, (c) 30, (d) 60, and (e) 75 min at 37 °C. (f) The overlay image of (e) and the brightfield image. Adapted with permission from ref. 19. Copyright 2014 American Chemical Society.
Fig. 5
Fig. 5. Mitochondrion-targeted probes for O2˙ and H2O2 imaging.
Fig. 6
Fig. 6. TP microscopy images of mice with LPS-mediated abdomen injury using probe 8. (A) O2˙ was produced inside the peritoneal cavity of the mice during the LPS-mediated inflammatory response. (B) TP fluorescence in situ images of mice abdomen incubated with 8 (100 μM). Adapted with permission from ref. 35. Copyright 2013 American Chemical Society.
Fig. 7
Fig. 7. Fluorescence imaging (pseudocolor) of H2O2 in Kunming mice. (a) Only 12 (20 μM, 100 μL) was injected as a control. (b) Mouse pretreated with rotenone for 1 h and then injected with 12. (c) Mouse successively injected with rotenone, NAC, and 12. (d) Relative fluorescence intensities of (a–c). Adapted with permission from ref. 36c. Copyright 2013 American Chemical Society.
Fig. 8
Fig. 8. Mitochondrion-targeted probes for HOCl, HOBr, 1O2 and ˙OH imaging.
Fig. 9
Fig. 9. In vivo dual channel imaging of LPS and PMA treated nude mice with probe 13. Images were taken after stimulation for 0, 5, 10, 15, 20, 30, 45 and 60 min, respectively. Adapted with permission from ref. 38c. Copyright 2015 Royal Society of Chemistry.
Fig. 10
Fig. 10. In vivo fluorescence imaging of HOBr in zebrafish embryos. (a) Zebrafish fed with 16 for 30 min (50.0 μM), (b) zebrafish fed with Br (100 μM) for 30 min and then fed with 16 (50.0 μM) for 30 min, and (c) zebrafish incubated with NAC (20.0 μM) for 30 min and then with 16 (50.0 μM) for 30 min. (d)–(f) are the corresponding bright-field images of (a)–(c). Adapted with permission from ref. 43a. Copyright 2017 American Chemical Society.
Fig. 11
Fig. 11. Confocal fluorescence images of RAW264.7 cells stained with 5 μM 17 under different treatments: (a, f and k) control; (b, g and l) 20 μM O2˙; (c, h and m) 40 μM O2˙; (d, i and n) 60 μM O2˙; (e, j and o) 100 μM DIDS + 60 μM O2˙. (p) The corresponding Fblue/Fgreen. Adapted with permission from ref. 43b. Copyright 2018 Royal Society of Chemistry.
Fig. 12
Fig. 12. Fluorescence microscopy images of HeLa cells treated with 18 and (a) 5-ALA induced protoporphyrin IX (PpIX), (b) tetrakis(N-methyl-4-pyridyl)porphyrin (TMPyP4) and a lysosome marker (A647-dextran), and (c) mitochondrion-targeted KillerRed. (a and b) Cells were irradiated with a 640 nm laser to generate 1O2 and monitor the fluorescence induced by 18 simultaneously. (c) Two-color irradiation at 532 and 640 nm was used to excite 18 and KillerRed. Adapted with permission from ref. 41b. Copyright 2014 American Chemical Society.
Fig. 13
Fig. 13. Fluorescent probes for imaging NO in mitochondria.
Fig. 14
Fig. 14. Fluorescent probes for imaging ONOO and HNO in mitochondria.
Fig. 15
Fig. 15. TP fluorescence imaging of ONOO generation in inflamed tissues. (A) 200 μL of LPS (1 mg mL–1) was subcutaneously injected into the right leg of mice to cause inflammation. After 12 h, 20 μL of 500 μM 25 was subcutaneously injected in situ. After 1 h, the leg skin of mice was sectioned after being anaesthetized. (B) Fluorescence images of 25 in the normal and inflamed tissues. (C) Average Fblue/Fred intensity ratios in panel (B). Blue channel, λEm = 460–500 nm; red channel, λEm = 605–680 nm. λEx = 800 nm. Adapted with permission from ref. 78. Copyright 2016 American Chemical Society.
Fig. 16
Fig. 16. Fluorescent probes for imaging RSS in mitochondria.
Fig. 17
Fig. 17. CLSM images of HeLa cells subjected to different treatments (A–C) with 28. (A) 28 only, (B) 28 + LPA (1.8 mM, 24 h), and (C) 28 + 3-HP (1 mM, 5 min then 2 h incubation); (D) their histograms of fluorescence intensities. Adapted with permission from ref. 52. Copyright 2014 American Chemical Society.
Fig. 18
Fig. 18. In vivo NIR imaging of living mice subjected to different treatments with probe 47. (a) The mice was treated with 0.1 mL of saline (left side) or 31 (10 μM, right side) solution and imaged at different times after subcutaneous injection of 47. (b) The left mice was injected with probe 31 (10 μM, 0.2 mL) only for 10 min. The right mice was preinjected with NEM (1 mM, 0.2 mL) for 30 min and then injected with 31 (10 μM, 0.2 mL) for 10 min. Adapted with permission from ref. 53b. Copyright 2015 American Chemical Society.
Fig. 19
Fig. 19. Fluorescent probes for imaging ROS in mitochondria.
Fig. 20
Fig. 20. Top: CLSM images of live HepG2 cells pretreated with 42 (20.0 μM) and Lyso-Tracker Red (100.0 nM) for 20 min: (a) bright-field image, (b) green channel for probe fluorescence, (c) red channel for Lyso-Tracker fluorescence, (d) merged image from panels (b) and (c); and (e) intensity correlation plot of 42 and Lyso-Tracker Red. Bottom: Two-photon fluorescence imaging at different depths and the 3D distribution of HOCl in the normal and cancerous breasts of mice pretreated with 42 (100.0 μM) for 30 min. Fluorescence images were obtained with an 800 nm light source. Adapted with permission from ref. 88. Copyright 2016 American Chemical Society.
Fig. 21
Fig. 21. Fluorescent probes for imaging RNS in lysosomes.
Fig. 22
Fig. 22. Imaging tumor using 44 in the tumor-bearing mouse xenograft models prepared by subcutaneous inoculation of HeLa cells. (A) The mouse was subcutaneously injected with 44 (2 mM, 10 μL) in the tumor region and normal region, respectively, and then imaged immediately. (B) The mouse was intravenously injected with 44 (1.5 mg kg–1), and then imaged after 25 min. Adapted with permission from ref. 89. Copyright 2017 Elsevier Ltd.
Fig. 23
Fig. 23. Overlay of the fluorescence and X-ray images of mice. (A) The mouse was intraperitoneally injected with 46 (100 μL, 2 μM) for 30 min. (B) The mouse was first intraperitoneally injected with LPS (1 mg mL–1, 100 μL) for 24 h, and then intraperitoneally injected with 46 (2 μM, 100 μL) for 30 min. (C) The mouse was first intraperitoneally injected with streptozotocin (40 mg kg–1) for 24 h, and then intraperitoneally injected with 46 (100 μL, 2 μM) for 30 min. Adapted with permission from ref. 48b. Copyright 2017 Royal Society of Chemistry.
Fig. 24
Fig. 24. Bright-field (A), steady-state (B) and time-gated ((C) Tb3+ luminescence; (D) rhodamine luminescence) luminescence images of the 47 loaded D. magna after being treated with 0.5 mM NOC-13 for 10 min. (E) is the ratiometric (ratio = Ired/Igreen) luminescence image of the D. magna. (F) is the merged image of brightfield and ratiometric images. Scale bar: 200 μm. Adapted with permission from ref. 48d. Copyright 2017 Royal Society of Chemistry.
Fig. 25
Fig. 25. Fluorescent probes for imaging RSS in lysosomes.
Fig. 26
Fig. 26. Fluorescent probes for imaging of ROS and RNS in the ER.
Fig. 27
Fig. 27. The colocalization imaging of 53 and ER-tracker Red in Tm-treated HepG2 cells. (A) The bright-field image. (B) The fluorescence image of 53 (10 μM, Ex = 405 nm, collected 420–480 nm). (C) The fluorescence image of ER-Tracker Red (0.5 μM, Ex = 543 nm, collected 580–630 nm). (D) The merged image of (A)–(C). (E) Intensity correlation plot of stain 53 and ER-Tracker Red. (F) The fluorescence image of ER-BZT in Tm-induced HepG2 cells pretreated with Tiron (5.0 mM) for 20 min. Scale bar: 10 μm. Adapted with permission from ref. 30a. Copyright 2016 Royal Society of Chemistry.
Fig. 28
Fig. 28. TPM (a, e, and i), OPM (b, f, and j), and merged (c, g, and k) images of RAW264.7 cells colabeled with 56 (10 μM) and organelle trackers (1.0 μM). Line profile of fluorescence intensity (d, h, and l) obtained from the corresponding cells images. Scale bars = 20 μm. Adapted with permission from ref. 98. Copyright 2016 Royal Society of Chemistry.
Fig. 29
Fig. 29. (A) Preparation of normal tissues and tunicamycin-treated tissues from a mouse model. (B) Two-photon fluorescence images of tissues during ER stress: (a) normal tissues, (b) tunicamycin-treated tissues, and (c) relative pixel intensities for images (a) and (b). Scale bar is 100 μm. Adapted with permission from ref. 96a. Copyright 2016 Royal Society of Chemistry.
Fig. 30
Fig. 30. Fluorescent probes for imaging RSS in the ER (60–63) and ROS in the Golgi apparatus (64 and 65).
Fig. 31
Fig. 31. Top: Increased O2˙ levels in IR cells and mice. (A) The normal (A1) and IR hepatic (A2) cells loaded with 10 μM 64 for TP fluorescence imaging, and (A3) the average fluorescence intensity output of (A). (B) The in vivo 3D images of normal (B1) and IR mice (B2) injected with 10 μM 64 for TP fluorescence imaging, and (B3) the average fluorescence intensity output of (B). Images were acquired at an excitation wavelength of 800 nm and emission wavelengths corresponding to the blue channel of 430–530 nm. Bottom: Model for the signalling role of O2˙ in IR cells and mice. Adapted with permission from ref. 31a. Copyright 2019 Royal Society of Chemistry.
Fig. 32
Fig. 32. Molecular probes for simultaneous imaging of bioactive species in one organelle.
Fig. 33
Fig. 33. The simultaneous fluorescence imaging of H2O2 and Zn2+ in zebrafish upon local injury of the tail fin. (A) The fluorescence images of 68-1 (50 mM, green channel) and 68-2 (50 mM, red channel). (B) The bright-field image (the red line indicates a cut injury). Adapted with permission from ref. 102b. Copyright 2016 Royal Society of Chemistry.
Fig. 34
Fig. 34. Nanoprobes for simultaneous imaging of bioactive species in mitochondria.
Fig. 35
Fig. 35. Structures and the responses of probes 71-1 and 71-2.
Fig. 36
Fig. 36. CLSM images of HepG2 cells stained simultaneously with 71-1 and 71-2 (10 mM). 71-2 was excited at 405 nm, and collected at 500–620 nm for the green channel (image A) and at 430–470 nm for the blue channel (image B). 71-1 was excited at 543 nm, and collected at 550–600 nm for the red channel (image C). (D) The bright-field image. (E) The overlay of (A) and (C). (F) The enlarged image from the square marked in image (E). Adapted with permission from ref. 30b. Copyright 2016 Royal Society of Chemistry.

Similar articles

Cited by

References

    1. Carter K. P., Young A. M., Palmer A. E. Chem. Rev. 2014;114:4564–4601. - PMC - PubMed
    2. Kim H. M., Cho B. R. Chem. Rev. 2015;115:5014–5055. - PubMed
    3. Liu J., Cao Z., Lu Y. Chem. Rev. 2009;109:1948–1998. - PMC - PubMed
    4. Guo Z., Park S., Yoon J., Shin I. Chem. Soc. Rev. 2014;43:16–29. - PubMed
    5. Lin V. S., Chen W., Xian M., Chang C. J. Chem. Soc. Rev. 2015;44:4596–4618. - PMC - PubMed
    6. Niu L.-Y., Chen Y.-Z., Zheng H.-R., Wu L.-Z., Tung C.-H., Yang Q.-Z. Chem. Soc. Rev. 2015;44:6143–6160. - PubMed
    7. Wu D., Sedgwick A. C., Gunnlaugsson T., Akkaya E. U., Yoon J., James T. D. Chem. Soc. Rev. 2017;46:7105–7123. - PubMed
    8. Heffern M. C., Matosziuk L. M., Meade T. J. Chem. Rev. 2013;114:4496–4539. - PMC - PubMed
    1. Chan J., Dodani S. C., Chang C. J. Nat. Chem. 2012;4:973–984. - PMC - PubMed
    2. Chyan W., Zhang D. Y., Lippard S. J., Radford R. J. Proc. Natl. Acad. Sci. U. S. A. 2014;111:143–148. - PMC - PubMed
    3. Liu H. W., Chen L., Xu C., Li Z., Zhang H., Zhang X. B., Tan W. Chem. Soc. Rev. 2018;47:7140–7180. - PubMed
    4. Qian X., Xu Z. Chem. Soc. Rev. 2015;44:4487–4493. - PubMed
    5. Sedgwick A. C., Wu L., Han H. H., Bull S. D., He X. P., James T. D., Sessler J. L., Tang B. Z., Tian H., Yoon J. Chem. Soc. Rev. 2018;47:8842–8880. - PubMed
    6. Tang Y., Lee D., Wang J., Li G., Yu J., Lin W., Yoon J. Chem. Soc. Rev. 2015;44:5003–5015. - PubMed
    7. Roopa, Kumar N., Bhalla V., Kumar M. Chem. Commun. 2015;51:15614–15628. - PubMed
    1. Xu W., Zeng Z., Jiang J.-H., Chang Y.-T., Yuan L. Angew. Chem., Int. Ed. 2016;55:13658–13699. - PubMed
    2. Zhu H., Fan J., Du J., Peng X. Acc. Chem. Res. 2016;49:2115–2126. - PubMed
    3. Jiao X., Li Y., Niu J., Xie X., Wang X., Tang B. Anal. Chem. 2018;90:533–555. - PubMed
    4. Xu Z., Xu L. Chem. Commun. 2016;52:1094–1119. - PubMed
    5. Zhang R., Song B., Yuan J. TrAC, Trends Anal. Chem. 2018;99:1–33.
    1. Zielonka J., Joseph J., Sikora A., Hardy M., Ouari O., Vasquez-Vivar J., Cheng G., Lopez M., Kalyanaraman B. Chem. Rev. 2017;117:10043–10120. - PMC - PubMed
    2. Fernandez A., Vendrell M. Chem. Soc. Rev. 2016;45:1182–1196. - PubMed
    3. Lee M. H., Sharma A., Chang M. J., Lee J., Son S., Sessler J. L., Kang C., Kim J. S. Chem. Soc. Rev. 2018;47:28–52. - PMC - PubMed
    4. Qiu K., Chen Y., Rees T. W., Ji L., Chao H. Coord. Chem. Rev. 2019;378:66–86.
    1. Kowada T., Maeda H., Kikuchi K. Chem. Soc. Rev. 2015;44:4953–4972. - PubMed
    2. Lee M. H., Kim J. S., Sessler J. L. Chem. Soc. Rev. 2015;44:4185–4191. - PMC - PubMed