. 2019 May 21;10(24):6072-6082.
doi: 10.1039/c9sc01331h. eCollection 2019 Jun 28.

Atomic resolution map of the soluble amyloid beta assembly toxic surfaces

Affiliations

Atomic resolution map of the soluble amyloid beta assembly toxic surfaces

Rashik Ahmed et al. Chem Sci. .

Abstract

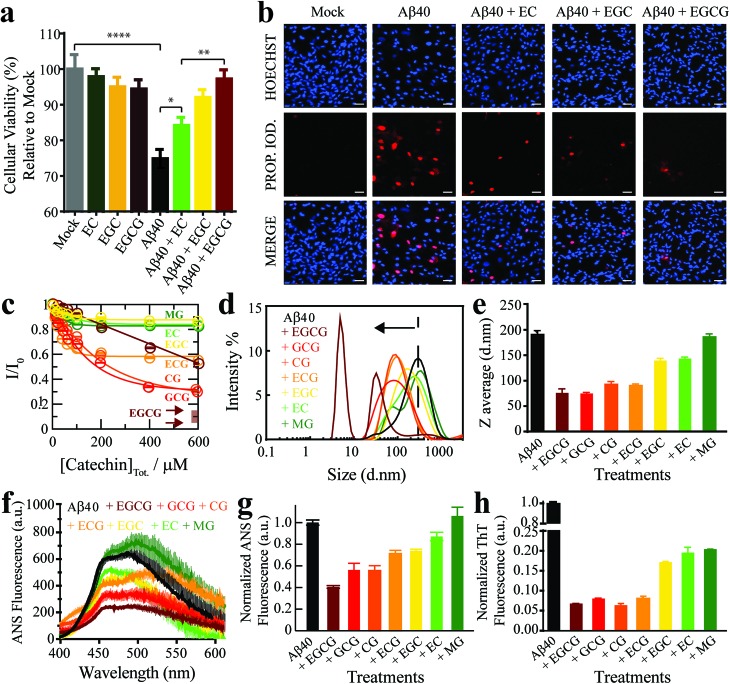
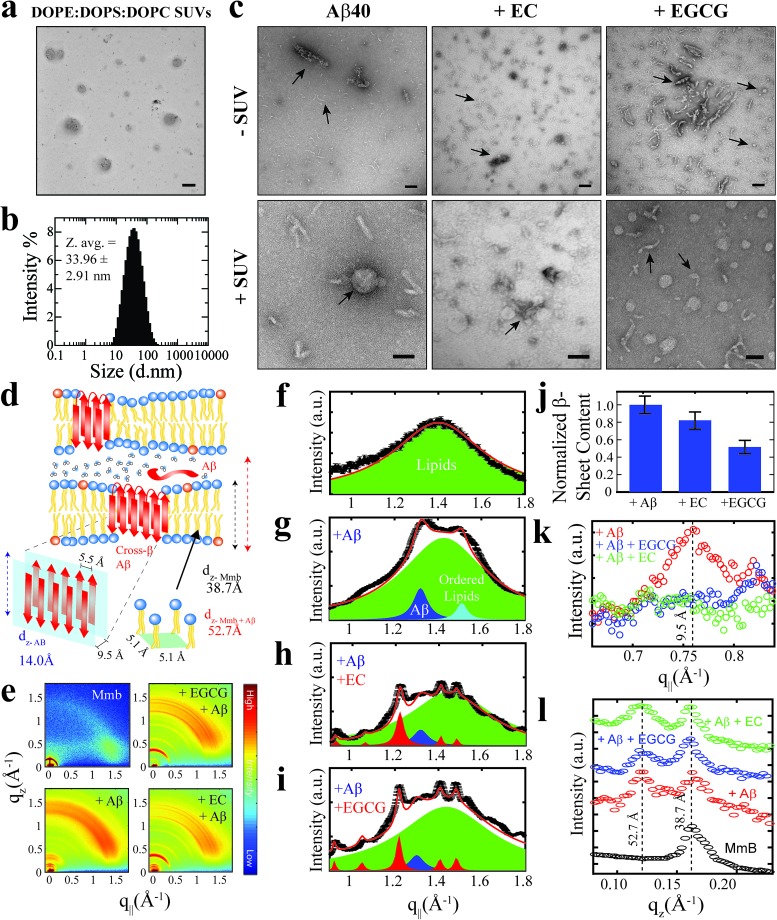
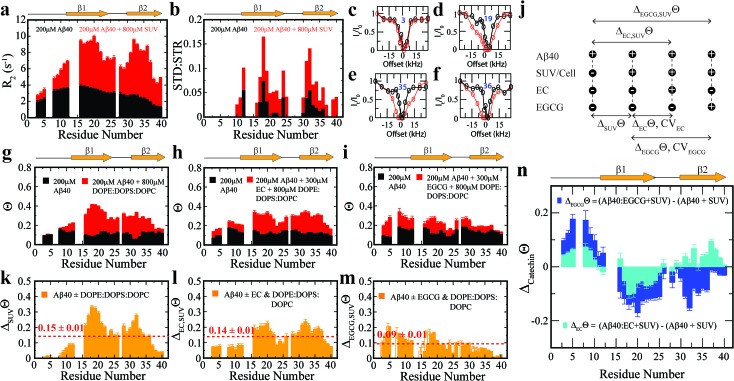
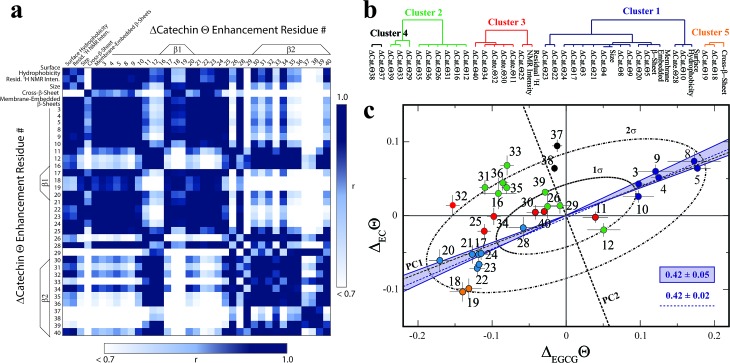
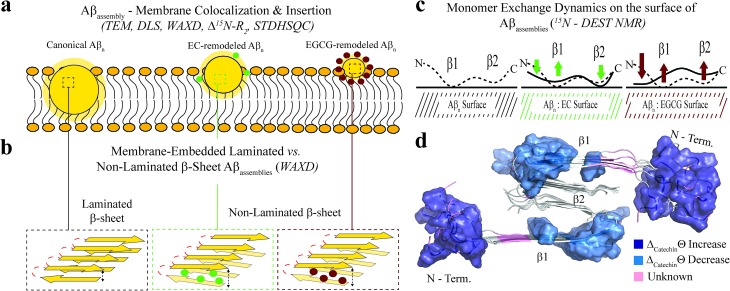
Soluble amyloid beta assemblies (Aβ n ) are neurotoxic and play a central role in the early phases of the pathogenesis cascade leading to Alzheimer's disease. However, the current knowledge about the molecular determinants of Aβ n toxicity is at best scant. Here, we comparatively analyze Aβ n prepared in the absence or presence of a catechin library that modulates cellular toxicity. By combining solution NMR with dynamic light scattering, fluorescence spectroscopy, electron microscopy, wide-angle X-ray diffraction and cell viability assays, we identify a cluster of unique molecular signatures that distinguish toxic vs. nontoxic Aβ assemblies. These include the exposure of a hydrophobic surface spanning residues 17-28 and the concurrent shielding of the highly charged N-terminus. We show that the combination of these two dichotomous structural transitions promotes the colocalization and insertion of β-sheet rich Aβ n into the membrane, compromising membrane integrity. These previously elusive toxic surfaces mapped here provide an unprecedented foundation to establish structure-toxicity relationships of Aβ assemblies.


Figures

Fig. 1
Fig. 1. The Aβn library samples a wide-distribution of toxicity, hydrophobic exposure, cross β-sheet content and sizes. (a) Mitochondrial activity of retinal pigment epithelial (RPE1) cells after treatment with representative Aβ40 assemblies and associated controls, as monitored by the reduction of resazurin using the PrestoBlue assay. The data reported show the mean and standard deviation of technical replicates. One-way ANOVA and subsequent Tukey's post-hoc test was used to determine statistical significance between treatments and mock (1X PBS delivery solution), with *, ** and **** representing p-values of 0.05, 0.01 and <0.0001, respectively. (b) Representative fluorescence microscopy images of RPE1 cells (scale bar, 50 μm), showing intracellular Hoechst 33342 and propidium iodide fluorescence after incubation with selected Aβ40 assemblies. (c) Normalized Aβ40 methyl intensity losses upon catechin addition relative to the state in the absence of catechins. (d) Size distribution of Aβ40 assemblies in the absence (black) and presence of catechins (coloured as per legend) as determined by intensity measurements in dynamic light scattering experiments. (e) Z-average of the Aβ40 assemblies in (d). (f) ANS fluorescence spectra of Aβ40 assemblies in the absence (black) and presence of catechins (colour coded as per the legend). (g) ANS fluorescence intensities at 454 nm for the samples in (k), normalized to the intensity for Aβ40 alone. (h) Thioflavin T fluorescence intensities at 485 nm of Aβ40 assemblies in the absence (black) and presence of catechins (coloured as per legend) normalized to the intensity of canonical assemblies.
Fig. 2
Fig. 2. Localization and insertion of Aβ40 assemblies into model membranes. (a) Negative-stain TEM image of 800 μM DOPE : DOPS : DOPC SUVs. (b) Size distribution of SUVs shown in (a) as determined through dynamic light scattering intensity measurements. (c) Negative-stain TEM images of Aβ40 assemblies in the absence and presence of EC and EGCG and the same assemblies treated with the SUVs in (a) and (b). All scale bars correspond to 100 nm. (d) Schematic summary of the information extracted from wide-angle X-ray diffraction experiments. (e) Complete two-dimensional intensity maps of the X-ray diffraction data with both in-plane and out-of-plane features. (f–i) In-plane (q) diffraction patterns (black line) and fitted Lorentzian peaks (coloured peaks) for DOPE : DOPS : DOPC lipids (green peaks) in the absence and presence of Aβ40 assemblies (blue peaks) with and without catechins (red peaks). Red lines indicate total fits derived from the summation of component peaks. (j) Normalized population of membrane-embedded β-sheet assemblies relative to canonical Aβ40 assemblies, derived through the integration of blue Aβ peaks in (f–i). (k) In-plane (q) diffraction patterns highlighting the cross-β inter-sheet signal intensity, which correspond to the 9.5 Å spacing between β-sheets shown in (d). (l) Out-of-plane (qz) diffraction patterns depicting the membrane lamellar spacing (panel d, dashed black and red lines corresponding to 38.7 and 52.7 Å, respectively) in the absence (black) and presence (coloured as per legend) of Aβ40 assemblies.
Fig. 3
Fig. 3. Exchange dynamics of Aβ40 monomers on the surface of soluble Aβ40 assemblies and model membranes. (a) 15N-R2 and (b) MeSTDHSQC for the canonical Aβ40 assemblies in the absence (black) and presence (red) of DOPE : DOPS : DOPC SUVs. (c–f) Representative 15N-DEST profiles for the samples shown in (a). (g) 15N-Θ profiles for the samples shown in (a), colour coding is as per legend. (h) 15N-Θ profiles for canonical Aβ40 assemblies in the absence (black) and presence (red) of EC followed by DOPE : DOPS : DOPC SUV addition. (i) 15N-Θ profiles for canonical Aβ40 assemblies in the absence (black) and presence (red) of EGCG followed by DOPE : DOPS : DOPC SUV addition. (j) Definition of key differentials in the 15N-DEST measurements and the corresponding normalized cellular viabilities. (k) Difference between the Θ profiles shown in (g). The dashed red line indicates the average Θ value. (l) Difference in the Θ profiles shown in (h). (m) Difference between the Θ profiles shown in (i). (n) 15N-Θ difference profiles for (h, red) vs. (g, red) (cyan) and (i, red) vs. (g, red) (blue).
Fig. 4
Fig. 4. Identification of the determinants of Aβ assembly toxicity through agglomerative clustering and Singular Value Decomposition (SVD). (a) Correlation matrix for the Aβn observables from Fig. 1–3. Correlations with an absolute Pearson's correlation coefficient > 0.95 are indicated in dark blue. (b) Dendrogram displaying the clusters with an absolute Pearson's correlation coefficient > 0.9 obtained through complete linkage agglomerative clustering. (c) Singular Value Decomposition (SVD) of the 15N-DEST data. The dashed black lines indicate the first and second principal components (PC1 and PC2) obtained through the SVD of the column-mean centered (ΔECΘi, ΔEGCGΘi) matrix, where i is the residue number. The ellipsoids at one and two standard deviations for the residue scores along PC1 and PC2 are shown as black dot-dashed curves. Data for residues assigned to clusters 1, 2 and 3, 4 and 5 though agglomerative clustering are displayed as solid dark/light blue, green, red, black and orange circles, respectively, and the corresponding residue number is reported beside each circle. The solid blue lines define the region of the (ΔECΘi, ΔEGCGΘi) plane that is expected to scale with the relative cellular viability (CV) defined as (CV40+EC – CV40)/(CV40+EGCG – CV40) = 0.42 ± 0.05, based on the data of Fig. 1. The dashed blue line (slope of 0.42 ± 0.02 and correlation coefficient of 0.98) was obtained from the linear regression of the DEST data in cluster 1 (blue) and confirms that cluster 1 correlates with cellular viability. PC1 (slope of 0.39) aligns with the residues for cluster 1.
Fig. 5
Fig. 5. Proposed model for the molecular determinants of Aβ assembly toxicity. (a) Toxic Aβn (canonical Aβn) exhibit significant solvent exposure of hydrophobic surfaces (yellow glow surroundingn). Exposed hydrophobic surfaces facilitate the colocalization, interaction and subsequent insertion of Aβn into the membrane. (b) Membrane-embedded Aβn adopt both laminated and non-laminated β-sheets, indicating that under our experimental conditions the non-laminated β-sheet signature is the minimum structural feature required for membrane insertion and induction of toxicity. (c) Toxic vs. non-toxic Aβn exhibit unique regiospecific differences in the recognition of Aβ monomers within a membrane environment. Relative to canonical Aβn (black), EC- (green) and EGCG-remodeled Aβn (maroon) exhibit progressive engagement of contacts with Aβ monomers at the N-terminus and disengagement at the β1-turn region, following the same ranking as their measured toxicities. In contrast, for the β2 region no correlation is observed between toxicity and Aβn monomer recognition. Relevant experimental techniques are indicated in parenthesis. (d) Mapping on the structure of Aβ40 fibrils (PDB code: ; 2LMN) the Aβ residues in cluster 1 (Fig. 4b and c). The N-terminal and β1-turn residues that correlate with toxicity (blue) are found in the external regions of the Aβ fibril structure. In contrast, β2 is involved in the lamination of multiple β-sheet layers and is largely inaccessible (Table S2†), explaining its ancillary role in toxicity.

References

    1. Benilova I., Karran E., de Strooper B. Nat. Neurosci. 2012;15:349–357. - PubMed
    1. Hardy J. A., Higgins G. A. Science. 1992;256:184–185. - PubMed
    1. Musiek E. S., Holtzman D. M. Nat. Neurosci. 2015;18:800–806. - PMC - PubMed
    1. Jack C. R., Knopman D. S., Jagust W. J., Petersen R. C., Weiner M. W., Aisen P. S., Shaw L. M., Vemuri P., Wiste H. J., Weigand S. D., Lesnick T. G., Pankratz V. S., Donohue M. C., Trojanowski J. Q. Lancet Neurol. 2013;12:207–216. - PMC - PubMed
    1. Castellano J. M., Kim J., Stewart F. R., Jiang H., DeMattos R. B., Patterson B. W., Fagan A. M., Morris J. C., Mawuenyega K. G., Cruchaga C., Goate A. M., Bales K. R., Paul S. M., Bateman R. J., Holtzman D. M. Sci. Transl. Med. 2011;3:89ra57. - PMC - PubMed