. 2019 Jun 26;10(7):3605-3621.
doi: 10.1364/BOE.10.003605. eCollection 2019 Jul 1.

Epi-mode tomographic quantitative phase imaging in thick scattering samples

Affiliations

Epi-mode tomographic quantitative phase imaging in thick scattering samples

Patrick Ledwig et al. Biomed Opt Express. .

Abstract

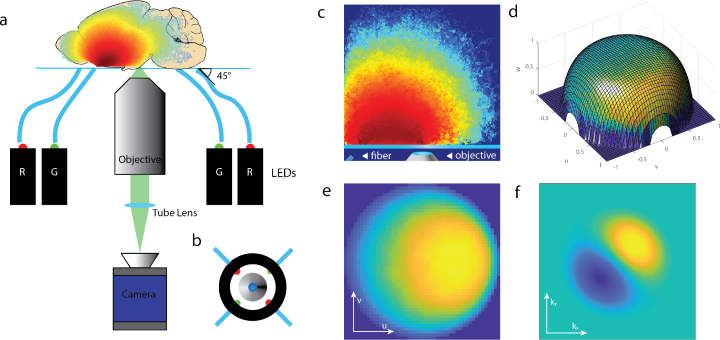
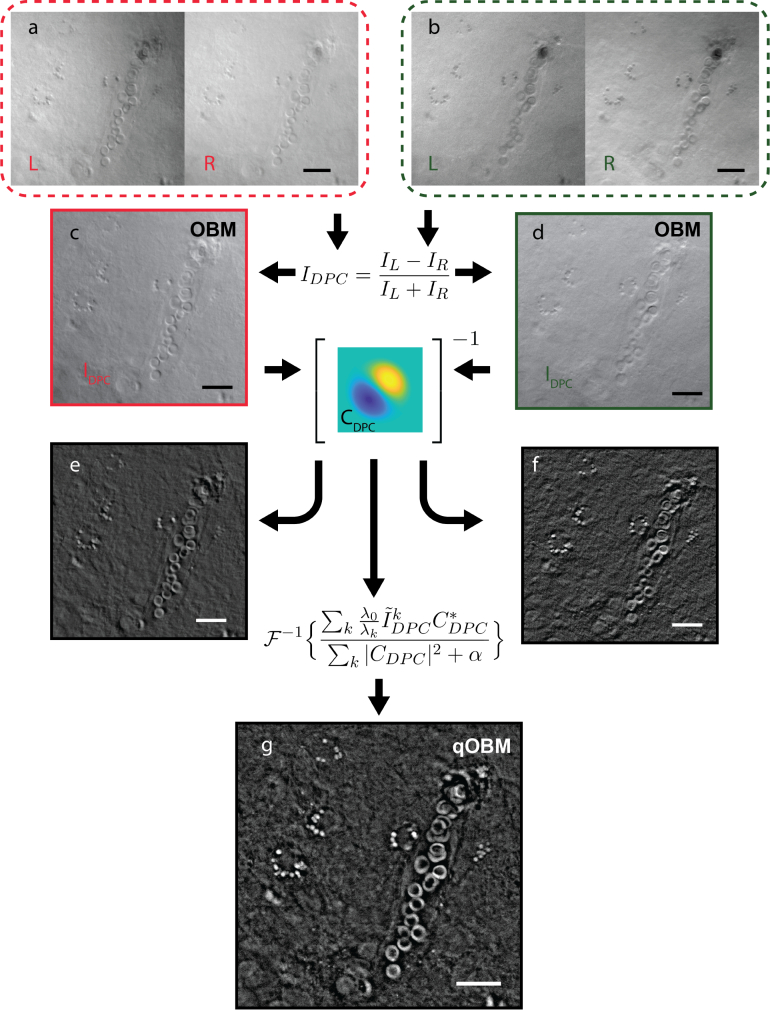
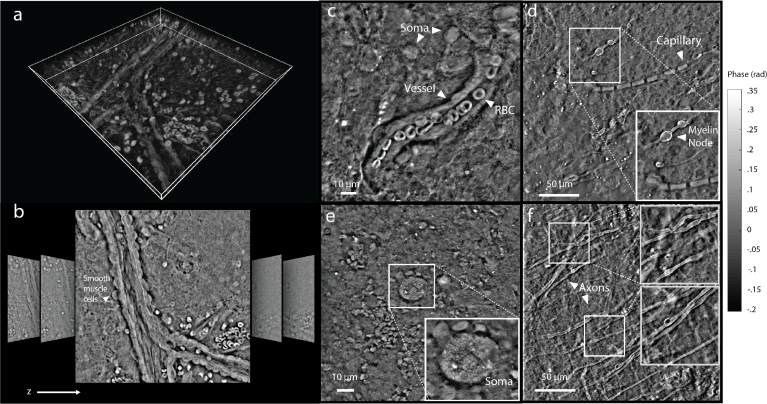
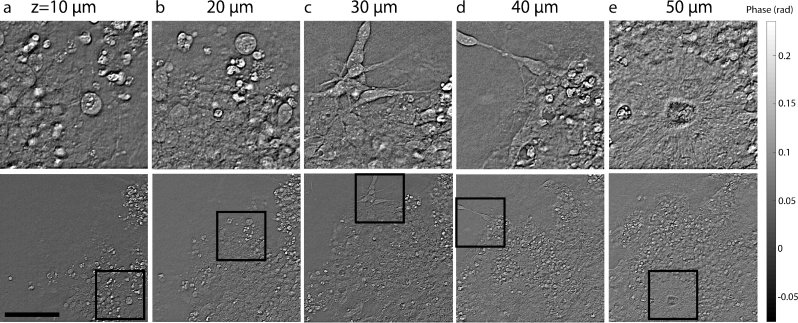
Quantitative phase imaging (QPI) is an important tool in biomedicine that allows for the microscopic investigation of live cells and other thin, transparent samples. Importantly, this technology yields access to the cellular and sub-cellular structure and activity at nanometer scales without labels or dyes. Despite this unparalleled ability, QPI's restriction to relatively thin samples severely hinders its versatility and overall utility in biomedicine. Here we overcome this significant limitation of QPI to enable the same rich level of quantitative detail in thick scattering samples. We achieve this by first illuminating the sample in an epi-mode configuration and using multiple scattering within the sample-a hindrance to conventional transmission imaging used in QPI-as a source of transmissive illumination from within. Second, we quantify phase via deconvolution by modeling the transfer function of the system based on the ensemble average angular distribution of light illuminating the sample at the focal plane. This technique packages the quantitative, real-time sub-cellular imaging capabilities of QPI into a flexible configuration, opening the door for truly non-invasive, label-free, tomographic quantitative phase imaging of unaltered thick, scattering specimens. Images of controlled scattering phantoms, blood in collection bags, cerebral organoids and freshly excised whole mouse brains are presented to validate the approach.


Conflict of interest statement

The authors declare that there are no conflicts of interest related to this article.

Figures

Fig. 1
Fig. 1
(a) Diagram of qOBM assembly. Four LEDs, two red (630 nm) and two green (530 nm), sequentially illuminate the target from some distance off axis and at some angle (45° in this work), and an image is produced with an inverted microscope. (b) Top-down view of imaging apparatus indicating the entry positions of the four LEDs. (c) Representative photon visitation in the source-detector plane. (d) Example angular distribution overlaid on a unit sphere, which is smoothed and projected onto a flat surface to produce (e) the effective source distribution in spatial frequency space. (f) The effective optical transfer function of the difference image.
Fig. 2
Fig. 2
Representative images of unsectioned mouse cortex in a diagram demonstrating the qOBM process. (a,b) Red and green captured images. (c,d) DPC images produced from left and right illumination, representing images formed with conventional OBM. (e,f) Images of quantitative phase produced from only an individual pair of LED illuminations. Note the lack of structured detail in one dimension. (g) Final qOBM image produced as a composite of of the deconvolved DPC images from two orthogonal dimensions. Note the high level of detail, allowing for the detection of subtle features not present in either individual illumination. The scale bars in all images represent 25 μm.
Fig. 3
Fig. 3
(a) Relief depiction of qOBM image of lithography target. (b) Cross-section of phase image through the top 6 letters (blue) with actual height overlaid (black dashed). (c) qOBM image of several 2μm polystyrene beads immersed in a well of oil beneath an intralipid scattering phantom. (c inset) Phase reconstruction from simulated image of a 2μm polystyrene bead in oil. (d) The average height from cross-sections of 20 imaged beads (blue, standard deviation shaded), overlaid with the simulated phase recovery (orange), and ideal height (black dashed).
Fig. 4
Fig. 4
(a) Sterile bag with diluted blood (b) qOBM image of blood cells in the bag from a patient with sickle-cell disease (b inset) Profile of n=20 healthy RBCs from the same image (blue), simulated RBC (red) and ideal (dashed black). (c) Relief image showing optical volume differences in blood cell contents.
Fig. 5
Fig. 5
(a) Maximum-intensity projection of a 60 μm vertical stack of qOBM images of blood vessel in unsectioned mouse cortex. (b) Representative images from the stack (lateral dimensions are 250μm x 250μm). (c) Blood vessel, with red blood cells and nearby brain cells in unsectioned cortex. Color bar above c applies to c and e. (d) Descending capillary, axons, and myelin nodes from coronal section. Color bar above d applies to d and f. (e) Neuron soma with internal structures visible from unsectioned cortex. (f) Axonal projections from white matter in coronal section.
Fig. 6
Fig. 6
Sequential depth sections of 26 day-old cerebral organoid. Total field of view is shown in the bottom row, and selected regions are enlarged above. Depth is indicated above each enlarged region. (a,b) Depict neuroblasts and immature neurons before they have developed characteristic axonal or dendritic processes. (c,d) Mature neurons with characteristic shape with internal cell contents discernible within the soma. (e) The characteristic “rosette” shape formed by neural progenitor cells that develop and grow radially. Scale bar is 100μm.

References

    1. Park Y., Depeursinge C., Popescu G., “Quantitative phase imaging in biomedicine,” Nat. Photonics 12, 578–589 (2018). 10.1038/s41566-018-0253-x - DOI
    1. Marquet P., Depeursinge C., Magistretti P. J., “Review of quantitative phase-digital holographic microscopy: promising novel imaging technique to resolve neuronal network activity and identify cellular biomarkers of psychiatric disorders,” Neurophotonics 1, 020901 (2014). 10.1117/1.NPh.1.2.020901 - DOI - PMC - PubMed
    1. Mir M., Bhaduri B., Wang R., Zhu R., Popescu G., “Quantitative Phase Imaging,” Prog. Opt. 57, 133–217 (2012). 10.1016/B978-0-44-459422-8.00003-5 - DOI
    1. Chen Y., Bousi E., Pitris C., Fujimoto J., “Optical Coherence Tomography,” in Handbook of Biomedical Optics, (CRC Press, 2011), pp. 255–280. 10.1201/b10951-17 - DOI
    1. Nguyen T. H., Kandel M. E., Rubessa M., Wheeler M. B., Popescu G., “Gradient light interference microscopy for 3D imaging of unlabeled specimens,” Nat. Commun. 8, 210 (2017). 10.1038/s41467-017-00190-7 - DOI - PMC - PubMed

LinkOut - more resources