

Cirrus: An Automated Mammography-Based Measure of Breast Cancer Risk Based on Textural Features
- PMID: 31360877
- PMCID: PMC6649799
- DOI: 10.1093/jncics/pky057
Cirrus: An Automated Mammography-Based Measure of Breast Cancer Risk Based on Textural Features
Abstract
Background: We applied machine learning to find a novel breast cancer predictor based on information in a mammogram.
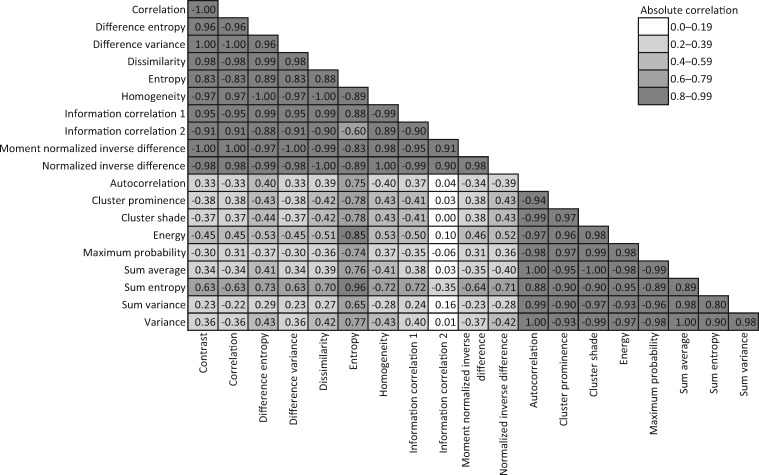
Methods: Using image-processing techniques, we automatically processed 46 158 analog mammograms for 1345 cases and 4235 controls from a cohort and case-control study of Australian women, and a cohort study of Japanese American women, extracting 20 textural features not based on pixel brightness threshold. We used Bayesian lasso regression to create individual- and mammogram-specific measures of breast cancer risk, Cirrus. We trained and tested measures across studies. We fitted Cirrus with conventional mammographic density measures using logistic regression, and computed odds ratios (OR) per standard deviation adjusted for age and body mass index.
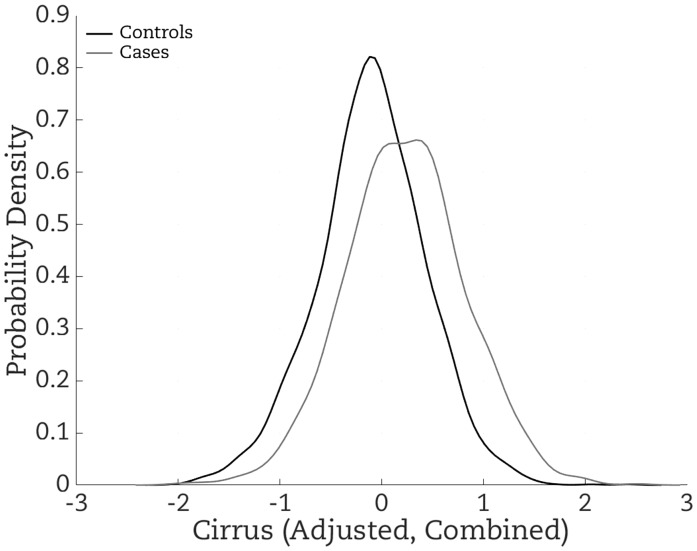
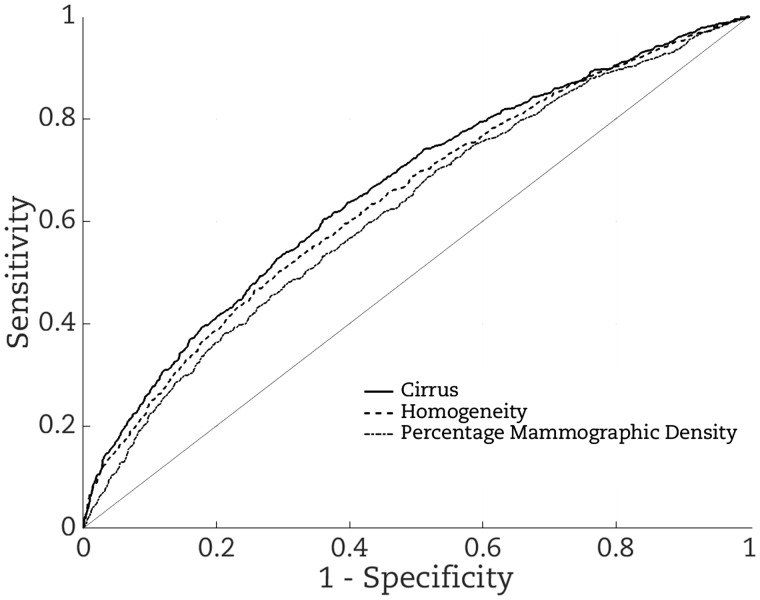
Results: Combining studies, almost all textural features were associated with case-control status. The ORs for Cirrus measures trained on one study and tested on another study ranged from 1.56 to 1.78 (all P < 10-6). For the Cirrus measure derived from combining studies, the OR was 1.90 (95% confidence interval [CI] = 1.73 to 2.09), equivalent to a fourfold interquartile risk ratio, and was little attenuated after adjusting for conventional measures. In contrast, the OR for the conventional measure was 1.34 (95% CI = 1.25 to 1.43), and after adjusting for Cirrus it became 1.16 (95% CI = 1.08 to 1.24; P = 4 × 10⁻⁵).
Conclusions: A fully automated personal risk measure created from combining textural image features performs better at predicting breast cancer risk than conventional mammographic density risk measures, capturing half the risk-predicting ability of the latter measures. In terms of differentiating affected and unaffected women on a population basis, Cirrus could be one of the strongest known risk factors for breast cancer.
Figures
References
-
- Nguyen TL, Schmidt DF, Makalic E, et al. Explaining variance in the Cumulus mammographic measures that predict breast cancer risk: a twins and sisters study. Cancer Epidemiol Biomarkers Prev. 2013;22(12):2395–2403. - PubMed
-
- Stone J, Dite GS, Giles GG, et al. Inference about causation from examination of familial confounding: application to longitudinal twin data on mammographic density measures that predict breast cancer risk. Cancer Epidemiol Biomarkers Prev. 2012;21(7):1149–1155. - PubMed
LinkOut - more resources
Full Text Sources
Other Literature Sources
Molecular Biology Databases