

Mechanisms of exercise-induced survival motor neuron expression in the skeletal muscle of spinal muscular atrophy-like mice
- PMID: 31361024
- PMCID: PMC6767691
- DOI: 10.1113/JP278454
Mechanisms of exercise-induced survival motor neuron expression in the skeletal muscle of spinal muscular atrophy-like mice
Abstract
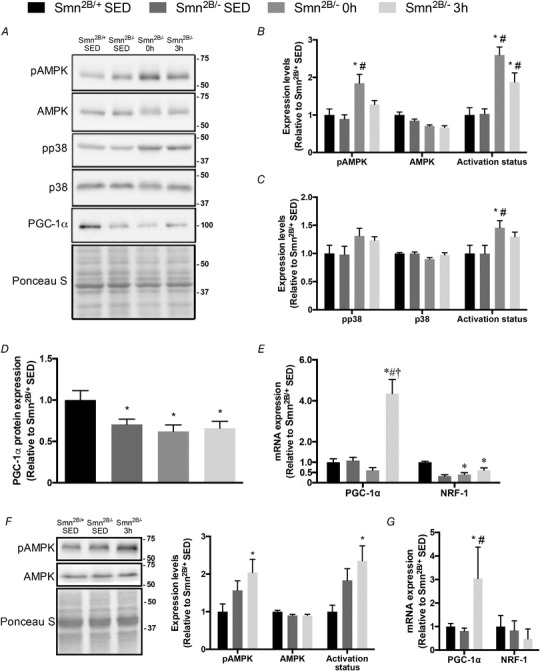
Key points: Spinal muscular atrophy (SMA) is a health- and life-limiting neuromuscular disorder caused by a deficiency in survival motor neuron (SMN) protein. While historically considered a motor neuron disease, current understanding of SMA emphasizes its systemic nature, which requires addressing affected peripheral tissues such as skeletal muscle in particular. Chronic physical activity is beneficial for SMA patients, but the cellular and molecular mechanisms of exercise biology are largely undefined in SMA. After a single bout of exercise, canonical responses such as skeletal muscle AMP-activated protein kinase (AMPK), p38 mitogen-activated protein kinase (p38) and peroxisome proliferator-activated receptor γ coactivator 1α (PGC-1α) activation were preserved in SMA-like Smn2B/- animals. Furthermore, molecules involved in SMN transcription were also altered following physical activity. Collectively, these changes were coincident with an increase in full-length SMN transcription and corrective SMN pre-mRNA splicing. This study advances understanding of the exercise biology of SMA and highlights the AMPK-p38-PGC-1α axis as a potential regulator of SMN expression in muscle.
Abstract: Chronic physical activity is safe and effective in spinal muscular atrophy (SMA) patients, but the underlying cellular events that drive physiological adaptations are undefined. We examined the effects of a single bout of exercise on molecular mechanisms associated with adaptive remodelling in the skeletal muscle of Smn2B/- SMA-like mice. Skeletal muscles were collected from healthy Smn2B/+ mice and Smn2B/- littermates at pre- (postnatal day (P) 9), early- (P13) and late- (P21) symptomatic stages to characterize SMA disease progression. Muscles were also collected from Smn2B/- animals exercised to fatigue on a motorized treadmill. Intracellular signalling and gene expression were examined using western blotting, confocal immunofluorescence microscopy, real-time quantitative PCR and endpoint PCR assays. Basal skeletal muscle AMP-activated protein kinase (AMPK) and p38 mitogen-activated protein kinase (p38) expression and activity were not affected by SMA-like conditions. Canonical exercise responses such as AMPK, p38 and peroxisome proliferator-activated receptor γ coactivator-1α (PGC-1α) activation were observed following a bout of exercise in Smn2B/- animals. Furthermore, molecules involved in survival motor neuron (SMN) transcription, including protein kinase B (AKT) and extracellular signal-regulated kinases (ERK)/ETS-like gene 1 (ELK1), were altered following physical activity. Acute exercise was also able to mitigate aberrant proteolytic signalling in the skeletal muscle of Smn2B/- mice. Collectively, these changes were coincident with an exercise-evoked increase in full-length SMN mRNA expression. This study advances our understanding of the exercise biology of SMA and highlights the AMPK-p38-PGC-1α axis as a potential regulator of SMN expression alongside AKT and ERK/ELK1 signalling.
Keywords: AMPK; Autophagy; PGC-1α; mRNA splicing.
© 2019 The Authors. The Journal of Physiology published by John Wiley & Sons Ltd on behalf of The Physiological Society.
Figures
Comment in
-
Exercise training: thinking ahead to counteract systemic manifestations of spinal muscular atrophy.J Physiol. 2019 Dec;597(24):5757-5758. doi: 10.1113/JP279033. Epub 2019 Nov 12. J Physiol. 2019. PMID: 31621926 No abstract available.
Similar articles
-
Skeletal Muscle Mitochondrial and Autophagic Dysregulation Are Modifiable in Spinal Muscular Atrophy.J Cachexia Sarcopenia Muscle. 2025 Feb;16(1):e13701. doi: 10.1002/jcsm.13701. J Cachexia Sarcopenia Muscle. 2025. PMID: 39901351 Free PMC article.
-
Effect of exercise intensity and AICAR on isoform-specific expressions of murine skeletal muscle PGC-1α mRNA: a role of β₂-adrenergic receptor activation.Am J Physiol Endocrinol Metab. 2011 Feb;300(2):E341-9. doi: 10.1152/ajpendo.00400.2010. Epub 2010 Nov 23. Am J Physiol Endocrinol Metab. 2011. PMID: 21098736
-
Loganin possesses neuroprotective properties, restores SMN protein and activates protein synthesis positive regulator Akt/mTOR in experimental models of spinal muscular atrophy.Pharmacol Res. 2016 Sep;111:58-75. doi: 10.1016/j.phrs.2016.05.023. Epub 2016 May 27. Pharmacol Res. 2016. PMID: 27241020
-
The Role of AMPK in Neuromuscular Biology and Disease.Trends Endocrinol Metab. 2018 May;29(5):300-312. doi: 10.1016/j.tem.2018.02.010. Epub 2018 Mar 20. Trends Endocrinol Metab. 2018. PMID: 29572064 Review.
-
Exercise, PGC-1alpha, and metabolic adaptation in skeletal muscle.Appl Physiol Nutr Metab. 2009 Jun;34(3):424-7. doi: 10.1139/H09-030. Appl Physiol Nutr Metab. 2009. PMID: 19448709 Free PMC article. Review.
Cited by
-
Aerobic exercise elicits clinical adaptations in myotonic dystrophy type 1 patients independently of pathophysiological changes.J Clin Invest. 2022 May 16;132(10):e156125. doi: 10.1172/JCI156125. J Clin Invest. 2022. PMID: 35316212 Free PMC article.
-
Metabolic Dysfunction in Spinal Muscular Atrophy.Int J Mol Sci. 2021 May 31;22(11):5913. doi: 10.3390/ijms22115913. Int J Mol Sci. 2021. PMID: 34072857 Free PMC article. Review.
-
Future Portrait of the Athletic Brain: Mechanistic Understanding of Human Sport Performance Via Animal Neurophysiology of Motor Behavior.Front Syst Neurosci. 2020 Nov 17;14:596200. doi: 10.3389/fnsys.2020.596200. eCollection 2020. Front Syst Neurosci. 2020. PMID: 33281568 Free PMC article.
-
Mitochondrial Dysfunction in Spinal Muscular Atrophy.Int J Mol Sci. 2022 Sep 17;23(18):10878. doi: 10.3390/ijms231810878. Int J Mol Sci. 2022. PMID: 36142791 Free PMC article. Review.
-
A transcriptomics-based drug repositioning approach to identify drugs with similar activities for the treatment of muscle pathologies in spinal muscular atrophy (SMA) models.Hum Mol Genet. 2024 Feb 18;33(5):400-425. doi: 10.1093/hmg/ddad192. Hum Mol Genet. 2024. PMID: 37947217 Free PMC article.
References
-
- Allen DL, Harrison BC, Maass A, Bell ML, Byrnes WC & Leinwand LA (2001). Cardiac and skeletal muscle adaptations to voluntary wheel running in the mouse. J Appl Physiol 90, 1900–1908. - PubMed
-
- Berger A, Mayr J, Meierhofer D, Fötschl U, Bittner R, Budka H, Grethen C, Huemer M, Kofler B & Sperl W (2003). Severe depletion of mitochondrial DNA in spinal muscular atrophy. Acta Neuropathol 105, 245–251. - PubMed
-
- Biondi O, Branchu J, Ben Salah A, Houdebine L, Bertin L, Chali F, Desseille C, Weill L, Sanchez G, Lancelin C, Aid S, Lopes P, Pariset C, Lecolle S, Cote J, Holzenberger M, Chanoine C, Massaad C & Charbonnier F (2015). IGF‐1R reduction triggers neuroprotective signaling pathways in spinal muscular atrophy mice. J Neurosci 35, 12063–12079. - PMC - PubMed
-
- Biondi O, Grondard C, Lecolle S, Deforges S, Pariset C, Lopes P, Cifuentes‐Diaz C, Li H, della Gaspera B, Chanoine C & Charbonnier F (2008). Exercise‐induced activation of NMDA receptor promotes motor unit development and survival in a Type 2 spinal muscular atrophy model mouse. J Neurosci 28, 953–962. - PMC - PubMed
Publication types
MeSH terms
Substances
Grants and funding
LinkOut - more resources
Full Text Sources
Medical
Miscellaneous