. 2019 Nov 1;40(16):4732-4747.
doi: 10.1002/hbm.24733. Epub 2019 Jul 30.

Sensorimotor, language, and working memory representation within the human cerebellum

Affiliations

Sensorimotor, language, and working memory representation within the human cerebellum

Reiko Ashida et al. Hum Brain Mapp. .

Abstract

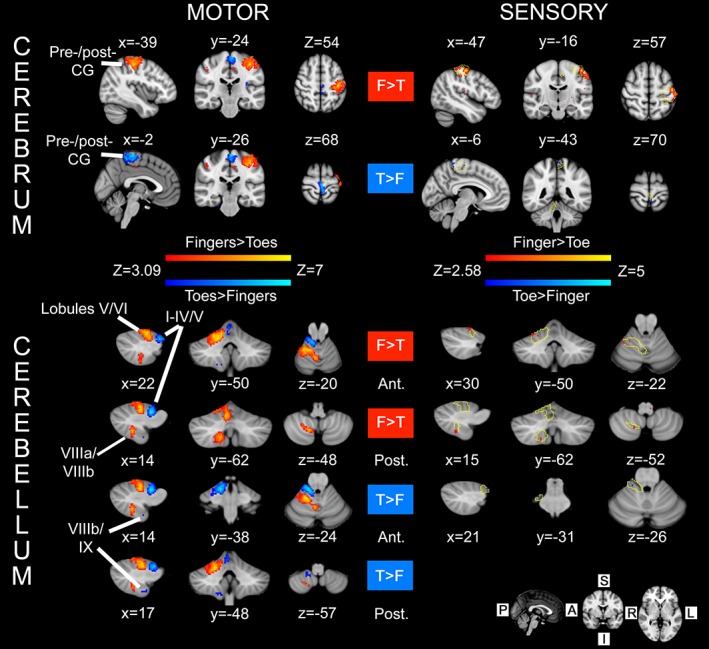
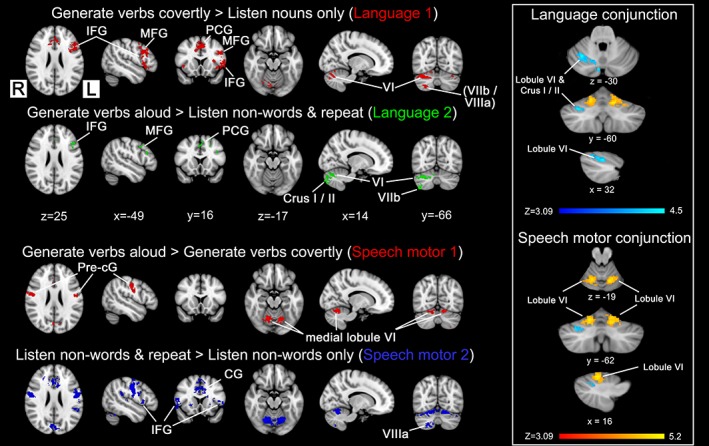
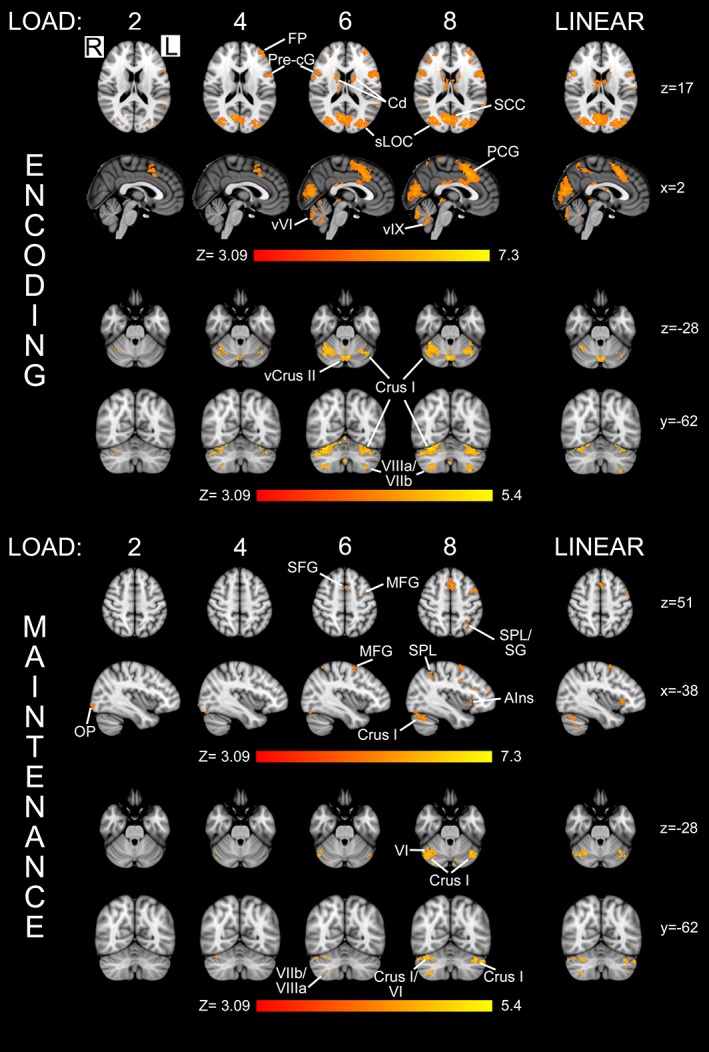
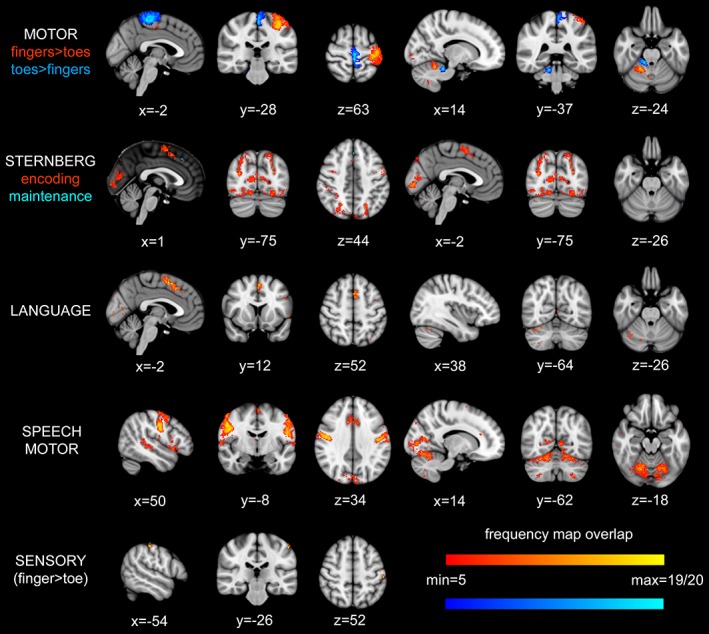
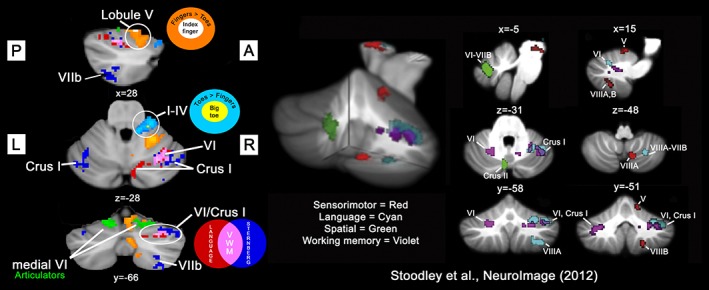
The cerebellum is involved in a wide range of behaviours. A key organisational principle from animal studies is that somatotopically corresponding sensory input and motor output reside in the same cerebellar cortical areas. However, compelling evidence for a similar arrangement in humans and whether it extends to cognitive functions is lacking. To address this, we applied cerebellar optimised whole-brain functional MRI in 20 healthy subjects. To assess spatial overlap within the sensorimotor and cognitive domains, we recorded activity to a sensory stimulus (vibrotactile) and a motor task; the Sternberg verbal working memory (VWM) task; and a verb generation paradigm. Consistent with animal data, sensory and motor activity overlapped with a somatotopic arrangement in ipsilateral areas of the anterior and posterior cerebellum. During the maintenance phase of the Sternberg task, a positive linear relationship between VWM load and activity was observed in right Lobule VI, extending into Crus I bilaterally. Articulatory movement gave rise to bilateral activity in medial Lobule VI. A conjunction of two independent language tasks localised activity during verb generation in right Lobule VI-Crus I, which overlapped with activity during VWM. These results demonstrate spatial compartmentalisation of sensorimotor and cognitive function in the human cerebellum, with each area involved in more than one aspect of a given behaviour, consistent with an integrative function. Sensorimotor localisation was uniform across individuals, but the representation of cognitive tasks was more variable, highlighting the importance of individual scans for mapping higher order functions within the cerebellum.

Keywords: cerebellum; fMRI; language; sensorimotor; working memory.


Conflict of interest statement

The authors declare no potential conflict of interest.

Figures

Figure 1
Figure 1
Sensorimotor integration in the cerebrum and cerebellum (N = 20). For both tasks (motor and sensory), the contrast between hand/finger > foot/toe is shown in red‐yellow colours, and foot/toe > hand/finger is shown in blue‐light blue colours. ‘Motor’: activity within the cerebrum and cerebellum in response to an externally paced movement task. Statistical maps reflect differences in activity in response to movement of the right hand and right foot (performed separately). ‘Sensory’: results of vibrotactile stimulation at 150 Hz of the right index finger and large toe on the right foot with MRI‐compatible piezoelectric tactile stimulators. Activity is shown overlaid on top of the corresponding motor maps (yellow outline). Convergence of sensorimotor input/output is found at the levels of the cerebrum (postcentral gyrus) and cerebellum (toes = Lobules I–IV and fingers = Lobule V). The anatomical level of each section is shown in Montreal Neurological Institute (MNI) coordinates (in mm) beside each image, corresponding to the location of the voxel with highest Z‐value for that contrast [see contrast labels: RED for finger(s) > toe(s), = ‘F > T’; BLUE for toe(s) > finger(s) = ‘T > F’]. Labels anterior/posterior: the listed coordinates refer to activity within anterior/posterior cerebellar lobes, respectively. Motor activity was assessed with cluster forming threshold Z > 3.09 and cluster corrected significance p < .05. Activity in response to vibrotactile stimulation for the cerebellum was obtained with an uncorrected significance threshold of p < .005 [Color figure can be viewed at http://wileyonlinelibrary.com]
Figure 2
Figure 2
Language and speech motor contrasts and associated conjunctions for the language task (N = 19). Contrasts were used to isolate the different parts of the language task and are shown in red, green, and blue. The conjunction of language contrasts (L1 + L2) is blue‐light blue and speech motor contrasts (SM1 + SM2) is red‐yellow, shown for the cerebellum only. Broca's area and the anterior cingulate gyrus remained after subtracting conditions which were primarily associated with just auditory activity (i.e., Contrast L1) or auditory activity plus articulatory movement (i.e., Contrast L2). Activity for the different contrasts and conjunctions were determined using a cluster forming threshold of Z > 3.09 and cluster corrected p < .05. Montreal Neurological Institute (MNI) coordinates (in mm) are shown for the respective sections. CG, cingulate gyrus; IFG, inferior frontal gyrus; MFG, middle frontal gyrus; PCG, paracingulate gyrus; pre‐cG:, precentral gyrus [Color figure can be viewed at http://wileyonlinelibrary.com]
Figure 3
Figure 3
Working memory load and parametric modulation of activity with the cerebellum (N = 19). Activity in response to the Sternberg task is shown for two phases of the test: (1) encoding and (2) maintenance for each load (labelled at the top) along with (3) the output of a parametric model of the increasing load (‘LINEAR’). Notably, there was extensive cerebellar activity within the maintenance phase, when subjects were instructed to rehearse (without moving their lips) the letter string previously visible to them. The anatomical locations of the selected slices are given in Montreal Neurological Institute (MNI) coordinates (in mm) on the right of the figure. All activation maps were derived using a cluster forming threshold of Z > 3.09 and cluster corrected p < .05. AIns, anterior insula; Cd, caudate; FP, frontal pole; MFG, middle frontal gyrus; OP, occipital pole; PCG, paracingulate gyrus; pre‐cG, precentral gyrus; SCC, supracalcarine cortex; SFG, superior frontal gyrus; SG, supramarginal gyrus; sLOC, lateral occipital cortex‐superior division; SPL, superior parietal lobule; vCrus II, vermis Crus II; vVI, Vermis VI; vIX, Vermis IX [Color figure can be viewed at http://wileyonlinelibrary.com]
Figure 4
Figure 4
Frequency maps demonstrating the degree of spatial overlap between participants for each paradigm. Statistical maps for each subject were binarised and transformed to standard space where they were added together, a maximum intensity of 19|20 (yellow, light blue) therefore indicated that there was activation at that location in all subjects while an arbitrary minimum of 5 (red, dark blue) out of 19|20 subjects was used for visualisation purposes. For the MOTOR and STERNBERG frequency maps, the two different colours used to represent the degree of overlap in different contrasts within each of these tasks, please see the colour coding below the task name to the left of the images. Note. For cognitive contrasts, only 19 subjects were included in frequency maps, see text for details. For details of location of maximal overlap, see Table S12, Supporting Information [Color figure can be viewed at http://wileyonlinelibrary.com]
Figure 5
Figure 5
Composite cerebellar map demonstrating topology of sensorimotor and working memory/language function found in this study (on the left). Colour codings for each contrast/conjunction are shown as graphical summaries. For comparison, the results of a previous study (Stoodley et al., 2012) are also shown (on the right). The data obtained in the current study show convergence in both the sensorimotor and cognitive domains. Activity due to passive sensory stimulation of the index finger (white) and big toe (yellow) overlapped with that arising from flexion/extension of the fingers (orange) and toes (light blue), respectively, in the ipsilateral anterior and posterior cerebellar hemisphere. Language (conjunction of language contrasts, red) and Sternberg (linearly increased activity during maintenance of working memory, blue) tasks primarily activated right cerebellar structures. These cognitive tasks also showed a degree of overlap (assessed using a conjunction, pink) in right Crus I/Lobule VI: the putative verbal working memory (VWM) area of the cerebellum. Note that to facilitate visual comparison between studies, data from the current study were flipped horizontally. Statistical maps (including conjunctions) were determined with a cluster forming threshold of Z > 3.09 and corrected significance level of p < .05, with the exception of contrasts based on vibrotactile stimulation (p < .005 uncorrected). (Insert: Stoodley et al., 2012, fig. 1. Reproduced with permission.) [Color figure can be viewed at http://wileyonlinelibrary.com]

Similar articles

Cited by

References

    1. Ai, L. , Oya, H. , Howard, M. , & Xiong, J. (2013). Functional MRI detection of hemodynamic response of repeated median nerve stimulation. Magnetic Resonance Imaging, 31, 550–554. 10.1016/j.mri.2012.10.012 - DOI - PMC - PubMed
    1. Atkins, M. J. , & Apps, R. (1997). Somatotopical organisation within the climbing fibre projection to the paramedian lobule and copula pyramidis of the rat cerebellum. Journal of Comparative Neurology, 389, 249–263. - PubMed
    1. Baddeley, A. (1992). Working memory. Science, 255, 556–559. - PubMed
    1. Baddeley, A. (2000). The episodic buffer: A new component of working memory? Trends in Cognitive Sciences, 4, 417–423. - PubMed
    1. Baddeley, A. (2003). Working memory and language: An overview. Journal of Communication Disorders, 36, 189–208. 10.1016/S0021-9924(03)00019-4 - DOI - PubMed

Publication types