. 2019 Sep;20(9):1279-1297.
doi: 10.1111/mpp.12841. Epub 2019 Jul 30.

Small RNAs from the plant pathogenic fungus Sclerotinia sclerotiorum highlight host candidate genes associated with quantitative disease resistance

Affiliations

Small RNAs from the plant pathogenic fungus Sclerotinia sclerotiorum highlight host candidate genes associated with quantitative disease resistance

Mark Derbyshire et al. Mol Plant Pathol. 2019 Sep.

Abstract

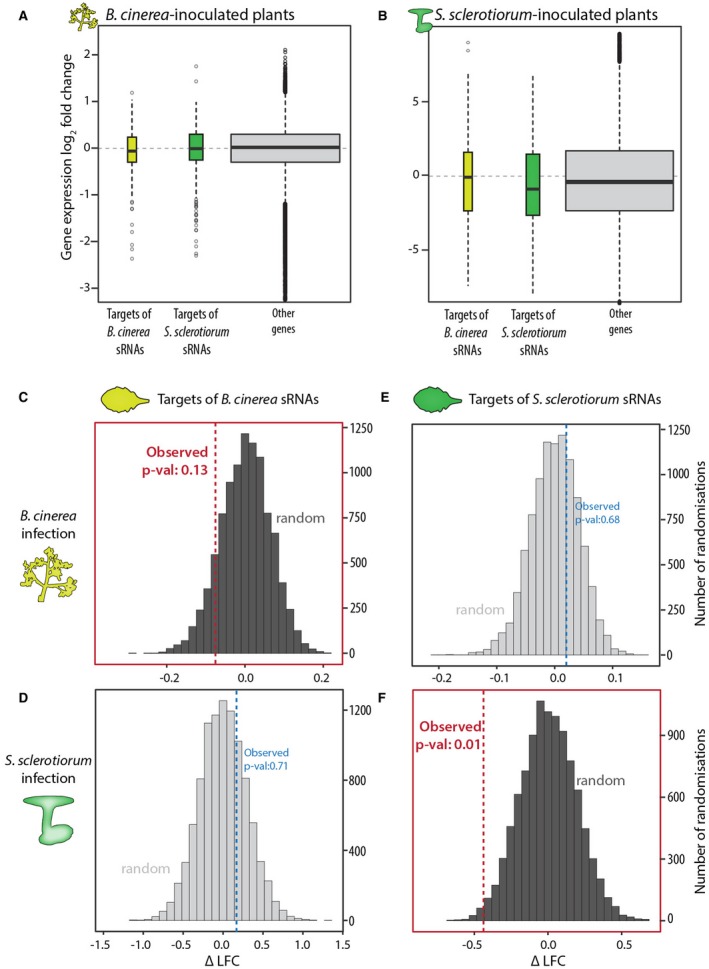
Fungal plant pathogens secrete effector proteins and metabolites to cause disease. Additionally, some species transfer small RNAs (sRNAs) into plant cells to silence host mRNAs through complementary base pairing and suppress plant immunity. The fungus Sclerotinia sclerotiorum infects over 600 plant species, but little is known about the molecular processes that govern interactions with its many hosts. In particular, evidence for the production of sRNAs by S. sclerotiorum during infection is lacking. We sequenced sRNAs produced by S. sclerotiorum in vitro and during infection of two host species, Arabidopsis thaliana and Phaseolus vulgaris. We found that S. sclerotiorum produces at least 374 distinct highly abundant sRNAs during infection, mostly originating from repeat-rich plastic genomic regions. We predicted the targets of these sRNAs in A. thaliana and found that these genes were significantly more down-regulated during infection than the rest of the genome. Predicted targets of S. sclerotiorum sRNAs in A. thaliana were enriched for functional domains associated with plant immunity and were more strongly associated with quantitative disease resistance in a genome-wide association study (GWAS) than the rest of the genome. Mutants in A. thaliana predicted sRNA target genes SERK2 and SNAK2 were more susceptible to S. sclerotiorum than wild-type, suggesting that S. sclerotiorum sRNAs may contribute to the silencing of immune components in plants. The prediction of fungal sRNA targets in plant genomes can be combined with other global approaches, such as GWAS, to assist in the identification of plant genes involved in quantitative disease resistance.

Keywords: Arabidopsis; GWAS; RNAi; effector; necrotrophic fungus; plant immunity; plant pathogen.


Figures

Figure 1
Figure 1
Length distribution and 5′ nucleotide bias of Sclerotinia sclerotiorum sRNAs. (A) The percentage of reads (y‐axis) according to nucleotide (nt) sequence length (x‐axis) obtained in vitro, in Arabidopsis thaliana lesion centres and borders, and in Phaseolus vulgaris lesion centres and borders; reads for this plot obtained before the specified filtering procedure. (B) The percentage of adenine (pink), cytosine (green), guanine (blue) and uridine (grey) in the 5′ position according to read length.
Figure 2
Figure 2
Identification of highly abundant fungal sRNAs and differential expression of fungal sRNAs in planta. (A) Five‐step (i to v) pipeline used to identify the 374 highly abundant core sRNAs in Sclerotinia sclerotiorum and differentially expressed sRNAs. Small RNAs expressed to a level of ≥ 100 reads per million (rpM) on both hosts in all replicates of at least one in planta sample (iv) were designated as abundant core sRNAs and were analysed for differential expression in planta relative to in vitro (v) (B, C). Heat maps of normalized expression data for the sRNAs identified using the procedure in (A). B, lesion border; C, lesion centre; FC, fold change; nt, nucleotides.
Figure 3
Figure 3
Differential expression of fungal sRNAs in Arabidopsis thaliana and Phaseolus vulgaris. (A) Venn diagram showing the number of Sclerotinia sclerotiorum sRNAs abundant (≥100 reads per million) and upregulated in A. thaliana or P. vulgaris relative to in vitro. (B) Heat map of normalized expression data for the 94 sRNAs identified in (A). B, lesion border; C, lesion centre; Norm., normalized; nt, nucleotides; rpM, reads per million.
Figure 4
Figure 4
sRNA loci are associated with transposable elements, plastic and gene‐sparse genomic regions. (A) Percentage of sRNA loci (y‐axis) that overlap different classes of repeat sequence annotated by REPET (x‐axis). Unclass., unclassified. (B) Number of polymorphisms (y‐axis) in 25 Sclerotinia sclerotiorum isolates per 10 kb sliding window. Ten‐kb windows were analysed across the whole S. sclerotiorum genome and split into windows containing 0 and ≥ 1 sRNA locus (x‐axis). P value for a Wilcoxon’s rank sum test is shown. (C) Distance to neighbouring genes in base pairs (bp) from the 5′ (x‐axis) and 3′ (y‐axis) ends of sRNA loci (left) and effectors (right). Blue points represent sRNAs or effectors and the underlying heat map is for all S. sclerotiorum gene annotations. Mean distances for all S. sclerotiorum genes are show by grey dashed lines, mean distances for sRNAs or effectors are shown by red dashed lines represent with P value of a Wilcoxon’s test for significant difference.
Figure 5
Figure 5
Predicted targets of Sclerotinia sclerotiorum sRNAs in Arabidopsis thaliana are significantly down‐regulated during infection. (A) Expression log2 (fold change) (LFC) (y‐axis) on inoculation by Botrytis cinerea for A. thaliana genes that were predicted targets of B. cinerea sRNAs (yellow), predicted targets of S. sclerotiorum sRNAs (green) and all other genes (grey). Horizontal black lines represent median LFC, whiskers represent interquartile range and boxes represent second and third quartiles. (B) The same as for (A) on inoculation by S. sclerotiorum. (C)–(F) Distribution of difference in median LFC (∆LFC) between genes targeted or not by sRNAs in 10 000 randomizations (grey). Dashed vertical lines represent the observed ∆LFC. Predicted A. thaliana targets of B. cinerea sRNAs during infection with B. cinerea (C) and infection with S. sclerotiorum (D). Predicted A. thaliana targets of the 374 abundant S. sclerotiorum sRNAs during infection with B. cinerea (E) and infection with S. sclerotiorum (F).
Figure 6
Figure 6
Predicted targets of Sclerotinia sclerotiorum sRNAs in Arabidopsis thaliana associated with quantitative disease resistance (QDR). (A) Enrichment (–log(p) (y‐axis)) of GO terms in putative A. thaliana targets of the 374 S. sclerotiorum core sRNAs. The ratio of the observed to expected proportions of the GO terms in sRNA targets is on the x‐axis. The size of points represents the number of predicted sRNA target candidates annotated with the GO term. Molecular function GO terms are in orange and biological process GO terms are in blue. Several terms discussed in the text are highlighted that indicate roles in signalling, hormone metabolism and defence against pathogens. (B) QDR scores (–log10(P) of association) (y‐axis) for A. thaliana genes predicted to be targeted by the 374 abundant S. sclerotiorum sRNAs (left) and other genes (right). P value for a Wilcoxon’s test is shown. (C) Distribution of ∆%HQS (difference in the % of genes with a QDR association score >1.3 between genes targeted or not by sRNAs) in 10 000 randomizations (grey). The vertical dashed line represents the observed ∆%HQS for A. thaliana genes targeted or not by S. sclerotiorum sRNAs.
Figure 7
Figure 7
SNAK2 and SERK2 are two Arabidopsis genes associated with quantitative disease resistance identified based on Sclerotinia sclerotiorum sRNA analysis. (A) Schematic representation of the coding sequence from three top candidate sRNA targets showing the predicted sRNA target site. Sclerotinia sclerotiorum sRNA sequence is indicated in red, the corresponding predicted mRNA target sequence in grey and the corresponding CDS sequence in black. The position along the CDS is indicated relative to the transcription start site. Blue arrows indicate the position of amplicons generated in qRT‐PCR assays. Green triangles indicate the position of T‐DNAs in A. thaliana mutant lines used in this work. (B) Relative gene expression for three A. thaliana predicted targets of S. sclerotiorum sRNAs determined by qRT‐PCR in plants uninoculated and 24 hours post‐inoculation by S. sclerotiorum. Labels show average log2 (fold change) (LFC) on inoculation and the P value of a Welch t‐test. Values for three to seven independent biological samples are shown. (C) qRT‐PCR determination of 5′–3′ΔC t as a reporter of mRNA stability in A. thaliana leaves inoculated by S. sclerotiorum. The 5′–3′ΔC t corresponds to the difference in crossing time determined by qRT‐PCR for amplicons located at the 5′ and the 3′ ends of target mRNA. Values for 5′–3′ΔC t increase when mRNA stability decreases. Boxplots show the first and third quartiles (box), median (horizontal line) and 90% confidence intervals (whiskers). Values were determined from three to seven distinct plants 24 hours post‐inoculation by S. sclerotiorum. (D) Representative disease symptoms 24 hours post‐inoculation by S. sclerotiorum on five A. thaliana genotypes. Red dotted lines delimit disease lesions. Bars: 0.5 cm. (E) Arabidopsis plants defective in SERK2 and SNAK2, predicted targets of S. sclerotiorum sRNAs, were more susceptible to S. sclerotiorum than wild‐type plants. Lesion sizes were measured at 24 hours post‐inoculation on leaves from 11 to 20 plants. Similar results were obtained in two out of three independent biological experiments. Arabidopsis accessions Rubezhnoe (Rub) and Shahdara (Sha) were used as resistant and susceptible controls, respectively. Boxplots show the first and third quartiles (box), median (horizontal line) and the most dispersed values within 1.5 times the interquartile range (whiskers). Significance of the difference to Col‐0 was assessed by a Welch t‐test (***P < 0.001).

Similar articles

Cited by

References

    1. Alexa, A. , Rahnenführer, J. and Lengauer, T. (2006) Improved scoring of functional groups from gene expression data by decorrelating GO graph structure. Bioinformatics, 22, 1600–1607. - PubMed
    1. Anders, S. and Huber, W. (2010) Differential expression analysis for sequence count data. Genome Biol. 11, R106. - PMC - PubMed
    1. Badet, T. , Peyraud, R. and Raffaele, S. (2015) Common protein sequence signatures associate with Sclerotinia borealis lifestyle and secretion in fungal pathogens of the Sclerotiniaceae. Front. Plant Sci. 6, 776. - PMC - PubMed
    1. Badet, T. , Voisin, D. , Mbengue, M. , Barascud, M. , Sucher, J. , Sadon, P. , Balagué, C. , Roby, D. and Raffaele, S. (2017a) Parallel evolution of the POQR prolyl oligo peptidase gene conferring plant quantitative disease resistance. PLoS Genet. 13, e1007143. - PMC - PubMed
    1. Badet, T. , Peyraud, R. , Mbengue, M. , Navaud, O. , Derbyshire, M. , Oliver, R.P. , Barbacci, A. and Raffaele, S. (2017b) Codon optimization underpins generalist parasitism in fungi. eLife. 6, e22472. - PMC - PubMed

Publication types

MeSH terms

Substances

LinkOut - more resources