. 2019 Jul 30;129(10):4492-4505.
doi: 10.1172/JCI128212.

Molecular profiling stratifies diverse phenotypes of treatment-refractory metastatic castration-resistant prostate cancer

Affiliations

Molecular profiling stratifies diverse phenotypes of treatment-refractory metastatic castration-resistant prostate cancer

Mark P Labrecque et al. J Clin Invest. .

Abstract

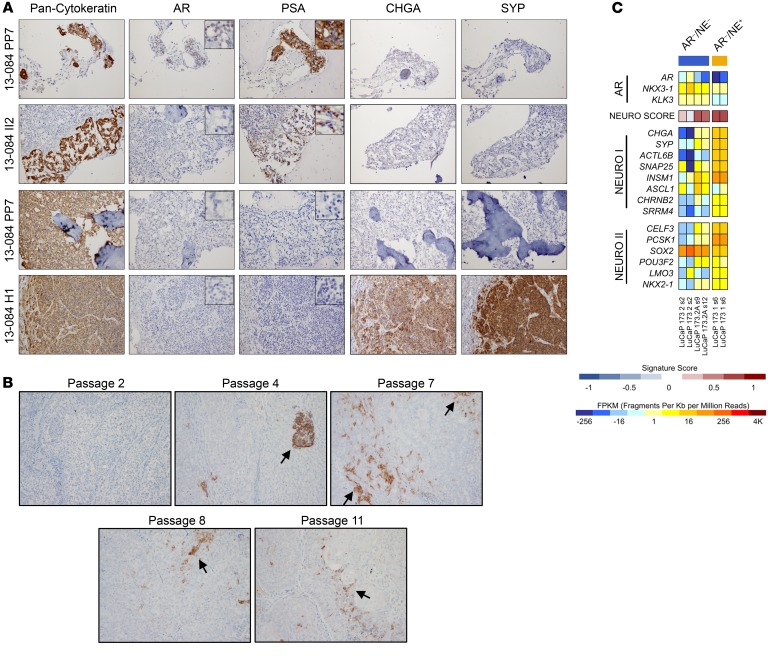
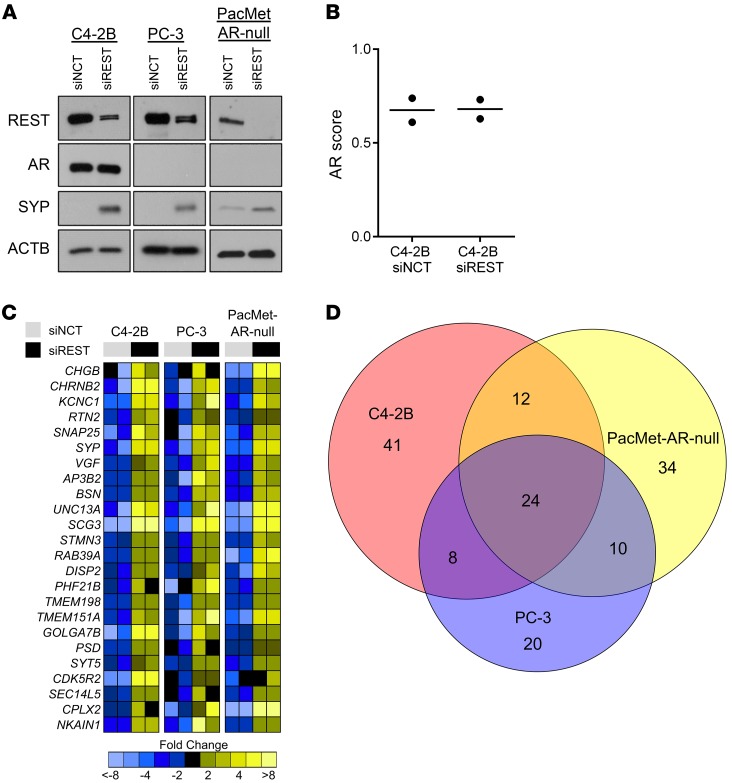
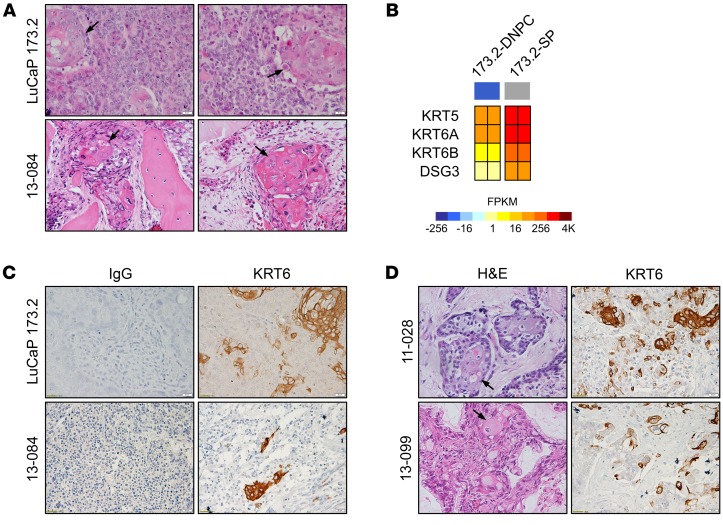
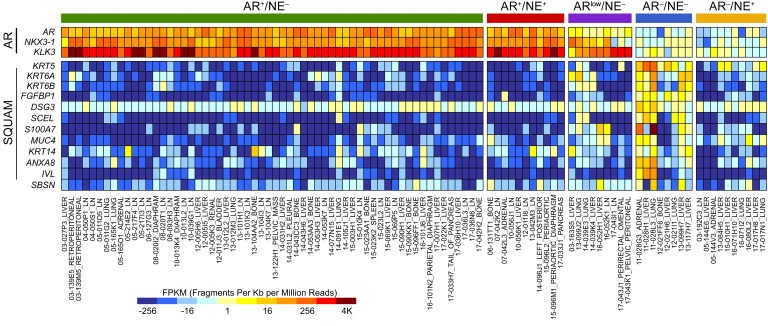
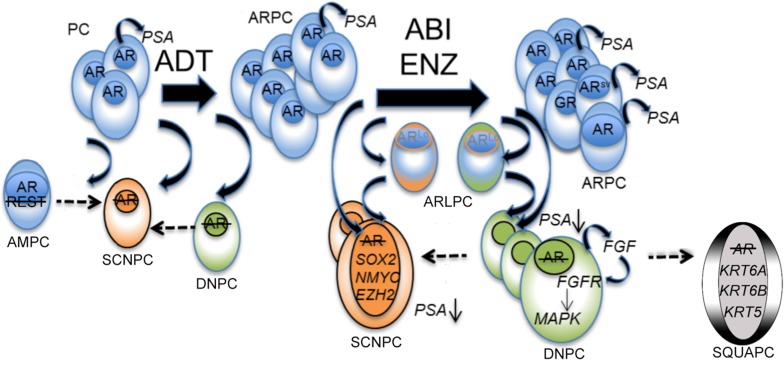
Metastatic castration-resistant prostate cancer (mCRPC) is a heterogeneous disease with diverse drivers of disease progression and mechanisms of therapeutic resistance. We conducted deep phenotypic characterization of CRPC metastases and patient-derived xenograft (PDX) lines using whole genome RNA sequencing, gene set enrichment analysis and immunohistochemistry. Our analyses revealed five mCRPC phenotypes based on the expression of well-characterized androgen receptor (AR) or neuroendocrine (NE) genes: (i) AR-high tumors (ARPC), (ii) AR-low tumors (ARLPC), (iii) amphicrine tumors composed of cells co-expressing AR and NE genes (AMPC), (iv) double-negative tumors (i.e. AR-/NE-; DNPC) and (v) tumors with small cell or NE gene expression without AR activity (SCNPC). RE1-silencing transcription factor (REST) activity, which suppresses NE gene expression, was lost in AMPC and SCNPC PDX models. However, knockdown of REST in cell lines revealed that attenuated REST activity drives the AMPC phenotype but is not sufficient for SCNPC conversion. We also identified a subtype of DNPC tumors with squamous differentiation and generated an encompassing 26-gene transcriptional signature that distinguished the five mCRPC phenotypes. Together, our data highlight the central role of AR and REST in classifying treatment-resistant mCRPC phenotypes. These molecular classifications could potentially guide future therapeutic studies and clinical trial design.

Keywords: Cell Biology; Expression profiling; Molecular pathology; Oncology; Prostate cancer.


Conflict of interest statement

Conflict of interest: CSH has been compensated through honoraria from Genentech and as a consultant for Astellas, Bayer, Blue Earth Diagnostics, Clovis Oncology, Ferring, Myriad Genetics, Orion Corporation, Janssen, Hinova, and Tolmar; she has research funding from Aragon Pharmaceuticals, Astellas, AstraZeneca, Bayer, Dendreon, Emergent BioSolutions, Genentech, Medivation, Pfizer, and Roche; she has received travel, accommodation, and expenses from Astellas, Bayer, Blue Earth Diagnostics, Clovis Oncology, Ferring, Genentech, Menarini, Myriad Genetics, Orion Pharma GmbH, Hinova, and Pfizer; she has an immediate family member employed by CTI BioPharma with stock and/or other ownership interests in CTI BioPharma. EYY has been compensated as a consultant for Bayer and Merck and has research support from Agensys, Dendreon, Merck, and Seattle Genetics. HHC has research support from Clovis Oncology, Janssen, Sanofi, and Astellas. BM has research support from Janssen, Beigene, and AstraZeneca. MTS has research support from Janssen, AstraZeneca, Zenith Epigenetics, Pfizer, and Hoffmann-La Roche. ACH has research support from eFFECTOR Inc. EC has research support from Sanofi, AstraZeneca, Gilead, Zenith Epigenetics, Genentech, Janssen, Forma Pharmaceuticals, Bayer, and Abbvie. PSN has been compensated as an advisor to Janssen and has provided expert testimony related to drugs sold by Astellas.

Figures

Figure 1
Figure 1. Molecular profiling of mCRPC reveals a heterogeneous disease.
(A) IHC of 5 mCRPC sites from patients using antibodies to AR, PSA, CHGA, and SYP. Scale bars: 20 μM. (B) RNA-Seq heatmap of mCRPC specimens acquired through rapid autopsy from 2003–2017 (n = 98). REST-repressed NE genes are listed in the NEURO I panel (top), NE transcription factors are listed in the NEURO II panel (middle), and AR-associated genes are listed in the AR panel (bottom). Results are expressed as log2 fragments per kilobase of transcript per million mapped reads (FPKM) and colored according to scale. (C) Venn diagram showing the number of unique and shared upregulated genes between phenotypes relative to ARPC (up >3-fold; P < 0.05). ARPC (AR-high prostate cancer; AR+/NE), ARLPC (AR-low prostate cancer; ARlow/NE), AMPC (amphicrine prostate cancer; AR+/NE+), DNPC (double-negative prostate cancer; AR/NE), and SCNPC (small cell or neuroendocrine prostate cancer; AR/NE+).
Figure 2
Figure 2. Disease progression is a continuum in mCRPC specimens.
(A) IHC of different mCRPC sites from patient 13-084. Site PP7 (bone; ARPC), II2 (bone; ARLPC), PP7 (bone; DNPC), and H1 (liver, SCNPC). Primary antibodies were directed toward pan-cytokeratin, AR, PSA, CHGA, and SYP. Insets for AR and PSA staining are images of the same section using the ×400 objective lens. Original magnification 40×. (B) IHC of LuCaP 173.2 tumor sections from passages 2, 4, 7, 8, and 11 using a SYP antibody. Black arrows point to clusters of cells with SYP positivity. Magnification 100×. (C) RNA-Seq heatmap and NEURO score of LuCaP 173.1 and serial passages from LuCaP 173.2. Results are expressed as log2 FPKM or as enrichment scores and are colored according to scale.
Figure 3
Figure 3. REST splicing occurs in AMPC and SCNPC phenotypes.
(A) Immunofluorescence of an AMPC LuCaP 77CR tumor using PSA (green) and SYP (red) antibodies. Sections were counterstained with DAPI (blue) and top panels represent LuCaP 77CR PDX sections stained with secondary antibody only. Scale bars: 20 μM. (B) Immunoblot of LuCaP PDX specimens probing for REST, AR, and SYP. ACTB was used as a loading control. Short, 10-second film exposure; long, 5-minute film exposure. (C) PCR of LuCaP PDX specimens using primers specific to REST shows the REST4 insertion sequence appearing in AMPC (LuCaP 77CR) and SCNPC (LuCaP 93, 145.2, and 173.1) but not in DNPC (LuCaP 173.2) or ARPC (LuCaP 86.2 and 73). (D) RNA-Seq heatmap of VCaP cells displaying NE-associated genes (NEURO I and NEURO II) and AR-associated genes. Results are expressed as log2 FPKM and colored according to scale. (E) Immunoblot of C4-2B, VCaP, and LuCaP 93 whole-cell extracts using antibodies against AR, REST, SYP, and ACTB. ACTB was used as a loading control. (F) PCR of C4-2B, VCaP, and NCIH660 cells using primers specific to REST. The upper band represents the REST4 splice variant.
Figure 4
Figure 4. REST knockdown in AR-expressing and AR-null CRPC cell lines.
(A) Immunoblot of REST, AR, SYP, and ACTB using C4-2B, PC-3, and PacMet AR-null cells transfected with either REST siRNA (siREST) or negative control siRNA (siNCT). (B) AR activity scores assessed in C4-2B cells transfected with siNCT (n = 2) or siREST (n = 2) by RNA-Seq. (C) RNA-Seq heatmap of the 24 common upregulated genes (up >3-fold; P < 0.05) between C4-2B, PC-3, and PacMet AR-null cells transfected with siREST or siNCT. Log2 mean-centered ratios of genes are depicted and colored according to scale. (D) Venn diagram describing the interrelationships of all upregulated genes (vs. siNCT; up >3-fold; P < 0.05) identified through RNA-Seq in siREST transfected cell lines.
Figure 5
Figure 5. DNPC can convert to a squamous phenotype.
(A) H&E staining of mCRPC tissues from LuCaP 173.2 and patient 13-084. Black arrows point to squamous pearl structures. (B) Expression of squamous cell lung cancer associated genes from RNA-Seq of LuCaP 173.2 DNPC cells and squamous pearl (SP) cells isolated by laser capture microdissection. Results are expressed as log2 FPKM and colored according to scale. (C) IHC of specimens from LuCaP 173.2 and patient 13-084 using KRT6 antibody or IgG as a negative control. (D) H&E staining (left panels) and KRT6 IHC (right panels) of DNPC tumor sections from patients 11-028 and 13-099. Scale bars: 20 μM.
Figure 6
Figure 6. Expression of squamous markers is associated with DNPC and ARLPC.
RNA-Seq heatmap of patient specimens (n = 98) highlighting AR-regulated genes and genes associated with squamous pearl cells (SQUAM). Results are expressed as log2 FPKM and colored according to scale.
Figure 7
Figure 7. Cluster analysis using AR, NE, and squamous gene expression profiles segregates mCRPC specimens and LuCaP PDX models into the different phenotypes.
(A) RNA sequencing of mCRPC specimens acquired between 2003–2017 (n = 98; modified from Figure 1B). NE genes listed in the NEURO I and NEURO II panels, AR and AR-regulated genes are listed in the AR panel, and squamous associated genes are shown in SQUAM panel. Results are expressed as log2 FPKM and colored according to scale. Multidimensional scaling and cluster analysis of (B) mCRPC specimens (n = 98) and (C) LuCaP PDX models using the 26-gene set depicted in A. The LuCaP analysis was conducted on 18 distinct PDX lines (n = 2 for each line). ARPC (AR+/NE; green), ARLPC (ARlow/NE; purple), DNPC (AR/NE; blue), AMPC/mixed (AR+/NE+; red), SCNPC (AR/NE+; yellow).
Figure 8
Figure 8. Schematic of the mCRPC disease continuum.
The proposed mechanisms, molecular drivers, and cellular differentiation states following AR pathway inhibition therapy. ADT, androgen deprivation therapy; ABI, abiraterone; ENZ, enzalutamide; PC, hormone-sensitive prostate cancer; ARPC, AR-high prostate cancer; ARLPC, AR-low prostate cancer; SCNPC, small cell or NE prostate cancer; DNPC, double-negative prostate cancer; AMPC, amphicrine prostate cancer; SQUAPC, squamous prostate cancer.

Comment in

Similar articles

Cited by

References

    1. Heinlein CA, Chang C. Androgen receptor in prostate cancer. Endocr Rev. 2004;25(2):276–308. doi: 10.1210/er.2002-0032. - DOI - PubMed
    1. Scher HI, et al. Increased survival with enzalutamide in prostate cancer after chemotherapy. N Engl J Med. 2012;367(13):1187–1197. doi: 10.1056/NEJMoa1207506. - DOI - PubMed
    1. Ryan CJ, et al. Abiraterone in metastatic prostate cancer without previous chemotherapy. N Engl J Med. 2013;368(2):138–148. doi: 10.1056/NEJMoa1209096. - DOI - PMC - PubMed
    1. Kumar A, et al. Substantial interindividual and limited intraindividual genomic diversity among tumors from men with metastatic prostate cancer. Nat Med. 2016;22(4):369–378. doi: 10.1038/nm.4053. - DOI - PMC - PubMed
    1. Bluemn EG, et al. Androgen receptor pathway-independent prostate cancer is sustained through FGF signaling. Cancer Cell. 2017;32(4):474–489. doi: 10.1016/j.ccell.2017.09.003. - DOI - PMC - PubMed

Publication types

MeSH terms

Substances