Clinical Trial
. 2019 Jul 30;129(11):4629-4642.
doi: 10.1172/JCI126714.

HIV-1 in lymph nodes is maintained by cellular proliferation during antiretroviral therapy

Affiliations
Clinical Trial

HIV-1 in lymph nodes is maintained by cellular proliferation during antiretroviral therapy

William R McManus et al. J Clin Invest. .

Abstract

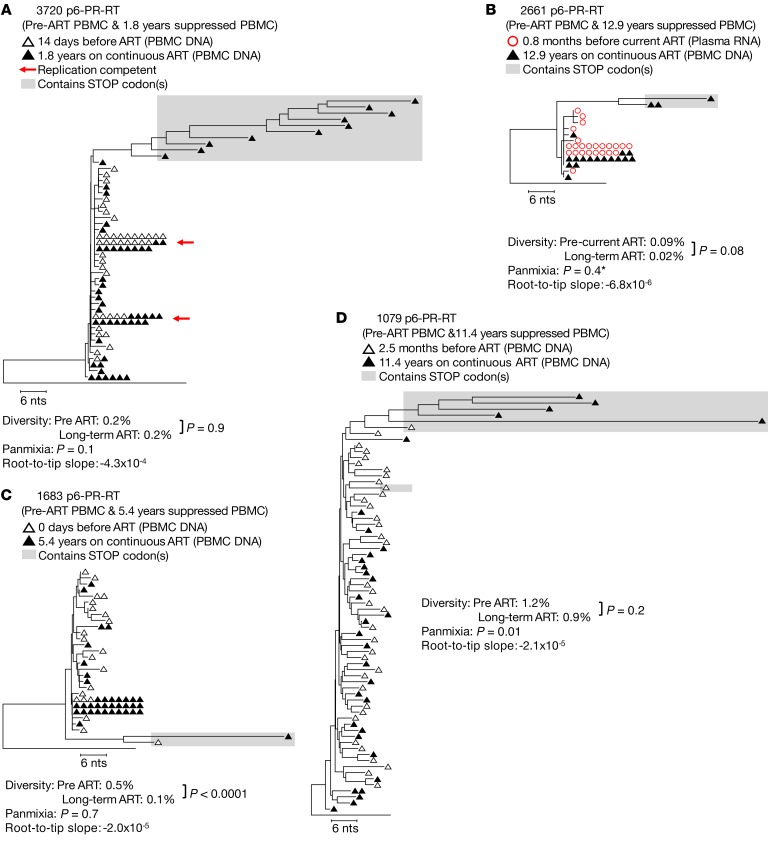
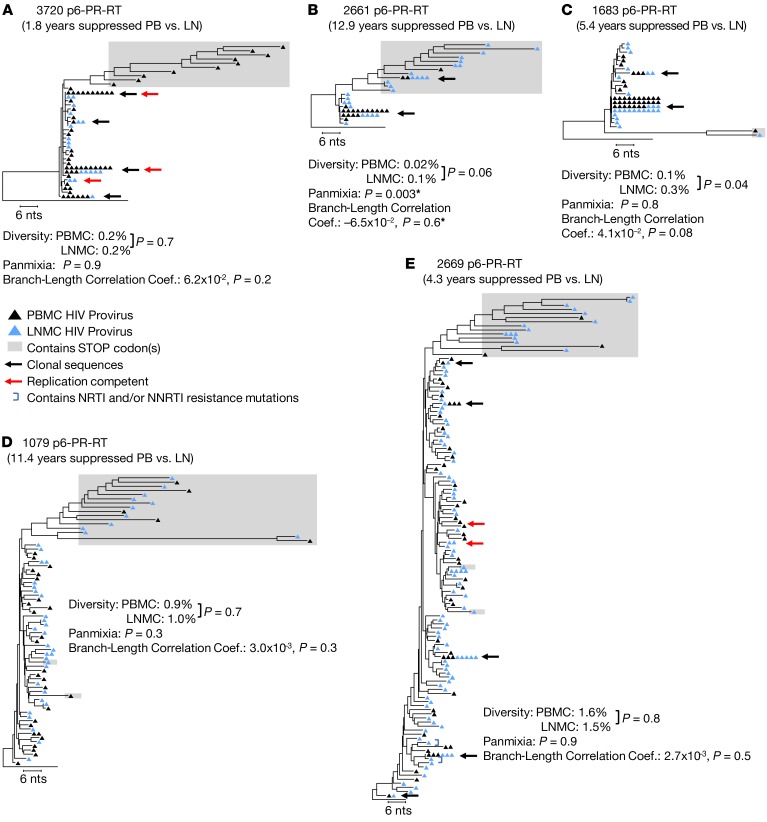
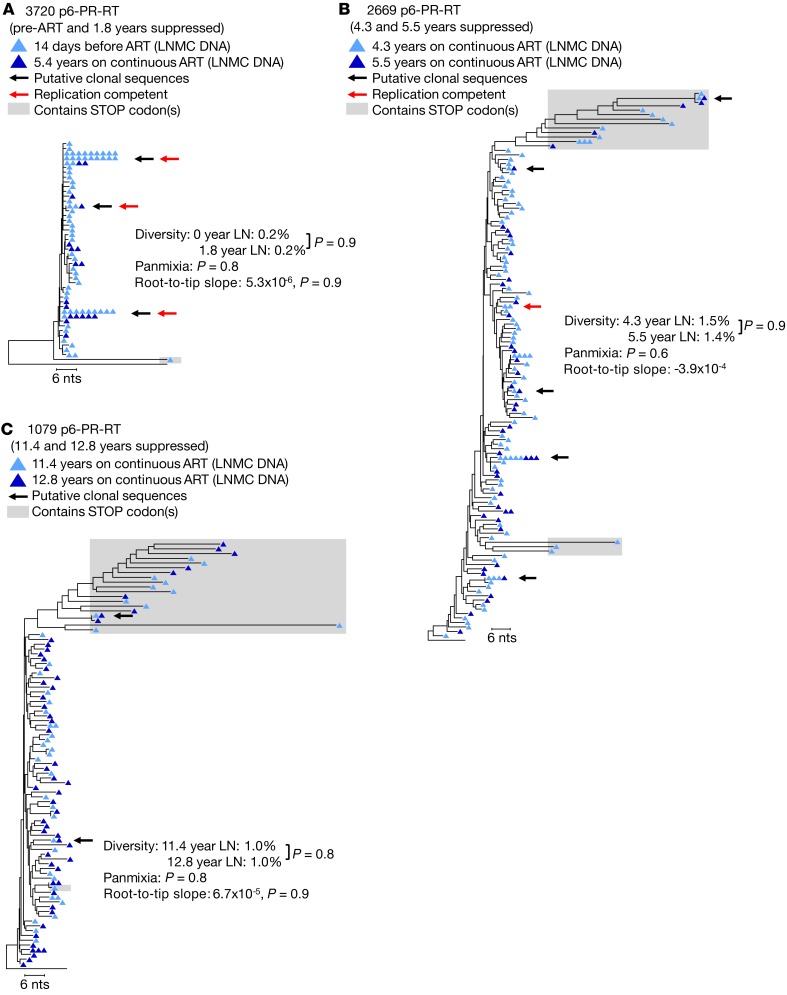
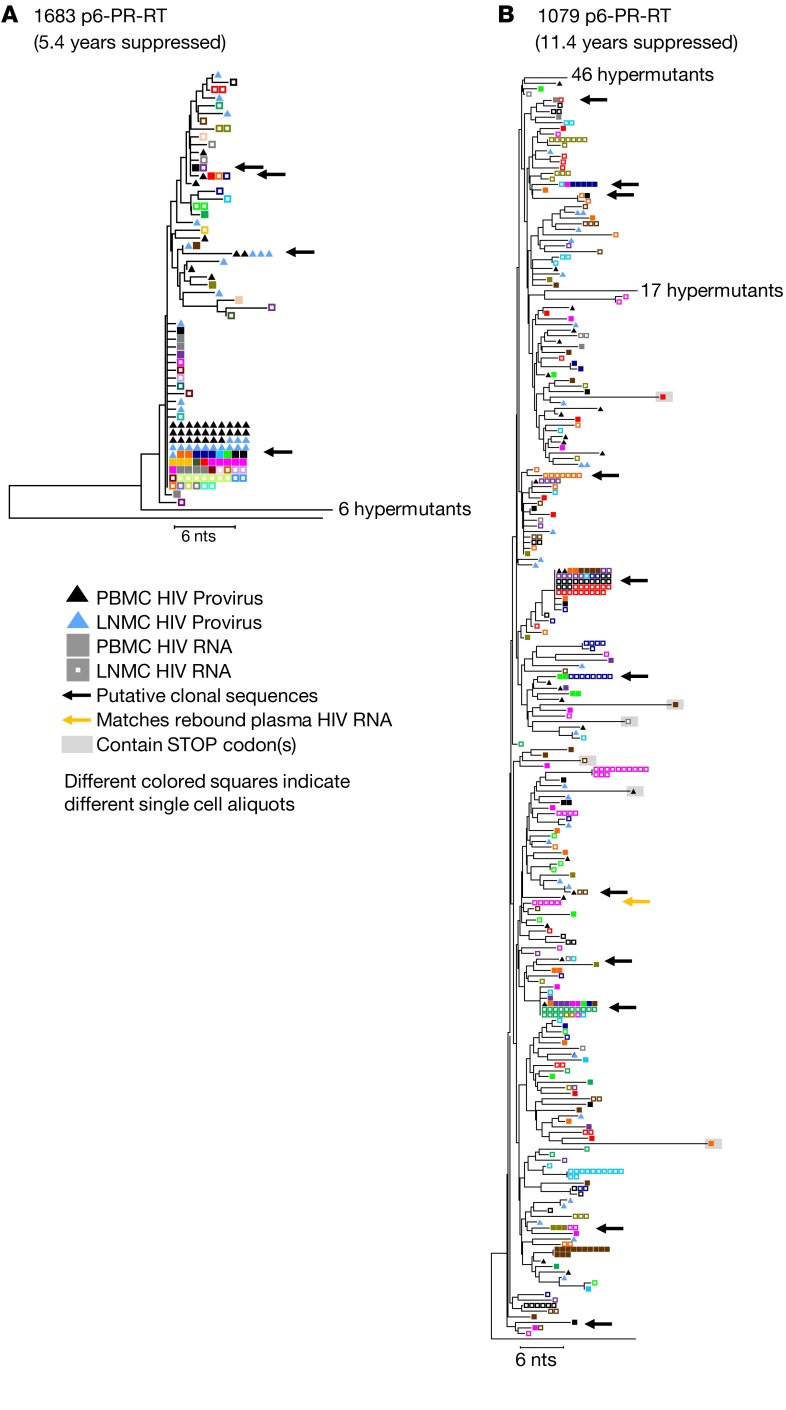
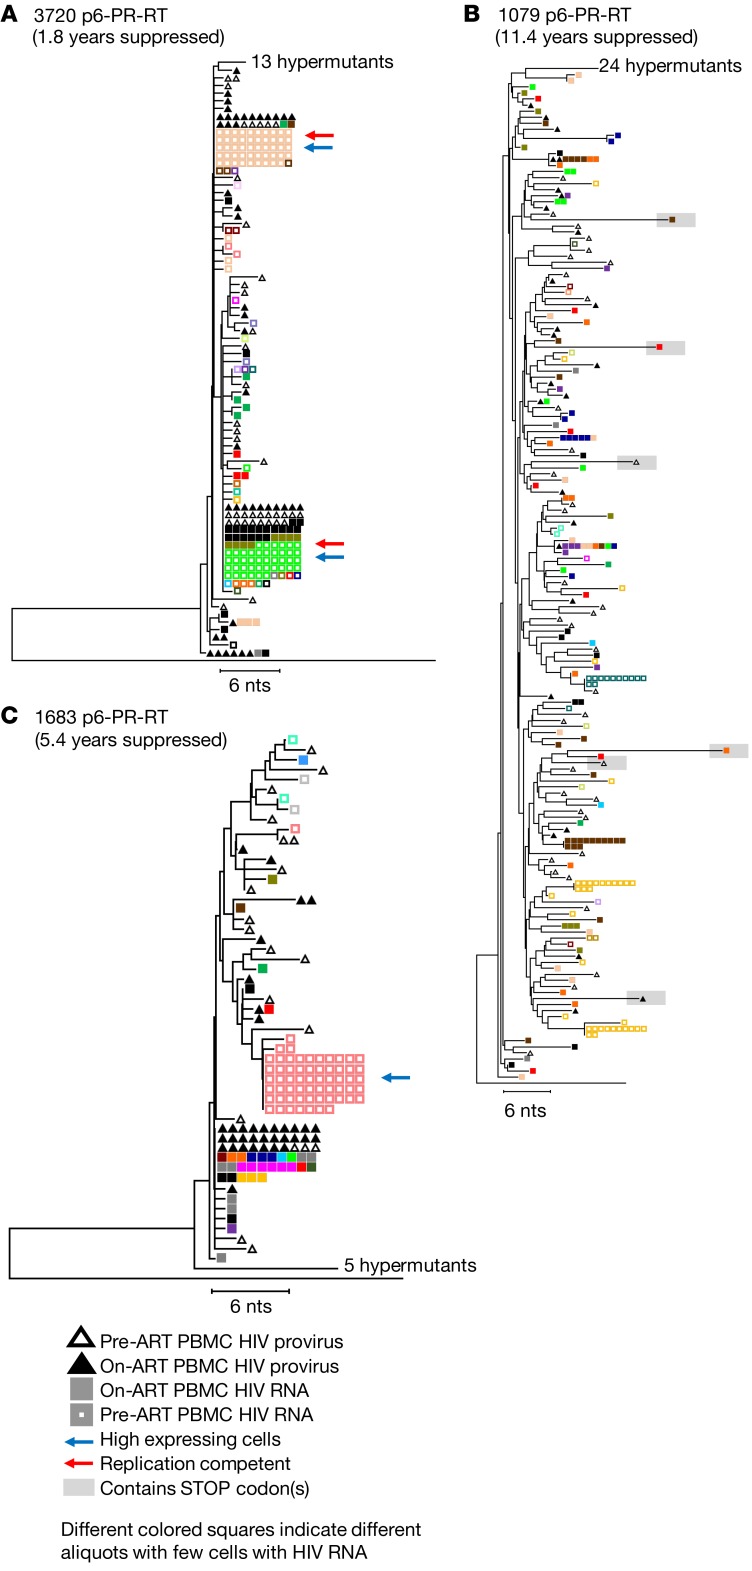
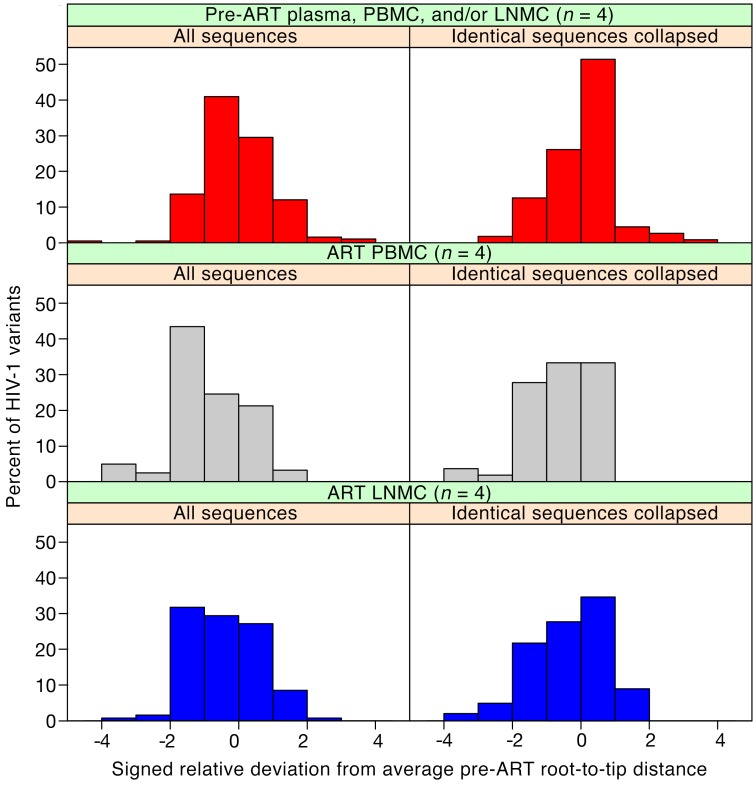
To investigate the possibility that HIV-1 replication in lymph nodes sustains the reservoir during ART, we looked for evidence of viral replication in 5 donors after up to 13 years of viral suppression. We characterized proviral populations in lymph nodes and peripheral blood before and during ART, evaluated the levels of viral RNA expression in single lymph node and blood cells, and characterized the proviral integration sites in paired lymph node and blood samples. Proviruses with identical sequences, identical integration sites, and similar levels of RNA expression were found in lymph nodes and blood samples collected during ART, and no single sequence with significant divergence from the pretherapy population was present in either blood or lymph nodes. These findings show that all detectable persistent HIV-1 infection is consistent with maintenance in lymph nodes by clonal proliferation of cells infected before ART and not by ongoing viral replication during ART.

Keywords: AIDS/HIV; Lymph; T cells.


Conflict of interest statement

Conflict of interest: JWM is a consultant for and has received grants from Gilead Sciences and owns shares of Cocrystal Pharma Inc.

Figures

Figure 1
Figure 1. HIV-1 P6-PR-RT proviral DNA and plasma virus RNA sequences prior to and during long-term ART.
Neighbor joining trees were constructed from single-genome P6-PR-RT proviral DNA sequences obtained from PBMCs (hollow black triangles; A, C, and D) or RNA sequences obtained from plasma virus (hollow red circles; B) prior to the most recent period of continuous viral suppression on ART and proviral DNA sequences obtained from PBMC samples taken after 1.8–12.9 years of viral suppression on ART (solid black triangles). Diversity was measured by APD, and measures were compared using an unpaired t test. Divergence was measured by a test for panmixia (to correct for multiple comparisons, populations are considered to be statistically different when the probability of panmixia is less than 0.001). Red arrows indicate sequences matching virus obtained in a viral outgrowth assay (30). Root-to-tip distances were measured using maximum likelihood trees, and the slopes of the root-to-tip distances over time were calculated by linear regression (units for slopes are substitutions/year). In cases where the slope was positive, an F-test was used to determine if the root-to-tip slopes were significantly different from zero. A is rooted on the HIV-1 subtype C consensus sequence, and BD are rooted on the subtype B consensus sequence. Sequences containing G to A hypermutations and/or stop codons in open reading frames (indicated by shaded boxes) were excluded from all analyses. Except where unique variants were too few to test statistically (indicated by *), rakes of identical sequences were collapsed to a single variant for the test for panmixia and branch-length analysis. Results from a total of 8 samples (2 samples each from 4 patients) are represented in this figure.
Figure 2
Figure 2. HIV-1 P6-PR-RT proviral DNA populations in lymph nodes and peripheral blood during ART.
Neighbor joining trees were constructed from single-genome P6-PR-RT proviral sequences obtained from PBMCs (black triangles) and LNMCs (blue triangles) after 1.8–12.9 years of continuous viral suppression on ART. Diversity, divergence, and root-to-tip distances were measured as described in the legend to Figure 1. Branch-length correlation coefficients were calculated from maximum likelihood trees, and significance was assessed by a permutation test as described in Methods. Black arrows indicate identical sequences that were found in both locations. The presence of identical viral sequences in both locations is likely due to clonal expansion of HIV-1–infected cells. Red arrows indicate sequences that matched virus recovered in the viral outgrowth assay. A is rooted on the HIV-1 subtype C consensus sequence; BE are rooted on the HIV-1 subtype B consensus sequence. Sequences containing G to A hypermutation and/or stop codons in open reading frames (indicated by shaded boxes) were excluded from all analyses. Except where indicated (*), rakes of identical sequences were collapsed to a single variant for the test for panmixia and branch-length analysis. Results from a total of 10 samples (2 samples each from 5 patients) are represented in this figure.
Figure 3
Figure 3. HIV-1 P6-PR-RT proviral DNA sequences from longitudinal lymph node samples.
Neighbor joining trees were constructed from single-genome P6-PR-RT proviral sequences obtained from LNMC at 2 time points: the first prior to ART initiation or after 11.4 or 4.3 years on ART (dark blue triangles) and the second approximately 1 year later (light blue triangles). Diversity, divergence, and root-to-tip distances were measured as described in the legend to Figure 1. Black arrows indicate clonal sequences present at both time points, and red arrows indicate sequences matching virus that grew in the viral outgrowth assay. A is rooted on the HIV-1 subtype C consensus sequence, and B and C are rooted on the subtype B consensus sequence. Sequences containing G to A hypermutation and/or stop codons in open reading frames (indicated by shaded boxes) were excluded from all analyses. Results from a total of 6 samples (2 samples each from 3 patients) are represented in this figure.
Figure 4
Figure 4. HIV-1 cell-associated RNA sequences obtained from single cells in peripheral blood and in lymph nodes during ART.
Neighbor joining trees were constructed from single-genome P6-PR-RT proviral DNA and cell-associated HIV-1 RNA sequences obtained from paired PBMCs and LNMCs sampled during continuous viral suppression on ART. Black and blue triangles indicate HIV-1 DNA sequences from PBMCs and LNMCs, respectively; solid squares and hollow squares indicate HIV-1 RNA sequences from PBMCs and LNMCs, respectively. Squares with no genetic difference of the same color indicate sequences that are assumed to be from the expression of single infected cells. Black arrows indicate sequences detected in probable clones in both the samples. The yellow arrow indicates a sequence detected in rebound plasma viremia. Trees are rooted on the subtype B consensus sequence. Results from a total of 8 samples (4 samples each from 2 patients) are represented in this figure.
Figure 5
Figure 5. HIV-1 cell-associated RNA from single cells in peripheral blood prior to and during long-term ART.
Neighbor joining trees were constructed from single-genome P6-PR-RT proviral DNA and cell-associated HIV-1 RNA sequences obtained from PBMCs sampled prior to ART initiation (hollow triangles indicate proviral sequences, hollow squares indicate RNA sequences) and after 1.8–11.4 years of viral suppression on ART (solid triangles indicate proviral sequences, solid squares indicate RNA sequences). Squares of the same color indicate sequences that are assumed to be from the expression of single infected cells. The blue arrows indicate high expressing cells (>20 HIV-1 RNA copies), and red arrows indicate sequences matching virus that grew in the viral outgrowth assay. A is rooted on the HIV-1 subtype C consensus sequence, and B and C are rooted on the subtype B consensus sequence. Results from a total of 12 samples (4 samples each from 3 patients) are represented in this figure.
Figure 6
Figure 6. HIV-1 root-to-tip distances normalized to pre-ART average.
Signed relative standard deviations were calculated for each sequence (including either all sequences or only each distinct variant) from each patient, as described in Methods. These data were separated into categories of pre-ART, on-ART PBMCs, and on-ART LNMCs, and the values from all patients were aggregated and plotted separately for each group in red, grey, and blue for pre-ART, on-ART PBMCs, and on-ART LNMCs, respectively, in bin sizes of 1 SD. A negative relative standard deviation indicates a regression from the mean and a positive value indicates an increase from the mean. Patient 2669 was excluded from this analysis due to lack of pre-ART sampling. Sequences from patient 2661 included pre-ART plasma sequence data, and sequences from patient 3720 included both pre-ART PBMC and LNMC data. All sequences containing G to A hypermutation and/or stop codons in open reading frames were excluded from the analysis. The number of samples for each panel was 4.

Similar articles

Cited by

References

    1. Joos B, et al. HIV rebounds from latently infected cells, rather than from continuing low-level replication. Proc Natl Acad Sci USA. 2008;105(43):16725–16730. doi: 10.1073/pnas.0804192105. - DOI - PMC - PubMed
    1. Kearney MF, et al. Origin of rebound plasma HIV includes cells with identical proviruses that are transcriptionally active before stopping of antiretroviral therapy. J Virol. 2016;90(3):1369–1376. doi: 10.1128/JVI.02139-15. - DOI - PMC - PubMed
    1. Kearney MF, et al. Lack of detectable HIV-1 molecular evolution during suppressive antiretroviral therapy. PLoS Pathog. 2014;10(3):e1004010. doi: 10.1371/journal.ppat.1004010. - DOI - PMC - PubMed
    1. Rosenbloom DIS, Hill AL, Laskey SB, Siliciano RF. Re-evaluating evolution in the HIV reservoir. Nature. 2017;551(7681):E6–E9. doi: 10.1038/nature24634. - DOI - PMC - PubMed
    1. Kearney MF, et al. Ongoing HIV replication during ART reconsidered. Open Forum Infect Dis. 2017;4(3):ofx173. - PMC - PubMed

Publication types

MeSH terms