. 2019 Jul 30;129(10):4506-4522.
doi: 10.1172/JCI128503.

Crystal deposition triggers tubule dilation that accelerates cystogenesis in polycystic kidney disease

Affiliations

Crystal deposition triggers tubule dilation that accelerates cystogenesis in polycystic kidney disease

Jacob A Torres et al. J Clin Invest. .

Abstract

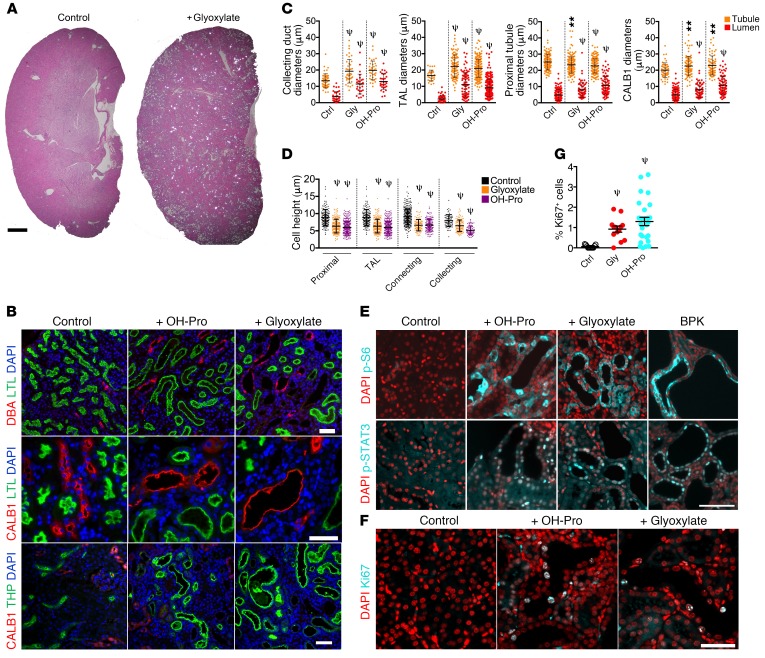
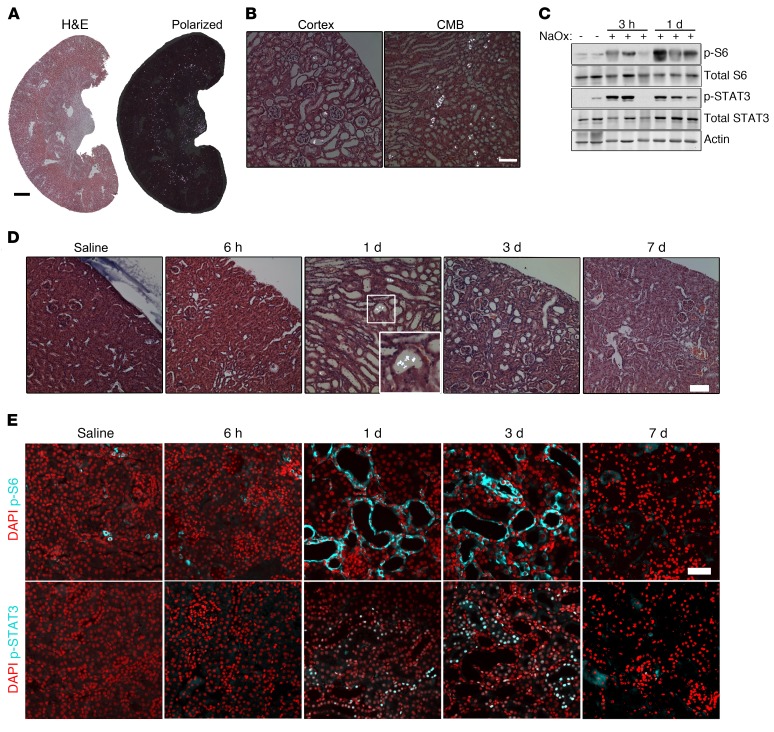
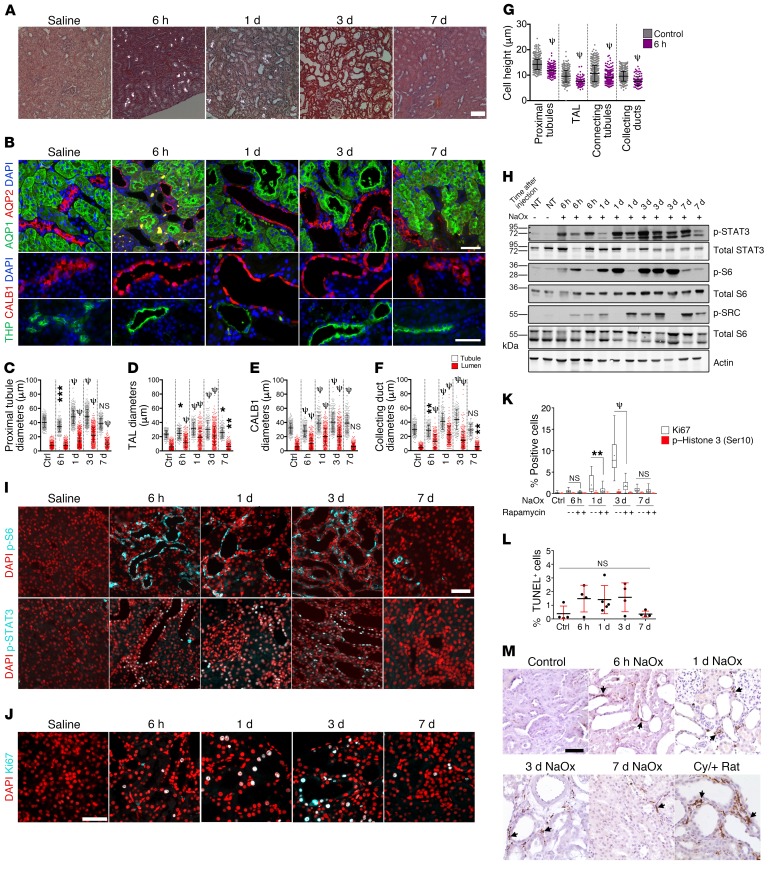
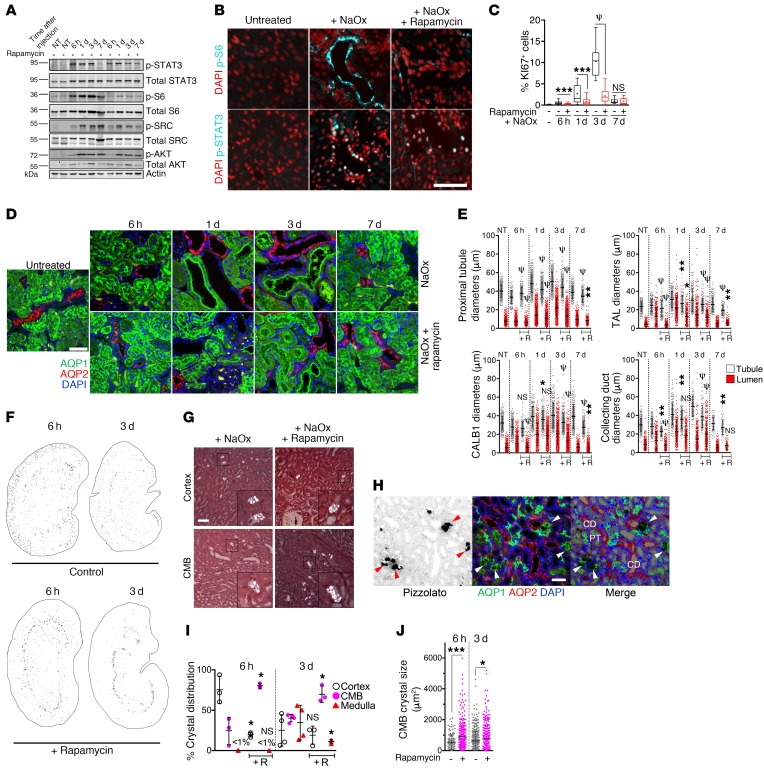
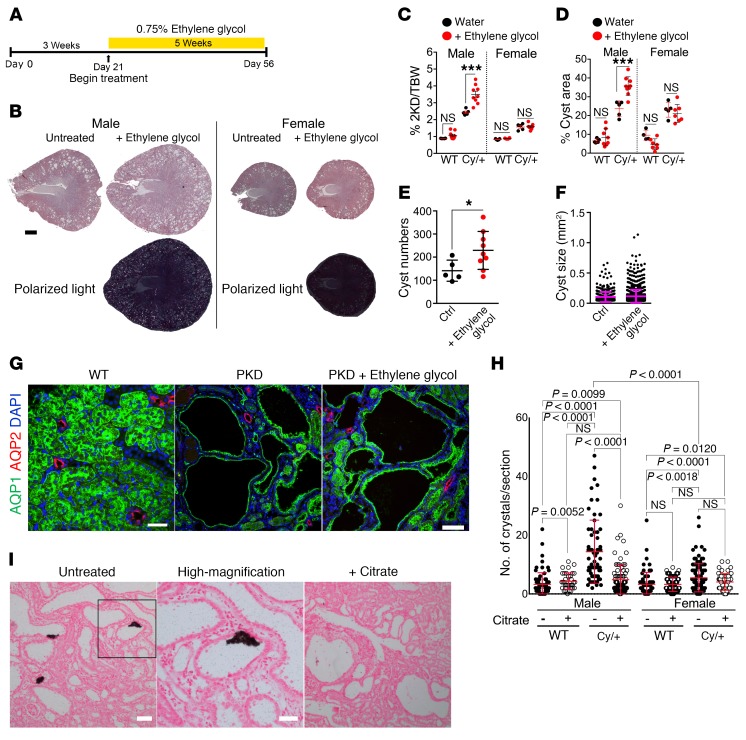
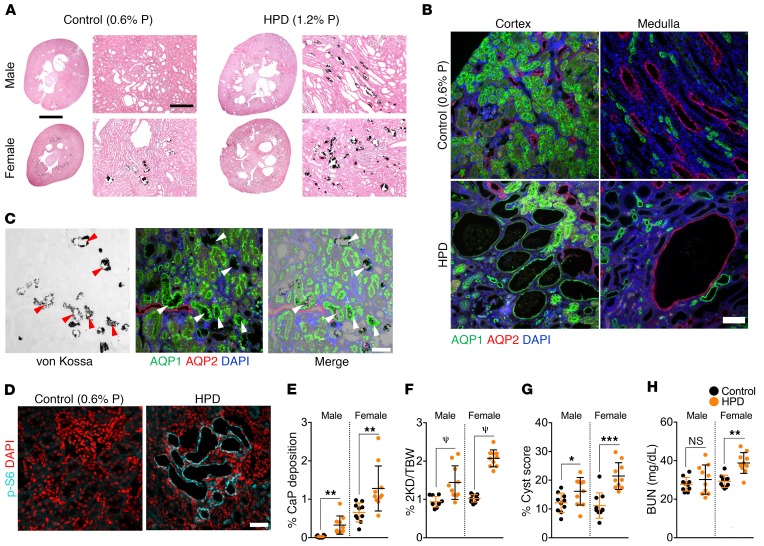
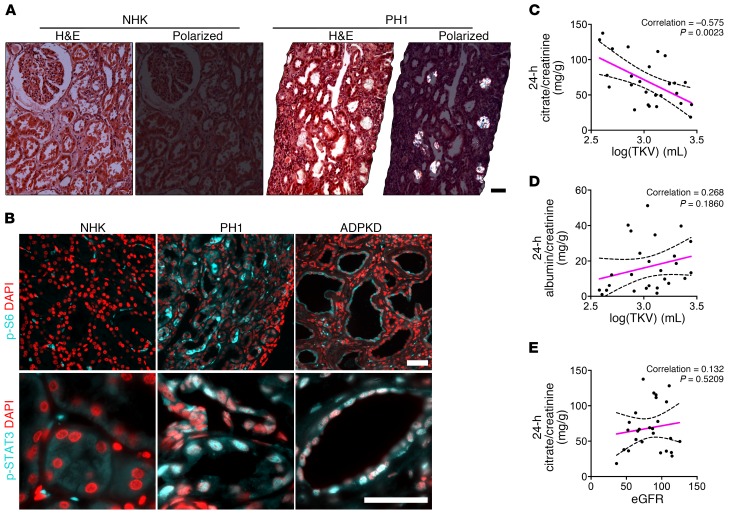
The rate of disease progression in autosomal-dominant (AD) polycystic kidney disease (PKD) exhibits high intra-familial variability suggesting that environmental factors may play a role. We hypothesized that a prevalent form of renal insult may accelerate cystic progression and investigated tubular crystal deposition. We report that calcium oxalate (CaOx) crystal deposition led to rapid tubule dilation, activation of PKD-associated signaling pathways, and hypertrophy in tubule segments along the affected nephrons. Blocking mTOR signaling blunted this response and inhibited efficient excretion of lodged crystals. This mechanism of "flushing out" crystals by purposefully dilating renal tubules has not previously been recognized. Challenging PKD rat models with CaOx crystal deposition, or inducing calcium phosphate deposition by increasing dietary phosphorous intake, led to increased cystogenesis and disease progression. In a cohort of ADPKD patients, lower levels of urinary excretion of citrate, an endogenous inhibitor of calcium crystal formation, correlated with increased disease severity. These results suggest that PKD progression may be accelerated by commonly occurring renal crystal deposition which could be therapeutically controlled by relatively simple measures.

Keywords: Fibrosis; Genetic diseases; Nephrology.


Conflict of interest statement

Conflict of interest: JT and TW are listed inventors on a provisional patent application (62818538) by the University of California Santa Barbara (UCSB) related to discoveries reported in this paper. TW is an inventor on a patent application (15/326296) by UCSB. BC reports consulting fees from Otsuka Pharmaceuticals. MM reports grants and consulting fees from Otsuka Pharmaceuticals, Sanofi, and Chinook Therapeutics. BH is a consultant for Oxthera AB, Alexion Pharmaceuticals, Dicerna Pharmaceuticals, Alnylam Pharmaceuticals, and Allena Pharmaceuticals. RH is on the Advisory Board of Chinook Therapeutics and is an inventor on 2 pending patents (15/545818 and 62/849564) filed by Wake Forest University and UAB. VET reports grant funding from Otsuka Pharmaceuticals, Palladio Biosciences, Sanofi Genzyme, Acceleron Pharma Inc., Regulus Therapeutics, and Blueprint Medicines.

Figures

Figure 1
Figure 1. Chronic CaOx crystal deposition leads to tubule dilation and activation of PKD-associated signaling pathways.
(A) H&E-stained sections of kidneys from glyoxylate-treated NPT2a–/– mice imaged by polarizing light microscopy. CaOx crystals appear as bright spots. Scale bar = 1 mm. (B) Kidney sections from NPT2a–/– mice treated with glyoxylate or hydroxyproline were stained with LTL, DBA, CALB1, and THP. (C) Quantification of tubule and lumen diameters from animals in B. (D) Quantification of cell heights from animals in B. TAL, thick ascending limb of Henle. (E) Immunofluorescence microscopy to detect mTOR activity: p-S6 (Ser235/236) and p-STAT3 (Tyr705). A BPK mouse was used as a positive control. (F) Immunostaining for the cell-cycle marker Ki67. (G) Quantification of Ki67+ cells as a percentage of the total number of DAPI-stained nuclei per field analyzed. Control n = 3, n = 3 for glyoxylate, and n = 2 for hydroxyproline. **P < 0.01 and ψP < 0.0001, by Mann-Whitney U test. Error bars represent the SD. Scale bars: 50 μm. Ctrl, control; Gly, glyoxylate; OH-Pro, hydroxyproline.
Figure 2
Figure 2. Acute CaOx crystal deposition leads to rapid tubule dilation and activation of PKD-associated signaling pathways in WT C57/BL6 mice.
(A) H&E-stained kidney sections 1 day after administration of 0.7 mg/kg NaOx, visualized by normal and polarized light microscopy. Scale bar: 1 mm. (B) High-magnification images from A, using polarized light. Scale bar: 100 μm. (C) Immunoblot of total kidney lysates for p-S6 (Ser235/236), p-STAT3 (Tyr705), and total proteins 3 hours (n = 4) and 1 day (n = 9) after 0.7 mg/kg NaOx treatment. Immunoblots are representative of 2 experiments. (D) Polarized light micrographs of kidney sections from mice treated with 0.3 mg/kg NaOX, 6 hours (n = 4), 1 day (n = 12), 3 days (n = 8), and 7 days (n = 13) after treatment. Scale bar: 100 μm. Original magnification, ×2 (inset). (E) Immunofluorescence staining of p-S6 (Ser235/236) and p-STAT3 (Tyr705) in mice treated with 0.3 mg/kg NaOx. Images of animals treated with 0.3 mg/kg NaOx are representative of 5 experiments. Scale bar: 50 μm.
Figure 3
Figure 3. Acute CaOx crystal deposition leads to rapid tubule dilation, activation of PKD-associated signaling pathways, and hypertrophy in WT rats.
(A) Polarized microscopic images of H&E-stained renal sections from rats treated with 0.7 mg/kg NaOx, 6 hours (n = 5), 24 hours (n = 5), 3 days (n = 5), and 7 days (n = 3) after treatment. (B) Segment-specific immunostaining of collecting ducts (AQP2), proximal tubules (AQP1), connecting tubules (CALB1), and the TAL of Henle (THP) from the treated rats. Bottom panels show separate images in the same panel as necessary. Scale bars: 50 μm. (CF) Lumen and tubule diameters of the indicated tubule segments. (G) Cell heights in the indicated tubule segments 6 hours after NaOx challenge. (H) Immunoblot of PKD-associated signaling pathways in kidney lysates. NT, no treatment. (I) Immunofluorescence microscopic images showing p-S6 (Ser235/236) and p-STAT3 (Tyr705) at the indicated time points after NaOx challenge. Scale bar: 50 μm. (J) Ki67 immunostaining. Scale bar: 50 μm. (K) Kidney sections costained with Ki67 and p–histone H3 (Ser10) and quantification of positive cells as a percentage of total cells. (L) Quantification of TUNEL+ cells as a percentage of total cells. (M) IHC for the macrophage marker CD68 in untreated WT rats (Control) and WT rats treated with NaOx at the indicated time points after NaOx administration. Cy/+ rat kidney was stained for comparison. Arrows point to CD68+ macrophages. Scale bar: 50 μm. Box-and-whisker plots represent 90% of the values, with the median displayed as a line in between the second and third quartiles and the mean shown with intersecting bars. All panels are representative of 3 experiments. Error bars represent the SD. *P < 0.05, **P < 0.01, ***P < 0.001, and ψP < 0.0001, by Mann-Whitney U test .
Figure 4
Figure 4. mTOR inhibition blunts tubule dilation and hypertrophy after NaOx challenge and disrupts efficient CaOx crystal excretion.
(A) Immunoblots of kidney lysates. (B) Immunostaining 6 hours after treatment with NaOx, with or without rapamycin pretreatment. (C) Quantification of Ki67+ cells as a percentage of total cells. (D) Images showing immunostaining for the segment-specific markers AQP1 and AQP2. (E) Quantification of tubular and lumen diameters with rapamycin (+R). (F) Inverted polarized light micrographs of whole kidneys 6 hours or 3 days after NaOx treatment. (G) High-magnification polarized light micrographs showing oxalate crystals in renal cortex and the CMB 6 hours following NaOx treatment, with or without rapamycin pretreatment. (H) Pizzolato staining together with segment-specific markers in rapamycin-treated rats. Arrowheads point to crystals. CD, collecting duct; PT, proximal tubule. (I) Quantification of intrarenal location of deposited CaOx crystals 6 hours and 3 days after NaOx treatment, with and without rapamycin. (J) Quantification of the size distribution of CaOx crystals and aggregates in rats treated with NaOx, with or without rapamycin. NaOx-treated animals after 6 hours (n = 5), 1 day (n = 5), 3 days (n = 5), and 7 days (n = 3). NaOx- plus rapamycin-treated animals after 6 hours (n = 5), 1 day (n = 5), 3 days (n = 5), and 7 days (n = 2). Scale bars: 50 μm. Original magnification, ×3 (insets in G). Error bars represent the SD. All data are representative of 3 experiments for NaOx-treated animals. Box-and-whisker plots represent 90% of the values, with the median displayed as a line in between the second and third quartiles and the mean with intersecting bars. *P < 0.05, **P < 0.01, ***P < 0.001, and ψP < 0.0001, by Mann-Whitney U test.
Figure 5
Figure 5. Chronic CaOx crystal deposition leads to increased cystogenesis and disease progression in the Han:SPRD rat model.
(A) Timeline of treatment. Han:SPRD rats were given 0.75% ethylene glycol in their drinking water from 3 weeks of age until 8 weeks of age. (B) Bright-field and polarized light microscopic images of H&E-stained kidney sections. Scale bar: 2 mm. (C) Two-kidney/BW (2KD/BW) ratios. (D) Renal cystic index. (E) Cyst numbers in kidney sections per animal. (F) Cyst sizes measured by surface area in H&E-stained sections. (G) Immunostaining for the segment-specific markers AQP1 and AQP2. Scale bars: 50 μm and 100 μm. (H) Quantification of Pizzolato-stained tissue in I of WT and Han:SPRD rats treated with or without citrate. P values in H were determined by Mann-Whitney U test. (I) Pizzolato stained sections from untreated and citrate-treated male, Cy/+ Han:SPRD rats. Animals treated for this experiment: n = 9 WT and n = 9 Cy/+ male rats, 6 WT females, n = 7 Cy/+ females. Untreated animals: n = 4 WT male rats, n = 5 Cy/+ rats, n = 5 WT females, and n = 5 Cy/+ females. Scale bars: 100 μm and 50 μm. Images of ethylene glycol–treated rats are representative of 4 experiments and 3 experiments for the citrate-treated rats. Error bars represent the SD. *P < 0.05 and ***P < 0.001, by Mann-Whitney U test.
Figure 6
Figure 6. HPD induces renal tubular CaP deposition and accelerates disease progression in the PCK rat model.
Male and female PCK rats were given a control diet containing 0.6% P or a HPD containing 1.2% P between 3 and 10 weeks of age. (A) Von Kossa staining showing CaP deposition (black). Scale bars: 45 mm and 400 μm. (B) Immunofluorescence microscopic images for detection of AQP1 and AQP2. Controls were cystic rats treated with 0.6% P. (C) Overlay of von Kossa stain (black) with AQP1 and AQP2 immunostaining of CaP deposits, which are seen primarily near the transition between proximal tubules and the descending limb of Henle (arrowheads). Images are from HPD-treated cystic rats. (D) Immunofluorescence staining for p-S6 (Ser235/236) in tissue from PCK rats on a HPD. (E) Quantification of CaP deposition. (F) Two-kidney/BW ratios. (G) Kidney cyst scores. (H) BUN levels for PCK rats on a HPD. n = 10 each male and female WT and cystic rats. Error bars represent the SD. Data for EH are from Supplemental Table 1. Scale bars: 100 μm (B) and 50 μm (C and D). *P < 0.05, **P < 0.01, ***P < 0.001, and ψP < 0.0001, by unpaired, 2-tailed t test.
Figure 7
Figure 7. mTOR and STAT3 activation in kidneys from patients with PH1 and citrate excretion are inversely correlated with total kidney volume in patients with ADPKD.
(A) H&E-stained renal sections from a normal human kidney (NHK) and from a patient with PH1, visualized by bright-field and polarized light microscopy (n = 3). Scale bar: 50 μm. (B) Immunostaining for p-S6 (Ser235/236)and p-STAT3 (Tyr705) in PH1 kidneys versus NHK. Human ADPKD kidney tissue was stained side-by-side for comparison. Scale bars: 50 μm. (C) Urinary citrate excretion (24-hour) normalized to creatinine excretion correlated inversely with the log-transformed total renal volumes for ADPKD patients. (D) The correlation between 24-hour urine albumin excretion normalized to creatinine excretion and the log-transformed total renal volumes of ADPKD patients did not reach statistical significance. (E) Urinary citrate excretion (24-hour) normalized to creatinine and plotted against eGFR. The sample Pearson’s correlation coefficients are displayed for each graph. P values for CE were determined using linear regression analysis. Hashed lines represent 95% CIs.

Comment in

Similar articles

Cited by

References

    1. Knight T, Schaefer C, Krasa H, Oberdhan D, Chapman A, Perrone RD. Medical resource utilization and costs associated with autosomal dominant polycystic kidney disease in the USA: a retrospective matched cohort analysis of private insurer data. Clinicoecon Outcomes Res. 2015;7:123–132. - PMC - PubMed
    1. Ong AC, Devuyst O, Knebelmann B, Walz G, ERA-EDTA Working Group for Inherited Kidney Diseases Autosomal dominant polycystic kidney disease: the changing face of clinical management. Lancet. 2015;385(9981):1993–2002. doi: 10.1016/S0140-6736(15)60907-2. - DOI - PubMed
    1. Erickson KF, Chertow GM, Goldhaber-Fiebert JD. Cost-effectiveness of tolvaptan in autosomal dominant polycystic kidney disease. Ann Intern Med. 2013;159(6):382–389. doi: 10.7326/0003-4819-159-6-201309170-00004. - DOI - PMC - PubMed
    1. Antignac C, et al. The future of polycystic kidney disease research--As seen by the 12 Kaplan Awardees. J Am Soc Nephrol. 2015;26(9):2081–2095. doi: 10.1681/ASN.2014121192. - DOI - PMC - PubMed
    1. Lanktree MB, et al. Intrafamilial Variability of ADPKD. Kidney Int Rep. 2019;4(7):995–1003. doi: 10.1016/j.ekir.2019.04.018. - DOI - PMC - PubMed

Publication types