

Polymorphic G:G mismatches act as hotspots for inducing right-handed Z DNA by DNA intercalation
- PMID: 31361900
- PMCID: PMC6895262
- DOI: 10.1093/nar/gkz653
Polymorphic G:G mismatches act as hotspots for inducing right-handed Z DNA by DNA intercalation
Abstract
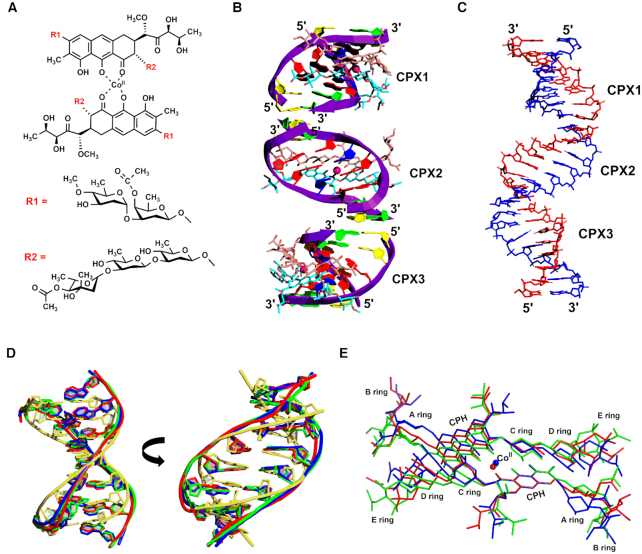
DNA mismatches are highly polymorphic and dynamic in nature, albeit poorly characterized structurally. We utilized the antitumour antibiotic CoII(Chro)2 (Chro = chromomycin A3) to stabilize the palindromic duplex d(TTGGCGAA) DNA with two G:G mismatches, allowing X-ray crystallography-based monitoring of mismatch polymorphism. For the first time, the unusual geometry of several G:G mismatches including syn-syn, water mediated anti-syn and syn-syn-like conformations can be simultaneously observed in the crystal structure. The G:G mismatch sites of the d(TTGGCGAA) duplex can also act as a hotspot for the formation of alternative DNA structures with a GC/GA-5' intercalation site for binding by the GC-selective intercalator actinomycin D (ActiD). Direct intercalation of two ActiD molecules to G:G mismatch sites causes DNA rearrangements, resulting in backbone distortion to form right-handed Z-DNA structures with a single-step sharp kink. Our study provides insights on intercalators-mismatch DNA interactions and a rationale for mismatch interrogation and detection via DNA intercalation.
© The Author(s) 2019. Published by Oxford University Press on behalf of Nucleic Acids Research.
Figures


Similar articles
-
Crystal structure of the [Mg2+-(chromomycin A3)2]-d(TTGGCCAA)2 complex reveals GGCC binding specificity of the drug dimer chelated by a metal ion.Nucleic Acids Res. 2004 Apr 23;32(7):2214-22. doi: 10.1093/nar/gkh549. Print 2004. Nucleic Acids Res. 2004. PMID: 15107489 Free PMC article.
-
The binding of the Co(II) complex of dimeric chromomycin A3 to GC sites with flanking G:G mismatches.J Inorg Biochem. 2013 Apr;121:28-36. doi: 10.1016/j.jinorgbio.2012.12.007. Epub 2012 Dec 21. J Inorg Biochem. 2013. PMID: 23333714
-
Crystal and solution structures of 7-amino-actinomycin D complexes with d(TTAGBrUT), d(TTAGTT) and d(TTTAGTTT).Acta Crystallogr D Biol Crystallogr. 2005 Apr;61(Pt 4):407-15. doi: 10.1107/S090744490500082X. Epub 2005 Mar 24. Acta Crystallogr D Biol Crystallogr. 2005. PMID: 15805595
-
Solution structure of the esperamicin A1-DNA complex.J Mol Biol. 1997 Jan 17;265(2):173-86. doi: 10.1006/jmbi.1996.0719. J Mol Biol. 1997. PMID: 9020981
-
Solution structure of actinomycin-DNA complexes: drug intercalation at isolated G-C sites.J Biomol NMR. 1991 Nov;1(4):323-47. doi: 10.1007/BF02192858. J Biomol NMR. 1991. PMID: 1841703
Cited by
-
The role of water in mediating DNA structures with epigenetic modifications, higher-order conformations and drug-DNA interactions.RSC Chem Biol. 2025 Mar 14;6(5):699-720. doi: 10.1039/d4cb00308j. eCollection 2025 May 8. RSC Chem Biol. 2025. PMID: 40171245 Free PMC article. Review.
-
Structural characterization of dicyanopyridine containing DNMT1-selective, non-nucleoside inhibitors.Structure. 2022 Jun 2;30(6):793-802.e5. doi: 10.1016/j.str.2022.03.009. Epub 2022 Apr 7. Structure. 2022. PMID: 35395178 Free PMC article.
-
Structural basis of water-mediated cis Watson-Crick/Hoogsteen base-pair formation in non-CpG methylation.Nucleic Acids Res. 2024 Aug 12;52(14):8566-8579. doi: 10.1093/nar/gkae594. Nucleic Acids Res. 2024. PMID: 38989613 Free PMC article.
-
Staggered intercalation of DNA duplexes with base-pair modulation by two distinct drug molecules induces asymmetric backbone twisting and structure polymorphism.Nucleic Acids Res. 2022 Aug 26;50(15):8867-8881. doi: 10.1093/nar/gkac629. Nucleic Acids Res. 2022. PMID: 35871296 Free PMC article.
-
Quinoline-based compounds can inhibit diverse enzymes that act on DNA.Cell Chem Biol. 2024 Dec 19;31(12):2112-2127.e6. doi: 10.1016/j.chembiol.2024.09.007. Epub 2024 Oct 21. Cell Chem Biol. 2024. PMID: 39437789
References
-
- Jeggo P.A., Pearl L.H., Carr A.M.. DNA repair, genome stability and cancer: a historical perspective. Nat. Rev. Cancer. 2015; 16:35–42. - PubMed
-
- Gaillard H., Garcia-Muse T., Aguilera A.. Replication stress and cancer. Nat. Rev. Cancer. 2015; 15:276–289. - PubMed
-
- Lord C.J., Ashworth A.. The DNA damage response and cancer therapy. Nature. 2012; 481:287–294. - PubMed
Publication types
MeSH terms
Substances
LinkOut - more resources
Full Text Sources
Miscellaneous
