. 2019 Jul 29;8(8):787.
doi: 10.3390/cells8080787.

An Omics Approach to Extracellular Vesicles from HIV-1 Infected Cells

Affiliations

An Omics Approach to Extracellular Vesicles from HIV-1 Infected Cells

Robert A Barclay et al. Cells. .

Abstract

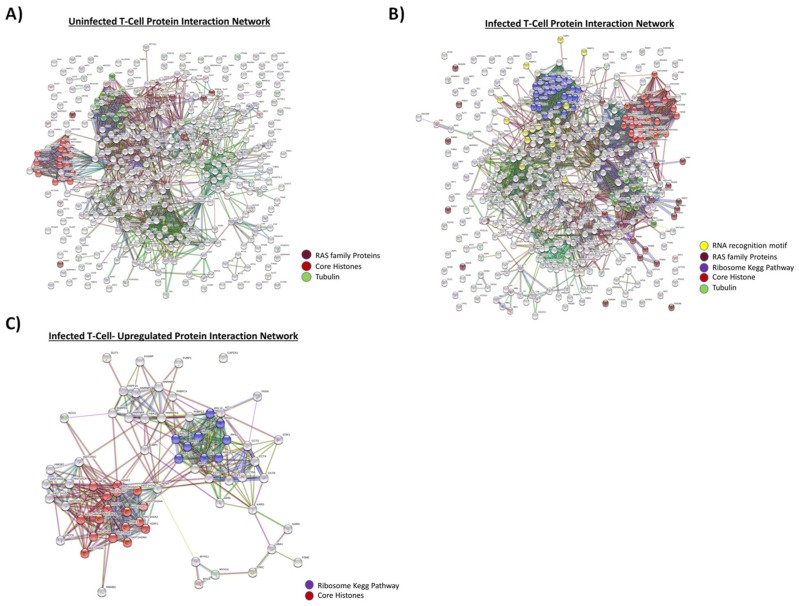
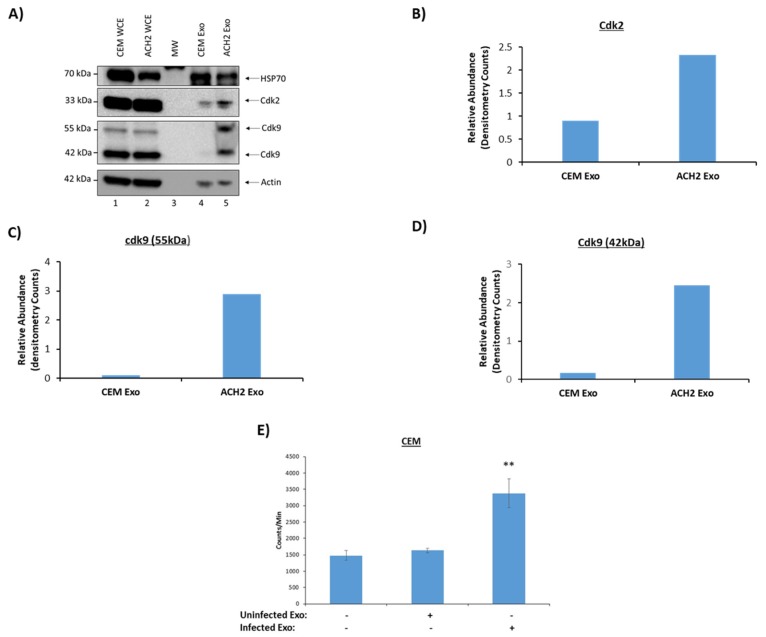
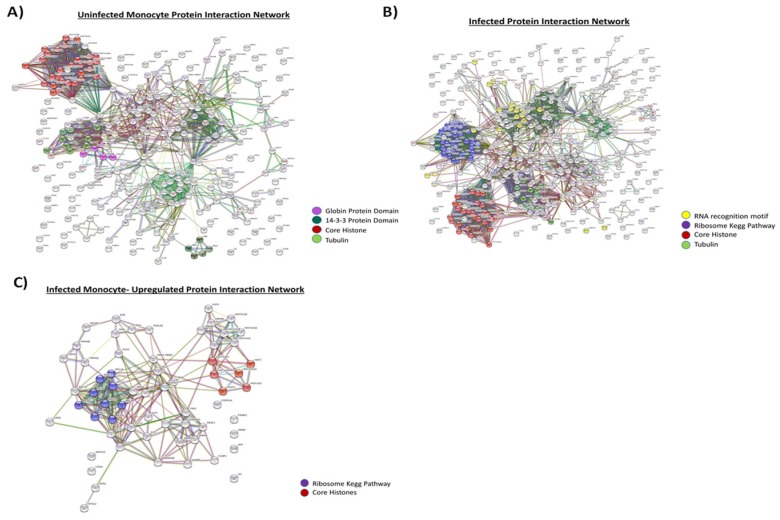
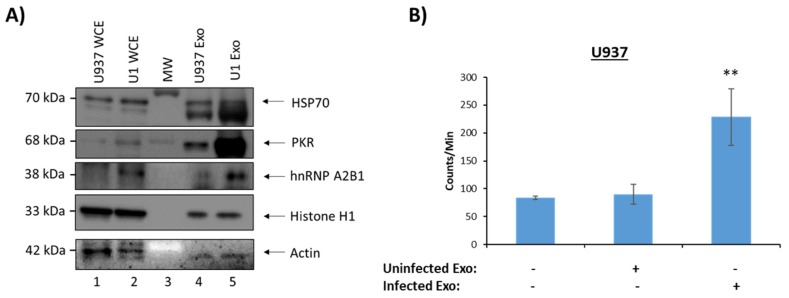
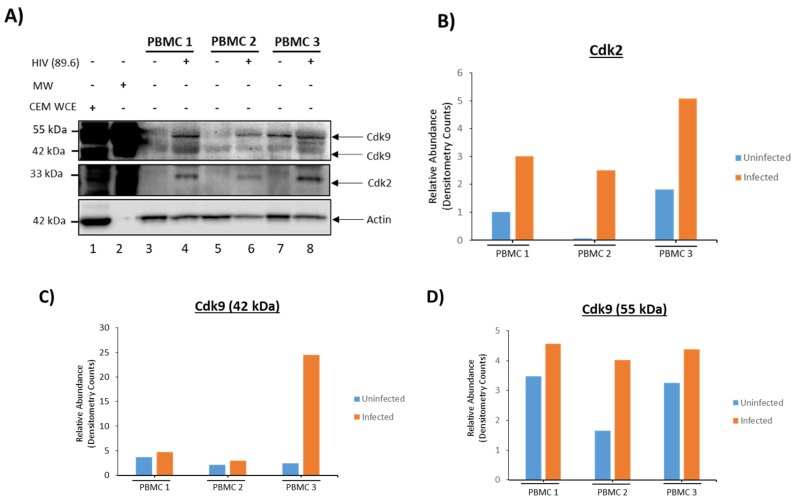
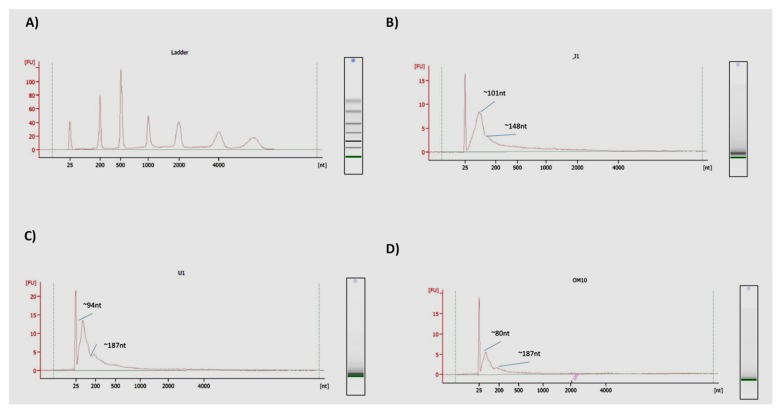
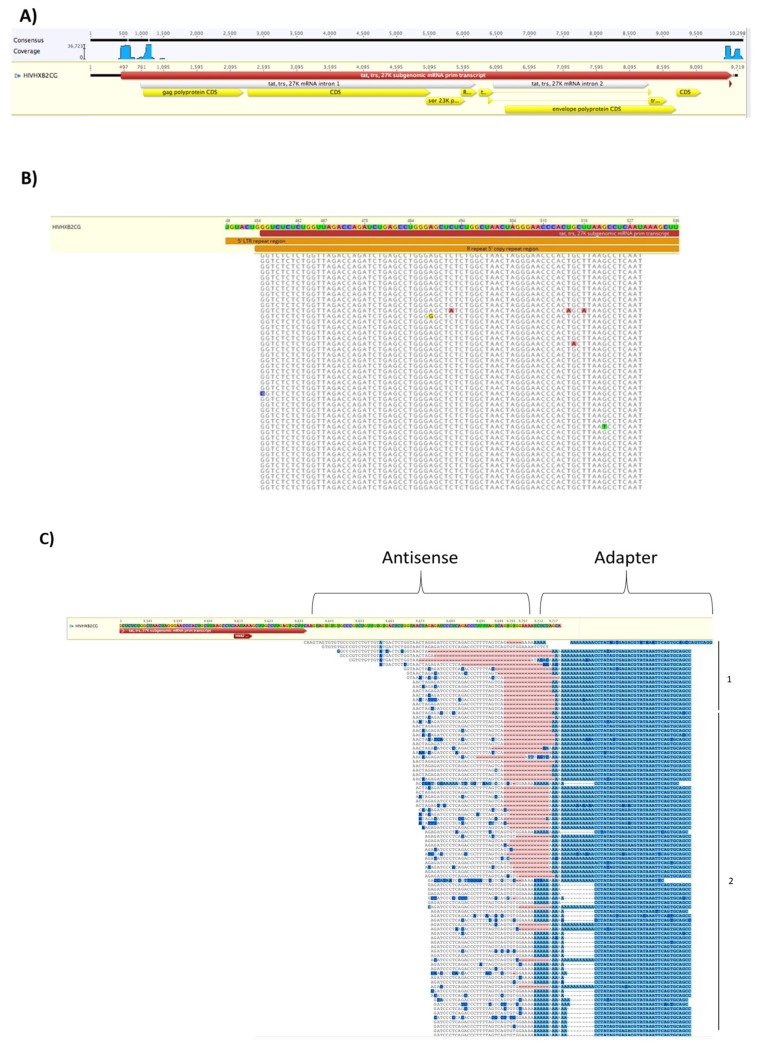
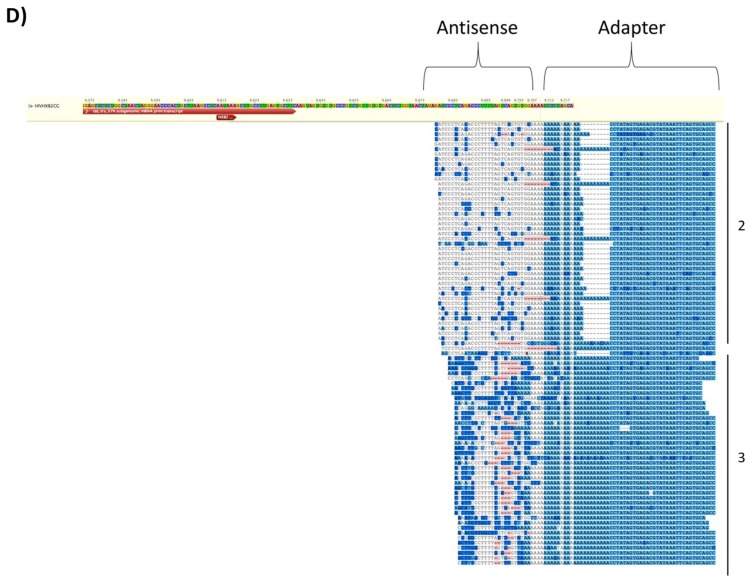
Human Immunodeficiency Virus-1 (HIV-1) is the causative agent of Acquired Immunodeficiency Syndrome (AIDS), infecting nearly 37 million people worldwide. Currently, there is no definitive cure, mainly due to HIV-1's ability to enact latency. Our previous work has shown that exosomes, a small extracellular vesicle, from uninfected cells can activate HIV-1 in latent cells, leading to increased mostly short and some long HIV-1 RNA transcripts. This is consistent with the notion that none of the FDA-approved antiretroviral drugs used today in the clinic are transcription inhibitors. Furthermore, these HIV-1 transcripts can be packaged into exosomes and released from the infected cell. Here, we examined the differences in protein and nucleic acid content between exosomes from uninfected and HIV-1-infected cells. We found increased cyclin-dependent kinases, among other kinases, in exosomes from infected T-cells while other kinases were present in exosomes from infected monocytes. Additionally, we found a series of short antisense HIV-1 RNA from the 3' LTR that appears heavily mutated in exosomes from HIV-1-infected cells along with the presence of cellular noncoding RNAs and cellular miRNAs. Both physical and functional validations were performed on some of the key findings. Collectively, our data indicate distinct differences in protein and RNA content between exosomes from uninfected and HIV-1-infected cells, which can lead to different functional outcomes in recipient cells.

Keywords: HIV-1; RNA sequencing; extracellular vesicle; proteomics.


Conflict of interest statement

None of the authors have conflicts of interest to disclose.

Figures

Figure 1
Figure 1
Protein comparison of uninfected and infected T-cell EVs. The 5-day old cell supernatants from CEM (uninfected) and ACH2 cells (HIV-1-infected) were harvested, treated with ExoMAX overnight, and centrifuged. The resulting pellet was run on an iodixanol density gradient, and the 10.8 fraction (exosome fraction) [41] was treated with NT80/82 overnight. The resulting pellet was treated was then prepared for mass spectrometry, and the resulting peptides were identified using Proteome Discoverer software. The predicted protein–protein interactions were then generated following multiple proteins input into the STRING database. A high confidence cutoff of ≥0.70–0.90 was implemented in this work. Network nodes represent proteins. Edges represent protein-protein associations and color shows association types. (A) Protein interaction network of proteins derived from uninfected T-cell exosomes (CEM). (B) Protein interaction network of proteins derived from infected T-cell exosomes (ACH2). (C) Protein interaction network of proteins which are upregulated in infected T-cell exosome.
Figure 2
Figure 2
Infected T-cell have functional effects on recipient cells. The 5-day old cell supernatants from CEM (uninfected) and ACH2 cells (HIV-1-infected) were harvested, treated with ExoMAX overnight, and centrifuged. The resulting pellet was run on an iodixanol density gradient, and the 10.8 fraction (exosome fraction) [36] was treated with NT80/82 overnight. (A) Samples were Western blotted for HSP70 (control), Cdk2, Cdk9 (two isoforms 42 kDa and 55 kDa), and actin (control). Densitometry counts normalized to actin across all samples are shown for Cdk2 (B), Cdk9 55 kDa isoform (C), and Cdk9 42 kDa isoform (D). (E) Isolated EVs were added to recipient uninfected CEM cells, which had been synced at G0 phase, at a ratio of 1 cell:500 EVs and incubated for 44 h. [3H] thymidine was incorporated into the cells during a 4 h incubation. Cells were then washed and counted in a beta-counter to determine DNA synthesis. Student’s t-test compared untreated cells with cells treated with exosomes. ** p < 0.01, Error bars, S.D.
Figure 3
Figure 3
Protein comparison of uninfected and infected monocyte EVs. 5-day old cell supernatants from U937 (uninfected) and U1 cells (HIV-1-infected) were harvested, treated with ExoMAX overnight, and centrifuged. The resulting pellet was run on an iodixanol density gradient, and the 10.8 fraction (exosome fraction) [36] was treated with NT80/82 overnight. The resulting pellet was treated was then prepared for mass spectrometry, and the resulting peptides were identified using Proteome Discoverer software. The predicted protein–protein interactions generated following multiple proteins input into the STRING database. A high confidence cutoff of ≥0.70–0.90 was implemented in this work. Network nodes represent proteins. Edges represent protein-protein associations and color shows association types. (A) Protein interaction network of proteins derived from uninfected monocyte exosomes (U937). (B) Protein interaction network of proteins derived from infected monocyte exosomes (U1). (C) Protein interaction network of proteins which are upregulated in infected monocyte exosome.
Figure 4
Figure 4
Infected monocyte EVs functional effects on recipient cells. 5-day old cell supernatants from U937 (uninfected) and U1 cells (HIV-1-infected) were harvested, treated with ExoMAX overnight, and centrifuged. The resulting pellet was run on an iodixanol density gradient, and the 10.8 fraction (exosome fraction) [36] was treated with NT80/82 overnight. (A) Samples were Western blotted for HSP70 (control), PKR, hnRNPA2/B1, histone H1, and actin (control). (B) Isolated EVs were added to recipient uninfected U937 cells, which had been synced at G0 phase, at a ratio of 1 cell:500 EVs and incubated for 44 h. [3H] thymidine was incorporated into the cells during a 4 h incubation. Cells were then washed and counted in a beta-counter to determine DNA synthesis. Student’s t-test compared untreated cells with cells treated with exosomes. ** p < 0.01, Error bars, S.D.
Figure 5
Figure 5
Infected PBMC EVs have increased levels of Cdk9. 6-day old cell supernatants from uninfected PBMCs was harvested and treated with ExoMAX overnight. PBMCs were then infected with HIV-1 89.6 (MOI 10) and placed under cART. 7-day old cell supernatants from the infected PBMCs were harvested and treated with ExoMAX overnight. Samples were spun down, re-suspended in PBS, and loaded on a gel. Western blot analysis for Cdk9 (two isoforms 42 kDa and 55 kDa) and actin (control) was performed on the PBMC EVs (A). Densitometry counts normalized to actin across all samples are shown for Cdk2 (B), Cdk9 42 kDa isoform (C) and 55 kDa isoform (D).
Figure 6
Figure 6
RNA Agilent Trace test shows RNAs of similar size in EVs. (A) RNA ladder was run as a control for an RNA Agilent Trace test. EVs from 5-day old J1.1 (infected T-cell) (B), U1 (infected monocyte) (C), and OM10.1 (infected myeloid) cells (D) were isolated by NT80/82 pulldown. Total RNA was isolated from the EVs and RNA Agilent Trace was performed to determine the peak size of RNA within the EVs.
Figure 7
Figure 7
RNAseq bioinformatics analysis of EV-associated RNA. EVs from 5-day old J1.1 (infected T-cell) were isolated by NT80/82 pulldown and subjected to RNA sequencing. Bioinformatics analysis was performed using Geneius R11. Highlighted nucleotides represent deviations from the reference genome. (A) Bioinformatics analysis shows high amounts of HIV-1 RNAs at the 5′ of the HIV-1 genome and at the 3′ end of the HIV-1 genome. (B) Read-throughs of the 5′ end of the HIV-1 genome show sense RNAs that are very similar to the reference genome. (C) Read-throughs of the 3′ end of the HIV-1 genome show antisense RNAs that have some deviations from the reference genome. These RNAs fall into two possible groups. Longer RNAs (1) may be associated with wild-type AST RNA [63] while the shorter RNAs may be associated with a separate set of noncoding RNAs (2). (D) Read-throughs of the 3′ end of the HIV-1 genome show antisense RNAs that have many deviations from the reference genome. RNAs with less deviations may be associated with Transcript 2 while RNAs with more deviations may be associated with a different type of transcript altogether (3).
Figure 7
Figure 7
RNAseq bioinformatics analysis of EV-associated RNA. EVs from 5-day old J1.1 (infected T-cell) were isolated by NT80/82 pulldown and subjected to RNA sequencing. Bioinformatics analysis was performed using Geneius R11. Highlighted nucleotides represent deviations from the reference genome. (A) Bioinformatics analysis shows high amounts of HIV-1 RNAs at the 5′ of the HIV-1 genome and at the 3′ end of the HIV-1 genome. (B) Read-throughs of the 5′ end of the HIV-1 genome show sense RNAs that are very similar to the reference genome. (C) Read-throughs of the 3′ end of the HIV-1 genome show antisense RNAs that have some deviations from the reference genome. These RNAs fall into two possible groups. Longer RNAs (1) may be associated with wild-type AST RNA [63] while the shorter RNAs may be associated with a separate set of noncoding RNAs (2). (D) Read-throughs of the 3′ end of the HIV-1 genome show antisense RNAs that have many deviations from the reference genome. RNAs with less deviations may be associated with Transcript 2 while RNAs with more deviations may be associated with a different type of transcript altogether (3).

Similar articles

Cited by

References

    1. WHO|World Health Organization. [(accessed on 26 April 2017)]; Available online: http://www.who.int/hiv/en/
    1. HIV in the United States|Statistics Overview|Statistics Center|HIV/AIDS|CDC. [(accessed on 26 April 2017)]; Available online: https://www.cdc.gov/hiv/statistics/overview/ataglance.html.
    1. U.S. Statistics|HIV.gov. [(accessed on 4 January 2019)]; Available online: https://www.hiv.gov/hiv-basics/overview/data-and-trends/statistics.
    1. Arts E.J., Hazuda D.J. HIV-1 antiretroviral drug therapy. Cold Spring Harb. Perspect. Med. 2012;2:a007161. doi: 10.1101/cshperspect.a007161. - DOI - PMC - PubMed
    1. Kumar A., Abbas W., Herbein G. HIV-1 Latency in Monocytes/Macrophages. Viruses. 2014;6:1837–1860. doi: 10.3390/v6041837. - DOI - PMC - PubMed

Publication types

MeSH terms