. 2019 Jul 29;9(8):1089.
doi: 10.3390/nano9081089.

Tangeretin-Assisted Platinum Nanoparticles Enhance the Apoptotic Properties of Doxorubicin: Combination Therapy for Osteosarcoma Treatment

Affiliations

Tangeretin-Assisted Platinum Nanoparticles Enhance the Apoptotic Properties of Doxorubicin: Combination Therapy for Osteosarcoma Treatment

Sangiliyandi Gurunathan et al. Nanomaterials (Basel). .

Abstract

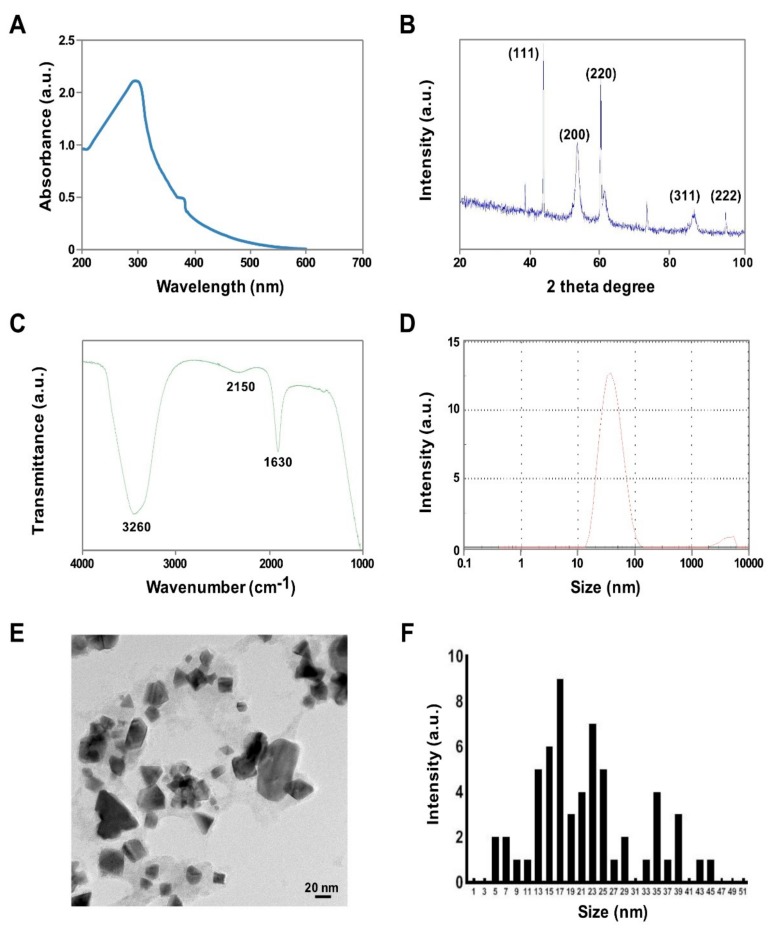
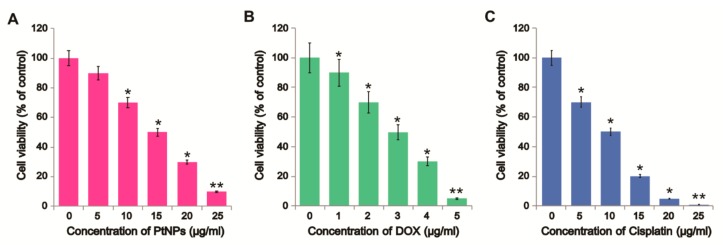
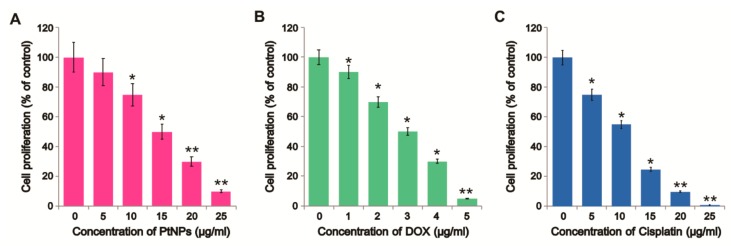
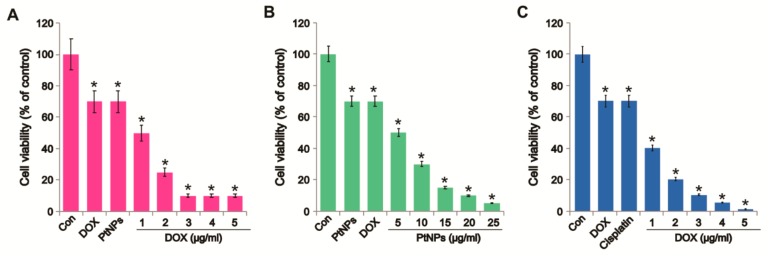
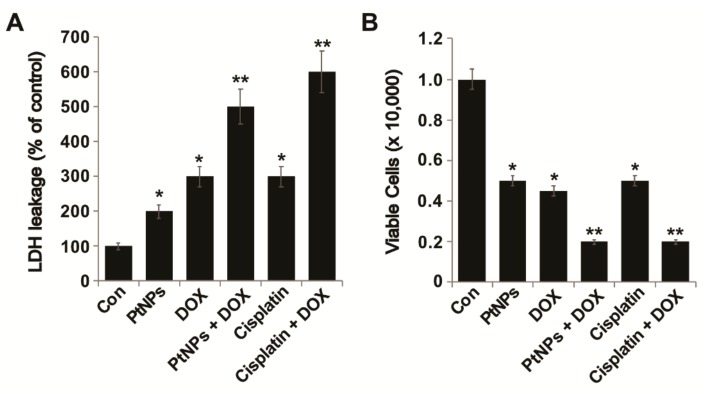
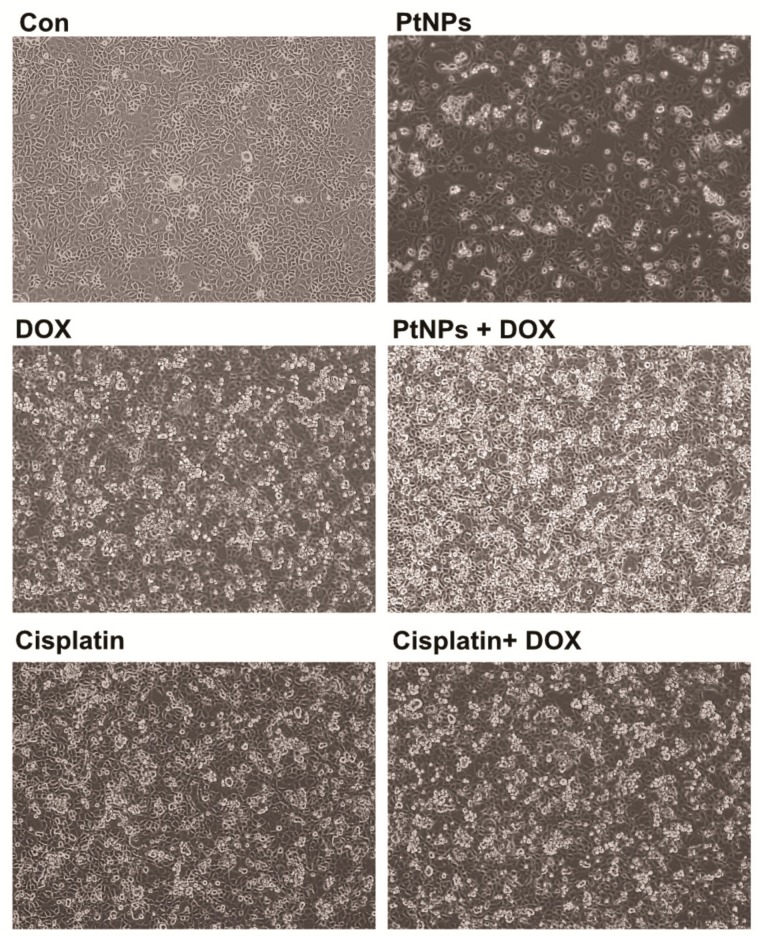
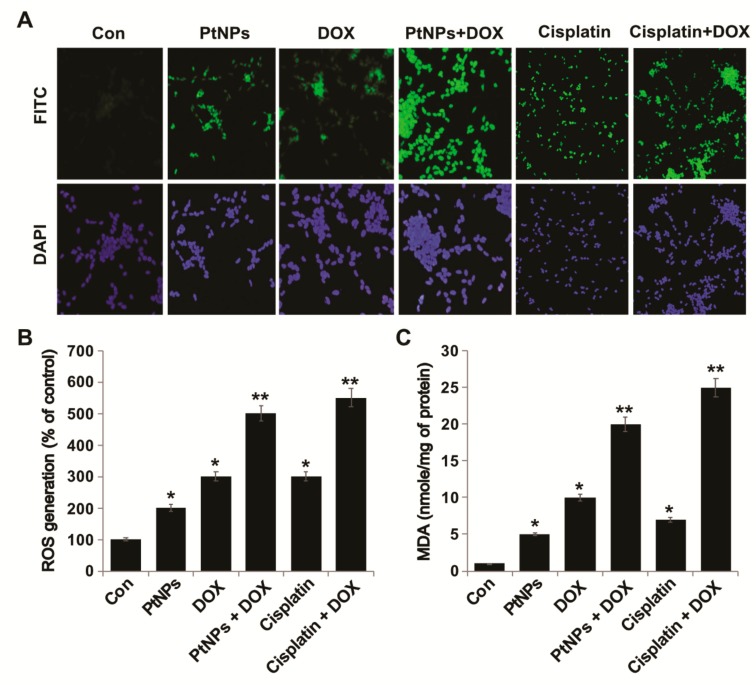
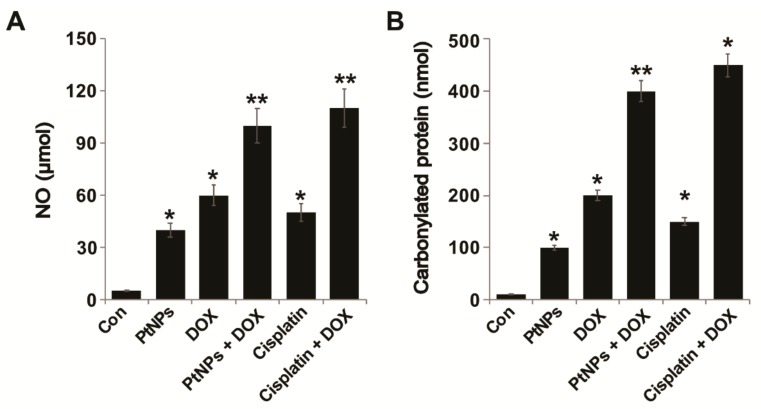
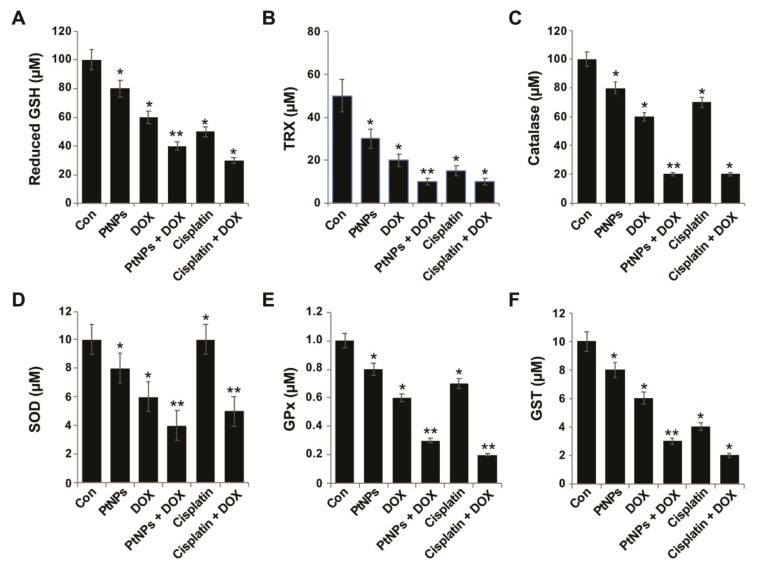
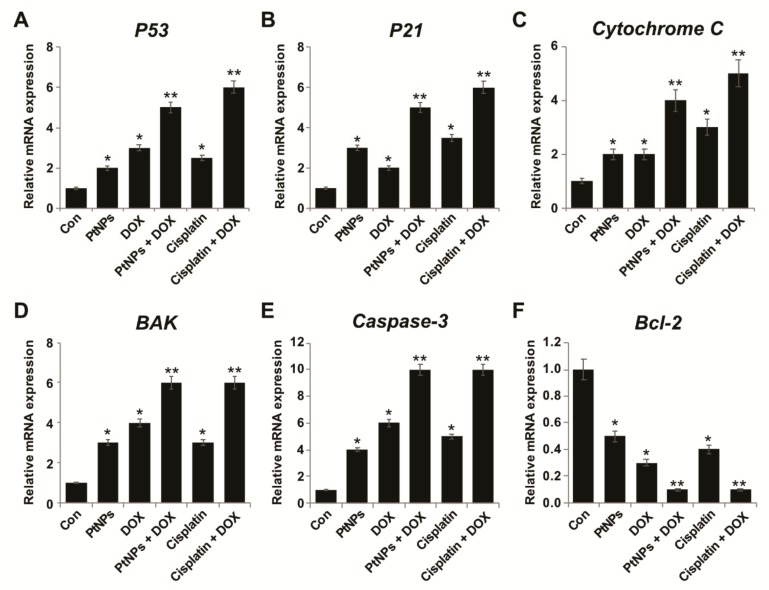
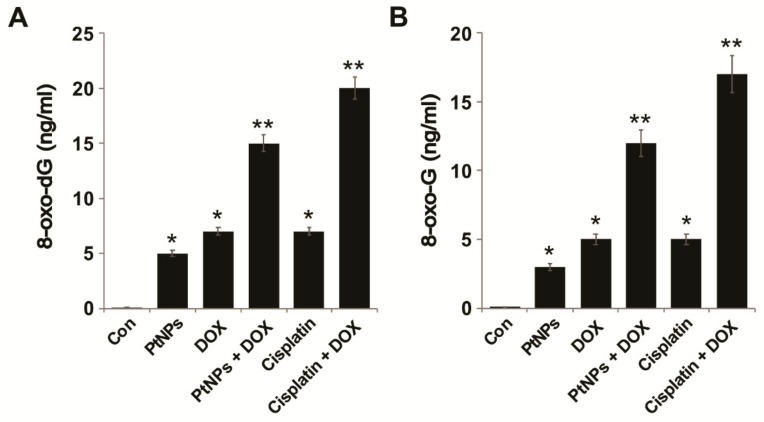
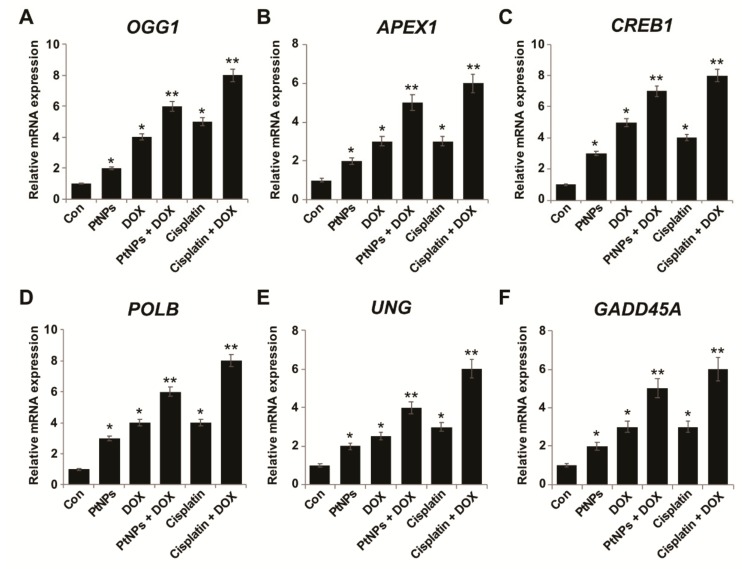
Osteosarcoma (OS) is the most common type of cancer and the most frequent malignant bone tumor in childhood and adolescence. Nanomedicine has become an indispensable field in biomedical and clinical research, with nanoparticles (NPs) promising to increase the therapeutic efficacy of anticancer drugs. Doxorubicin (DOX) is a commonly used chemotherapeutic drug against OS; however, it causes severe side effects that restrict its clinical applications. Here, we investigated whether combining platinum NPs (PtNPs) and DOX could increase their anticancer activity in human bone OS epithelial cells (U2OS). PtNPs with nontoxic, effective, thermally stable, and thermoplasmonic properties were synthesized and characterized using tangeretin. We examined the combined effects of PtNPs and DOX on cell viability, proliferation, and morphology, reactive oxygen species (ROS) generation, lipid peroxidation, nitric oxide, protein carbonyl content, antioxidants, mitochondrial membrane potential (MMP), adenosine tri phosphate (ATP) level, apoptotic and antiapoptotic gene expression, oxidative stress-induced DNA damage, and DNA repair genes. PtNPs and DOX significantly inhibited U2OS viability and proliferation in a dose-dependent manner, increasing lactate dehydrogenase leakage, ROS generation, and malondialdehyde, nitric oxide, and carbonylated protein levels. Mitochondrial dysfunction was confirmed by reduced MMP, decreased ATP levels, and upregulated apoptotic/downregulated antiapoptotic gene expression. Oxidative stress was a major cause of cytotoxicity and genotoxicity, confirmed by decreased levels of various antioxidants. Furthermore, PtNPs and DOX increased 8-oxo-dG and 8-oxo-G levels and induced DNA damage and repair gene expression. Combination of cisplatin and DOX potentially induce apoptosis comparable to PtNPs and DOX. To the best of our knowledge, this is the first report to describe the combined effects of PtNPs and DOX in OS.

Keywords: DNA damage; apoptosis; cytotoxicity; doxorubicin; genotoxicity; oxidative stress; platinum nanoparticles.


Conflict of interest statement

The authors declare no conflict of interest.

Figures

Figure 1
Figure 1
Synthesis and characterization of PtNPs using tangeretin. (A) Absorption spectra of tangeretin-mediated PtNP synthesis; the absorption spectra of PtNPs exhibited a strong broad peak at 304 nm, and observation of such a band is assigned to surface plasmon resonance of the particles. (B) X-ray diffraction patterns of PtNPs; the broad diffraction peaks of the XRD pattern at 2θ = 40.0, 47.6, 67.5, 81.8, and 88.6° were observed (C) FTIR spectra of PtNPs; (D) size distribution analysis of PtNPs by DLS; (E) TEM micrograph images of PtNPs; several fields were photographed and used to determine the diameter of AgNPs using TEM; and (F) corresponding particle size distribution histograms. At least three independent experiments were performed obtaining reproducible results and data from representative experiments are shown.
Figure 2
Figure 2
Dose-dependent effect of PtNPs, DOX, and CIS on U2OS cell viability. U2OS cell viability determined after exposure to different concentrations of (A) PtNPs (5–25 µg/mL), (B) DOX (1–5 µg/mL), or (C) CIS (5–25 µg/mL) for 24 h. Results are expressed as the mean ± standard deviation of three independent experiments. Differences between the treated and control groups were measured using Student’s t-test and statistically significant differences are indicated by * (p < 0.05). * p < 0.05 was considered significant; ** p < 0.01 was considered highly significant and *** p < 0.001 was considered very highly significant.
Figure 3
Figure 3
Dose-dependent effect of PtNPs, DOX, and CIS on U2OS cell proliferation. U2OS cell proliferation was determined after exposure to different concentrations of (A) PtNPs (5–25 µg/mL) or (B) DOX (1–5 µg/mL) or (C) CIS (5–25 µg/mL) for 24 h. Results are expressed as the mean ± standard deviation of three independent experiments. Differences between the treated and control groups were measured using Student’s t-test and statistically significant differences are indicated by * (p < 0.05). The results are presented as mean ± standard deviation of three experiments. * p < 0.05 was considered significant; ** p < 0.01 was considered highly significant and *** p < 0.001 was considered very highly significant.
Figure 4
Figure 4
Dose-dependent effect of DOX, PtNPs, and CIS on U2OS cell viability. (A) U2OS cells were incubated with different DOX concentrations (1–5 μg/mL) and a fixed PtNPs concentration (10 μg/mL) for 24 h and cell viability was measured using CCK-8. (B) U2OS cells were incubated with different PtNPs concentrations (5–25 μg/mL) and a fixed DOX concentration (1 μg/mL) for 24 h and cell viability was measured using CCK-8. (C) U2OS cells were incubated with different concentrations of DOX (1–5 μg/mL) and a fixed CIS concentration (5 μg/mL) for 24 h and cell viability was measured using CCK-8. Results are expressed as the mean ± standard deviation of three independent experiments. Differences between the treated and control groups were measured using Student’s t-test and statistically significant differences are indicated by * (p < 0.05). The results are presented as mean ± standard deviation of three experiments. * p < 0.05 was considered significant; ** p < 0.01 was considered highly significant and *** p < 0.001 was considered very highly significant.
Figure 5
Figure 5
In vitro cumulative drug release profiles of DOX dispersed in PBS at 25 °C, 37 °C, and 50 °C at 24 h and 48 h in pH = 5.5 and pH = 7.5. (A) Temperature-dependent release kinetics of DOX; (B) Time-dependent release kinetics of DOX.
Figure 6
Figure 6
PtNPs and DOX increase LDH leakage and cell death. U2OS cells were treated with PtNPs (10 μg/mL), DOX (1 μg/mL), CIS (5 μg/mL), or a combination of PtNPs (10 μg/mL) and DOX (1 μg/mL) or combination of DOX (1 μg/mL) and CIS (5 μg/mL) for 24 h. (A) LDH activity was measured at 490 nm using an LDH cytotoxicity kit; (B) cell death was quantified using a trypan blue assay. At least three independent experiments were performed for each sample. Differences between the treated and control groups were measured using Student’s t-test and statistically significant differences are indicated by * (p < 0.05). The results are presented as mean ± standard deviation of three experiments. * p < 0.05 was considered significant; ** p < 0.01 was considered highly significant and *** p < 0.001 was considered very highly significant.
Figure 7
Figure 7
PtNPs and DOX alter U2OS cell morphology. The effect of PtNPs and DOX on cell morphology was determined using an optical microscope after exposure to PtNPs (10 μg/mL), DOX (1 μg/mL), CIS (5 μg/mL), or a combination of PtNPs (10 μg/mL) and DOX (1 μg/mL) or combination of DOX (1 μg/mL) and CIS (5 μg/mL) for 24 h. Results are expressed as the mean ± standard deviation of three independent experiments; at least three independent experiments were performed for each sample. Cells exposed to PtNPs and DOX had lost their typical shape and cell adhesion capacity and reduced in size and cell density. Scale bar: 200 µm.
Figure 8
Figure 8
PtNPs and DOX induce ROS generation and lipid peroxidation in U2OS cells. U2OS cells were treated with PtNPs (10 μg/mL), DOX (1 μg/mL), CIS (5 μg/mL), or a combination of PtNPs (10 μg/mL) and DOX (1 μg/mL) or combination of DOX (1 μg/mL) and CIS (5 μg/mL) for 24 h. (A) ROS generation was measured using DCFH-DA-FITC with fluorescence microscopy. (B) Spectrophotometric ROS analysis was performed using DCFH-DA. (C) MDA concentrations were measured using a thiobarbituric acid-reactive substances assay and expressed as nanomoles per milliliter. Differences between the treated and control groups were measured using Student’s t-test and statistically significant differences are indicated by * (p < 0.05). The results are presented as mean ± standard deviation of three experiments. * p < 0.05 was considered significant; ** p < 0.01 was considered highly significant and *** p < 0.001 was considered very highly significant. Scale bar: 200 µm.
Figure 9
Figure 9
PtNPs and DOX increase the NO and protein carbonyl content of U2OS cells. U2OS cells were treated with PtNPs (10 μg/mL), DOX (1 μg/mL), CIS (5 μg/mL), or a combination of PtNPs (10 μg/mL) and DOX (1 μg/mL) or combination of DOX (1 μg/mL) and CIS (5 μg/mL) for 24 h. (A) NO production was quantified spectrophotometrically using Griess reagent and expressed as micromoles. (B) Protein carbonyl content was measured and expressed as nanomoles. Differences between the treated and control groups were measured using Student’s t-test and statistically significant differences are indicated by * (p < 0.05). The results are presented as mean ± standard deviation of three experiments. * p < 0.05 was considered significant; ** p < 0.01 was considered highly significant and *** p < 0.001 was considered very highly significant.
Figure 10
Figure 10
Effect of PtNPs and DOX on antioxidant markers. U2OS cells were treated with PtNPs (10 μg/mL), DOX (1 μg/mL), CIS (5 μg/mL), or a combination of PtNPs (10 μg/mL) and DOX (1 μg/mL) or combination of DOX (1 μg/mL) and CIS (5 μg/mL) for 24 h. After incubation, the cells were harvested, washed twice with an ice-cold PBS solution, collected, and disrupted by ultrasonication for 5 min on ice. (A) Glutathione reductase activity (GSH) was measured by monitoring the rate of NADPH oxidation. Oxidation of NADPH was monitored spectrophotometrically in kinetic mode for 5 min at 340 nm. Glutathione reductase activity was proportional to the rate of absorbance decrease. (B) Thioredoxin reductase (TRX) activity was measured by monitoring the conversion of DTNB to TNB by reduced thiols. Cell lysate was mixed with 100 μL of solution containing 5 mM DTNB and 250 μM NADPH. Absorbance was monitored spectrophotometrically in kinetic mode for 5 min at 405 nm. Thioredoxin reductase activity was proportional to the difference in TNB generation rate in samples. (C) Catalase activity was assayed by monitoring the rate of removal of exogenously added hydrogen peroxide in a colorimetric reaction. Absorbance was measured at 520 nm. Catalase activity was proportional to the difference in absorbance between a control sample and treated sample. (D) Superoxide dismutase activity was assayed by monitoring the rate of removal of exogenously added superoxide. Superoxide dismutase activity was proportional to the difference in absorbance increase rate between a control sample and the treated sample. (E) Glutathione peroxidase activity (GPx) was measured indirectly by monitoring NADPH consumption in a coupled reaction with glutathione reductase and (F) Glutathione S-Transferase (GSTs) activity was assayed spectrophotometrically at 25 °C with reduced glutathione (GSH) and 1-chloro-2, 4-dinitrobenzene (CDNB) as substrates. GST concentrations are expressed as micromoles. Differences between the treated and control groups were measured using Student’s t-test and statistically significant differences are indicated by * (p < 0.05). The results are presented as mean ± standard deviation of three experiments. * p < 0.05 was considered significant; ** p < 0.01 was considered highly significant and *** p < 0.001 was considered very highly significant.
Figure 11
Figure 11
PtNPs and DOX decrease the MMP and ATP content. U2OS cells were treated with PtNPs (10 μg/mL), DOX (1 μg/mL), CIS (5 μg/mL), or a combination of PtNPs (10 μg/mL) and DOX (1 μg/mL) or combination of DOX (1 μg/mL) and CIS (5 μg/mL) for 24 h and: (A) the MMP was determined using JC-1, a cationic fluorescent indicator; the (B) intracellular ATP content was determined according to the manufacturer’s instructions (Sigma-Aldrich, St. Louis, MO, USA; Catalog Number MAK135). Differences between the treated and control groups were measured using Student’s t-test and statistically significant differences are indicated by * (p < 0.05). The results are presented as mean ± standard deviation of three experiments. * p < 0.05 was considered significant; ** p < 0.01 was considered highly significant and *** p < 0.001 was considered very highly significant.
Figure 12
Figure 12
Effect of PtNPs and DOX on expression of pro and antiapoptotic genes (AF). U2OS cells were treated with PtNPs (10 μg/mL), DOX (1 μg/mL), CIS (5 μg/mL), or a combination of PtNPs (10 μg/mL) and DOX (1 μg/mL) or combination of DOX (1 μg/mL) and CIS (5 μg/mL) for 24 h and their relative mRNA expression of apoptotic and antiapoptotic genes was analyzed by quantitative RT-PCR. Expression was determined as the fold change compared to GAPDH expression. Differences between the treated and control groups were measured using Student’s t-test and statistically significant differences are indicated by * (p < 0.05). The results are presented as mean ± standard deviation of three experiments. * p < 0.05 was considered significant; ** p < 0.01 was considered highly significant and *** p < 0.001 was considered very highly significant.
Figure 13
Figure 13
PtNPs and DOX increase oxidative damage to DNA and RNA. U2OS cells were treated with PtNPs (10 μg/mL), DOX (1 μg/mL), CIS (5 μg/mL), or a combination of PtNPs (10 μg/mL) and DOX (1 μg/mL) or combination of DOX (1 μg/mL) and CIS (5 μg/mL) for 24 h and then (A) 8-oxo-dG and (B) 8-oxo-G levels were measured. Differences between the treated and control groups were measured using Student’s t-test and statistically significant differences are indicated by * (p < 0.05). The results are presented as mean ± standard deviation of three experiments. * p < 0.05 was considered significant; ** p < 0.01 was considered highly significant and *** p < 0.001 was considered very highly significant.
Figure 14
Figure 14
PtNPs aberrantly upregulate DNA damage and repair genes (AF). U2OS cells were treated with PtNPs (10 μg/mL), DOX (1 μg/mL), CIS (5 μg/mL), or a combination of PtNPs (10 μg/mL) and DOX (1 μg/mL) or combination of DOX (1 μg/mL) and CIS (5 μg/mL) for 24 h and the relative mRNA expression of DNA damage genes was analyzed by quantitative RT-PCR. Expression was determined as the fold change compared to GAPDH expression. Differences between the treated and control groups were measured using Student’s t-test and statistically significant differences are indicated by * (p < 0.05). The results are presented as mean ± standard deviation of three experiments. * p < 0.05 was considered significant; ** p < 0.01 was considered highly significant and *** p < 0.001 was considered very highly significant.

Similar articles

Cited by

References

    1. Longhi A., Errani C., De Paolis M., Mercuri M., Bacci G. Primary bone osteosarcoma in the pediatric age: State of the art. Cancer Treat. Rev. 2006;32:423–436. doi: 10.1016/j.ctrv.2006.05.005. - DOI - PubMed
    1. Nthumba P.M. Osteosarcoma of the jaws: A review of literature and a case report on synchronous multicentric osteosarcomas. World J. Surg. Oncol. 2012;10:240. doi: 10.1186/1477-7819-10-240. - DOI - PMC - PubMed
    1. Anninga J.K., Gelderblom H., Fiocco M., Kroep J.R., Taminiau A.H., Hogendoorn P.C., Egeler R.M. Chemotherapeutic adjuvant treatment for osteosarcoma: Where do we stand? Eur. J. Cancer. 2011;47:2431–2445. doi: 10.1016/j.ejca.2011.05.030. - DOI - PubMed
    1. Siegel R., Naishadham D., Jemal A. Cancer statistics, 2013. CA Cancer J. Clin. 2013;63:11–30. doi: 10.3322/caac.21166. - DOI - PubMed
    1. Schwartz C.L., Gorlick R., Teot L., Krailo M., Chen Z., Goorin A., Grier H.E., Bernstein M.L., Meyers P. Multiple drug resistance in osteogenic sarcoma: INT0133 from the Children’s Oncology Group. J. Clin. Oncol. Off. J. Am. Soc. Clin. Oncol. 2007;25:2057–2062. doi: 10.1200/JCO.2006.07.7776. - DOI - PubMed

LinkOut - more resources