

Phase Angle: A Possible Biomarker to Quantify Inflammation in Subjects with Obesity and 25(OH)D Deficiency
- PMID: 31362440
- PMCID: PMC6723101
- DOI: 10.3390/nu11081747
Phase Angle: A Possible Biomarker to Quantify Inflammation in Subjects with Obesity and 25(OH)D Deficiency
Abstract
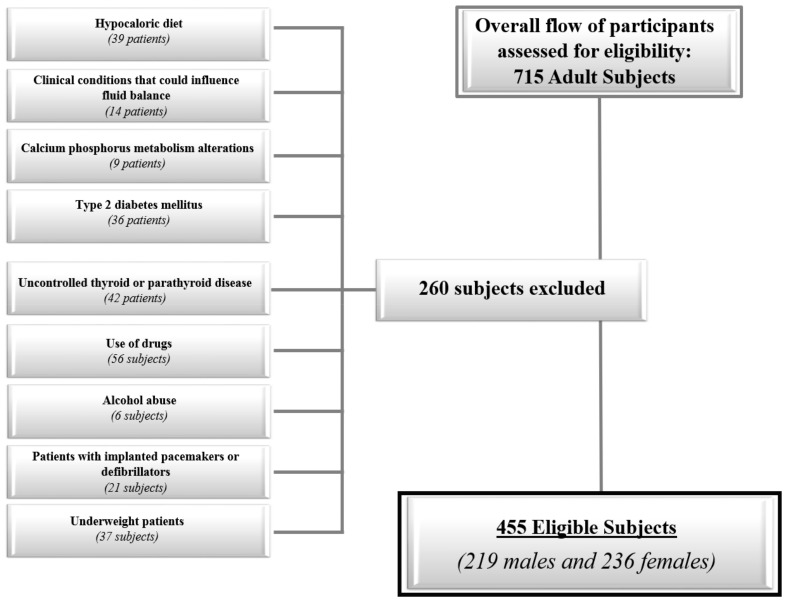
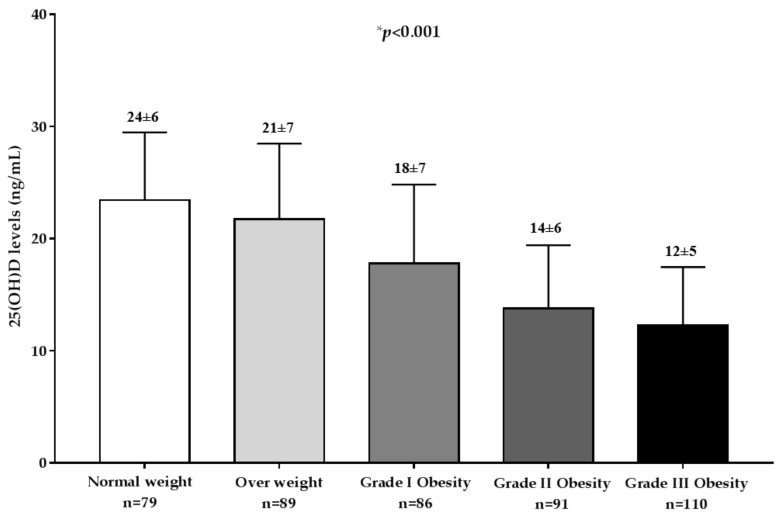
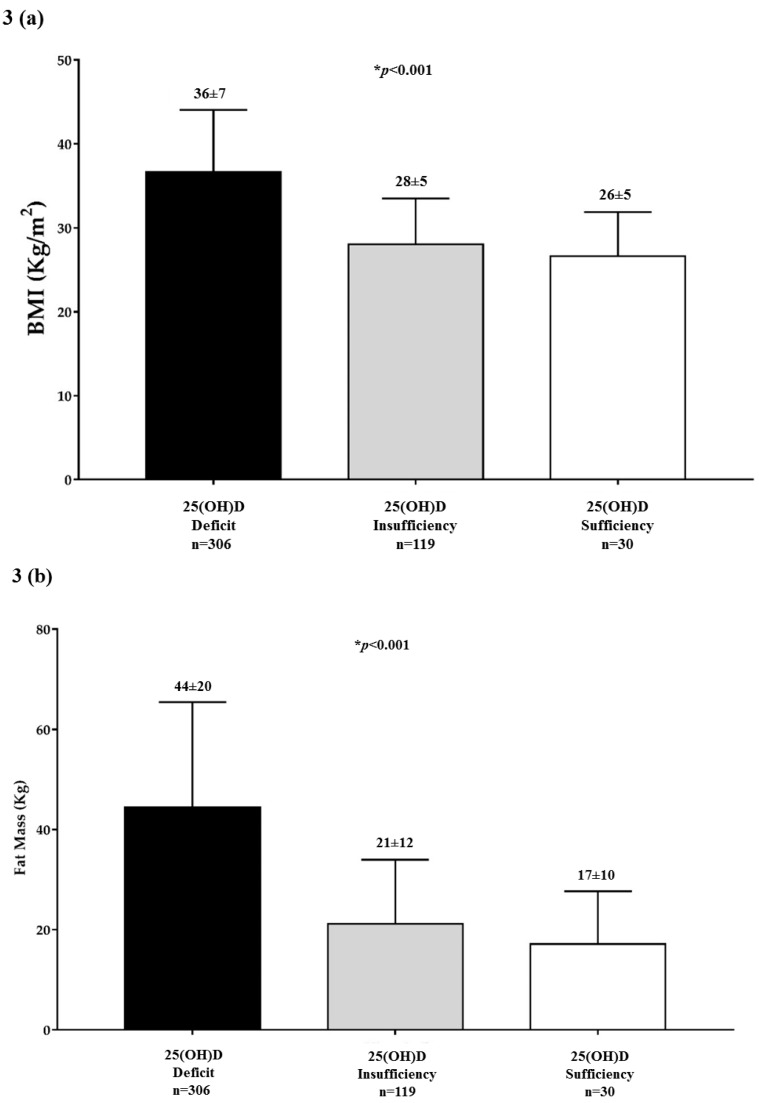
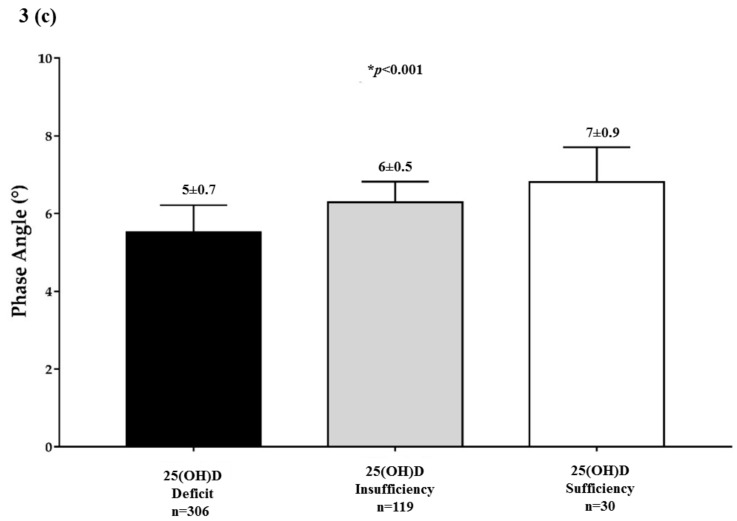
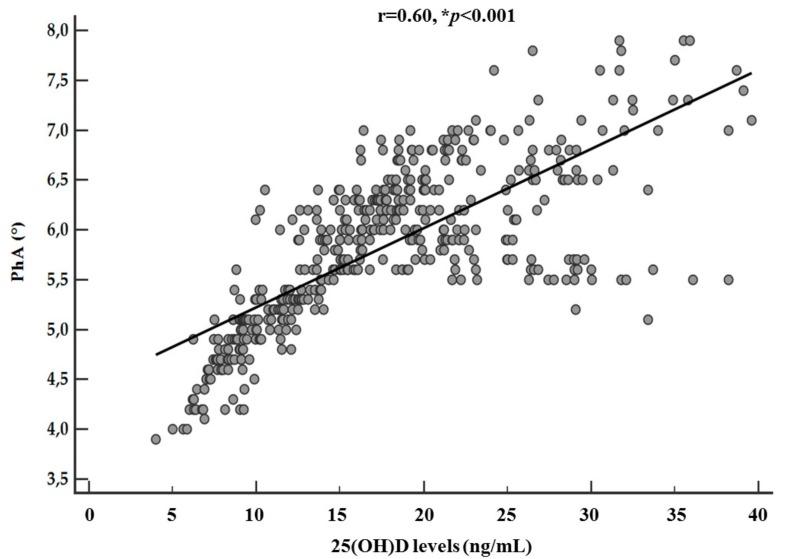
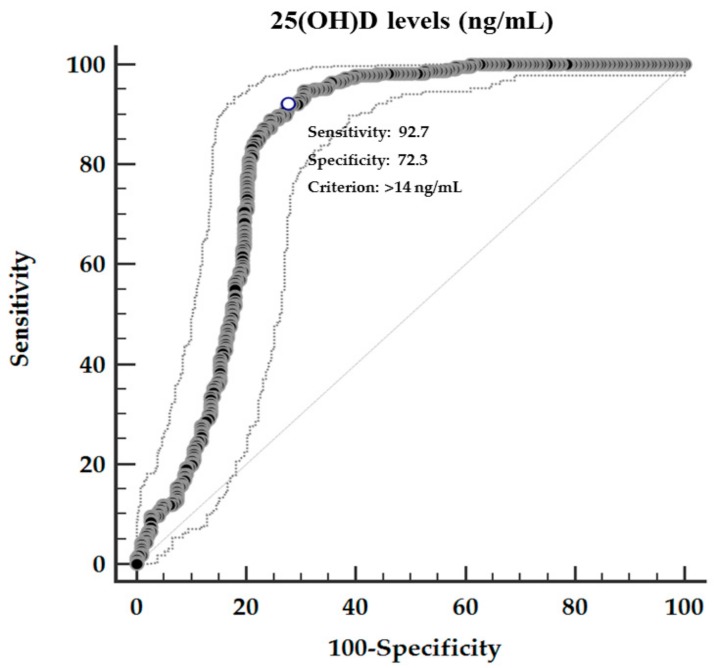
Obesity is associated to chronic low-grade metabolic inflammation and hypovitaminosis D. Among extra-skeletal effects, an important role in inflammation has been described for vitamin D (25(OH)D). Phase angle (PhA) is a bioelectrical impedance analysis (BIA) parameter that represents an indicator of cellular health in chronic inflammatory states. However, it is still unknown whether a low 25(OH)D levels might correlate with PhA in obesity. Considering the lack of evidence correlating the 25(OH)D levels with PhA in obesity, the aim of this study was to investigate their possible relationship in a group of patients with obesity stratified according to body mass index (BMI) categories. Four hundred and fifty-five adult subjects (219 males and 236 females; 36 ± 11 years) were enrolled. Body composition, including PhA, was assessed using a BIA phase-sensitive system. Serum levels of 25(OH)D was determined by a direct competitive chemiluminescence immunoassay. Most of the participants were affected by grade III obesity (24%) and had 25(OH)D deficiency (67%). Subjects with 25(OH)D deficiency had highest BMI (p < 0.001). Stratifying the sample population according to the BMI classes, 25(OH)D levels decreased significantly along with the increase in BMI (p < 0.001), with the lowest 25(OH)D levels in the class III obesity. In addition, stratifying the sample population according to 25(OH)D categories, BMI and fat mass (FM) decreased, while PhA increased significantly along with the 25(OH)D categories (p < 0.001). The 25(OH)D levels showed significant positive associations with PhA (r = -0.59, p < 0.001), and this association remained significant also after adjusting for BMI and FM (r = 0.60, p < 0.001). The lowest values of PhA were significantly associated with the severity of obesity (OR 0.3, p < 0.001) and of 25(OH)D deficiency (OR 0.2, p < 0.001). To compare the relative predictive power of body composition parameters associated with the 25(OH)D levels, we performed a multiple linear regression analysis. The most sensitive and specific cut-off for 25(OH)D levels to predict the PhA above the median was >14 ng/mL (p < 0.001). In conclusion, we provided preliminary insights into a novel link between 25(OH)D levels and PhA in the setting of obesity. This association uncovered a new potential usefulness of PhA as expression of cell membrane integrity and predictor of inflammation in low 25(OH)D status that might help in identifying high-risk patients with obesity who could benefit from careful 25(OH)D supplementation.
Keywords: Bioelectrical Impedance Analysis (BIA); Inflammation.; Obesity; Phase Angle (PhA); Vitamin D.
Conflict of interest statement
The authors declare no conflict of interest.
Figures
Similar articles
-
Sex Differences of Vitamin D Status across BMI Classes: An Observational Prospective Cohort Study.Nutrients. 2019 Dec 12;11(12):3034. doi: 10.3390/nu11123034. Nutrients. 2019. PMID: 31842281 Free PMC article.
-
A New Light on Vitamin D in Obesity: A Novel Association with Trimethylamine-N-Oxide (TMAO).Nutrients. 2019 Jun 10;11(6):1310. doi: 10.3390/nu11061310. Nutrients. 2019. PMID: 31185686 Free PMC article.
-
Vitamin D status is a determinant of skeletal muscle mass in obesity according to body fat percentage.Nutrition. 2015 Jun;31(6):801-6. doi: 10.1016/j.nut.2014.11.011. Epub 2014 Dec 19. Nutrition. 2015. PMID: 25933486
-
Body Mass Index, Vitamin D, and Type 2 Diabetes: A Systematic Review and Meta-Analysis.Nutrients. 2018 Aug 28;10(9):1182. doi: 10.3390/nu10091182. Nutrients. 2018. PMID: 30154381 Free PMC article.
-
Vitamin D status, body composition and hypertensive target organ damage in primary hypertension.J Steroid Biochem Mol Biol. 2014 Oct;144 Pt A:180-4. doi: 10.1016/j.jsbmb.2013.10.026. Epub 2013 Nov 1. J Steroid Biochem Mol Biol. 2014. PMID: 24189544 Review.
Cited by
-
Usefulness of phase angle on bioelectrical impedance analysis as a surveillance tool for postoperative infection in critically ill patients.Front Med (Lausanne). 2023 Feb 22;10:1111727. doi: 10.3389/fmed.2023.1111727. eCollection 2023. Front Med (Lausanne). 2023. PMID: 36910475 Free PMC article.
-
Association of Trimethylamine N-Oxide (TMAO) with the Clinical Severity of Hidradenitis Suppurativa (Acne Inversa).Nutrients. 2021 Jun 10;13(6):1997. doi: 10.3390/nu13061997. Nutrients. 2021. PMID: 34200594 Free PMC article.
-
Low Vitamin D Status in a Cancer Patient Population from Franconia, Germany.Complement Med Res. 2021;28(4):300-307. doi: 10.1159/000511993. Epub 2020 Dec 14. Complement Med Res. 2021. PMID: 33316808 Free PMC article.
-
Cardio-Metabolic Indices and Metabolic Syndrome as Predictors of Clinical Severity of Gastroenteropancreatic Neuroendocrine Tumors.Front Endocrinol (Lausanne). 2021 Mar 18;12:649496. doi: 10.3389/fendo.2021.649496. eCollection 2021. Front Endocrinol (Lausanne). 2021. PMID: 33815296 Free PMC article.
-
Association between dietary inflammatory index and phase angle in university employees: a cross-sectional study.Sci Rep. 2024 Sep 17;14(1):21664. doi: 10.1038/s41598-024-71855-9. Sci Rep. 2024. PMID: 39289398 Free PMC article.
References
-
- Lotfi-Dizaji L., Mahboob S., Aliashrafi S., Vaghef-Mehrabany E., Ebrahimi-Mameghani M., Morovati A. Effect of vitamin D supplementation along with weight loss diet on meta-inflammation and fat mass in obese subjects with vitamin D deficiency: A double-blind placebo-controlled randomized clinical trial. Clin. Endocrinol. 2019;90:94–101. doi: 10.1111/cen.13861. - DOI - PubMed
Publication types
MeSH terms
Substances
LinkOut - more resources
Full Text Sources
Medical
