

TSPAN12 Precedes Tumor Proliferation by Cell Cycle Control in Ovarian Cancer
- PMID: 31362470
- PMCID: PMC6681867
- DOI: 10.14348/molcells.2019.0015
TSPAN12 Precedes Tumor Proliferation by Cell Cycle Control in Ovarian Cancer
Abstract
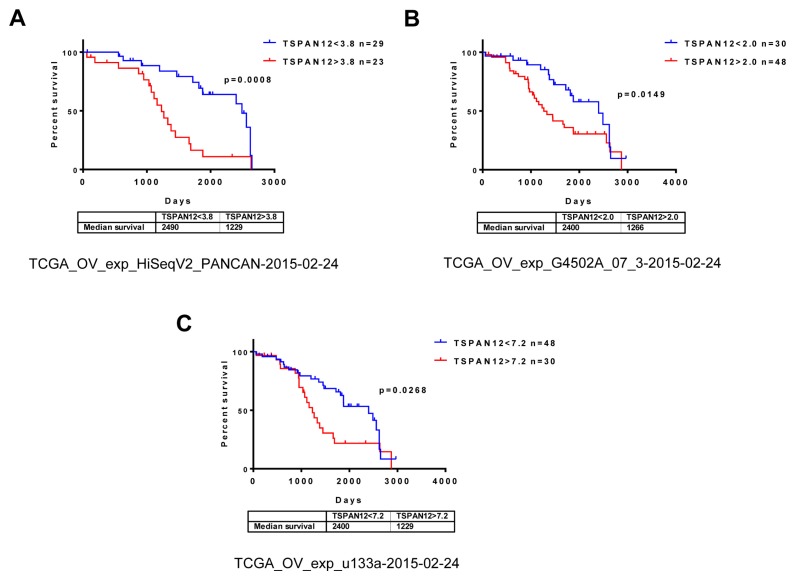
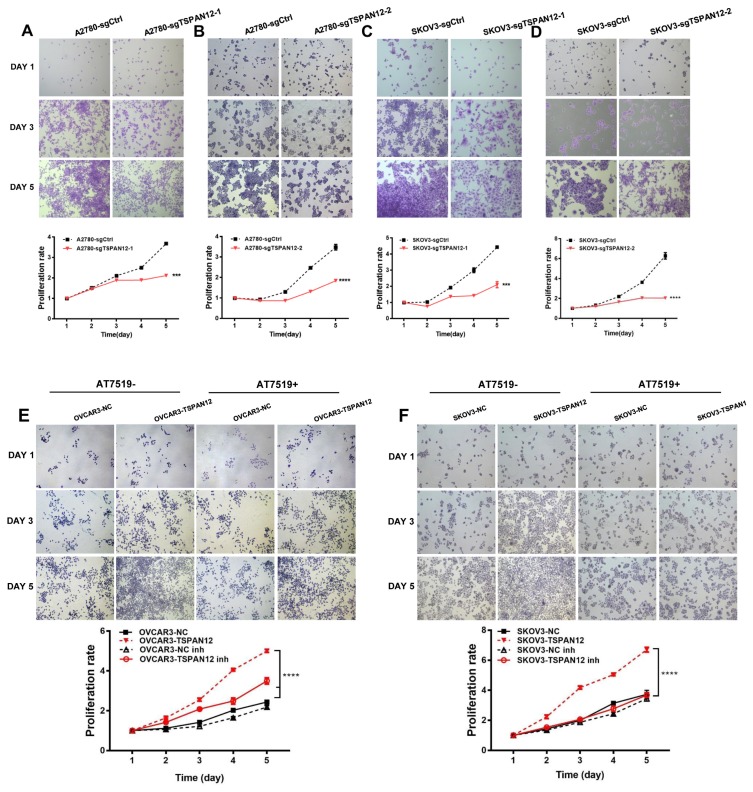
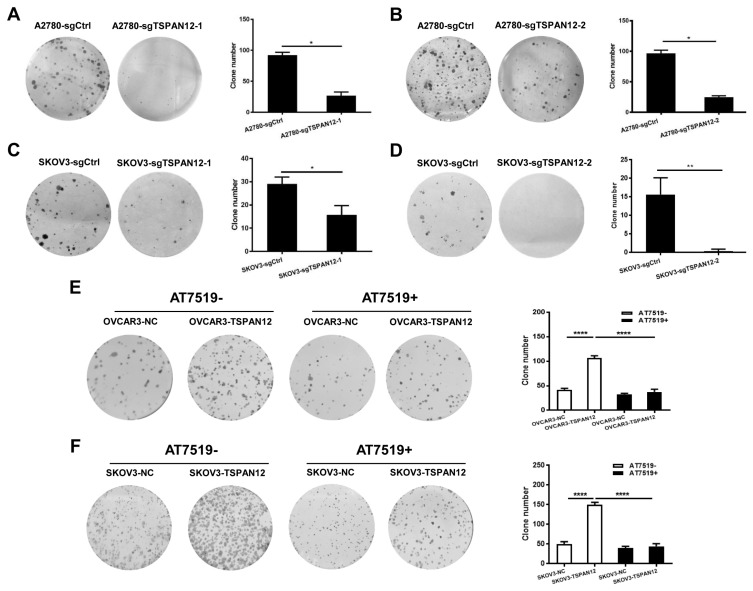
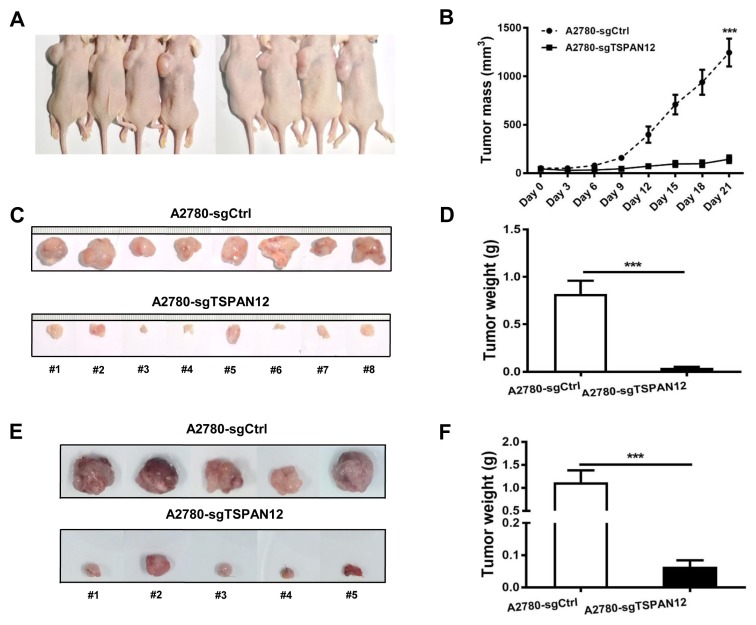
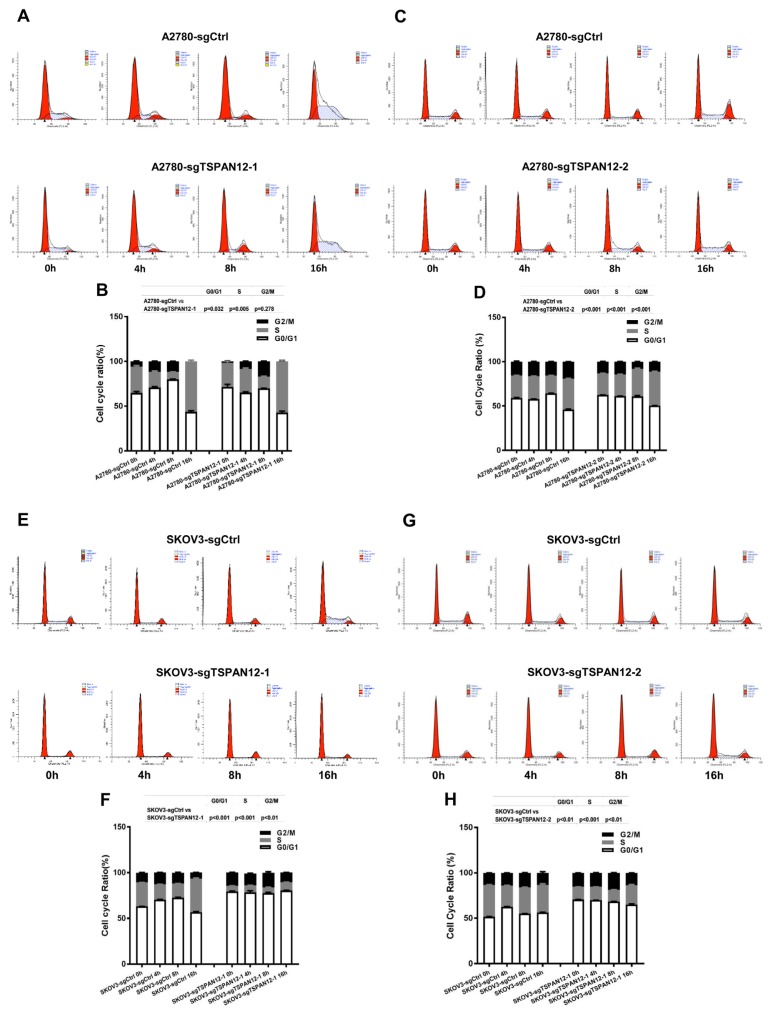
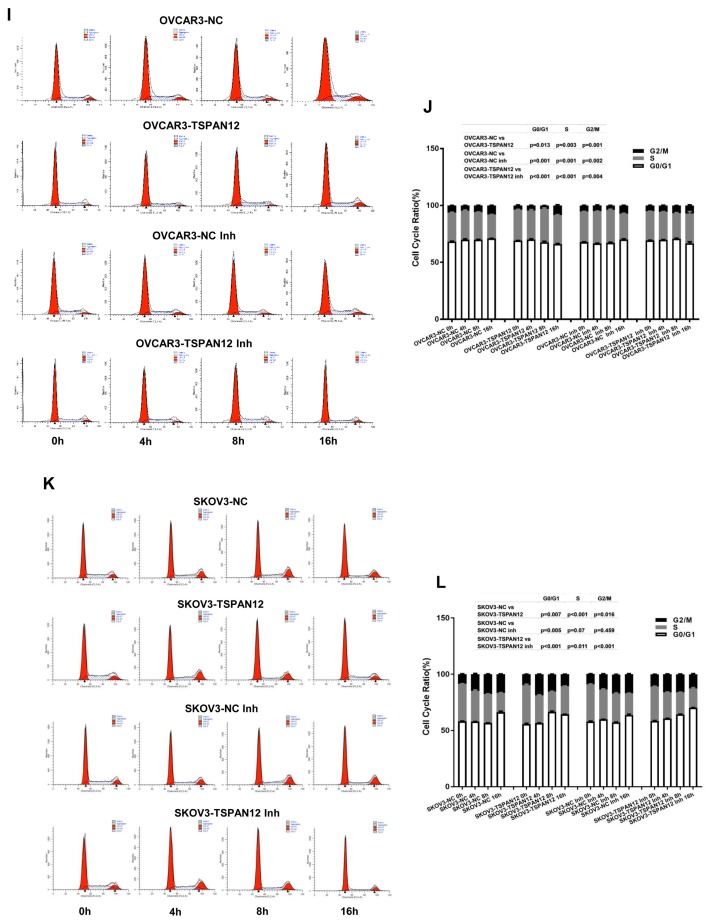
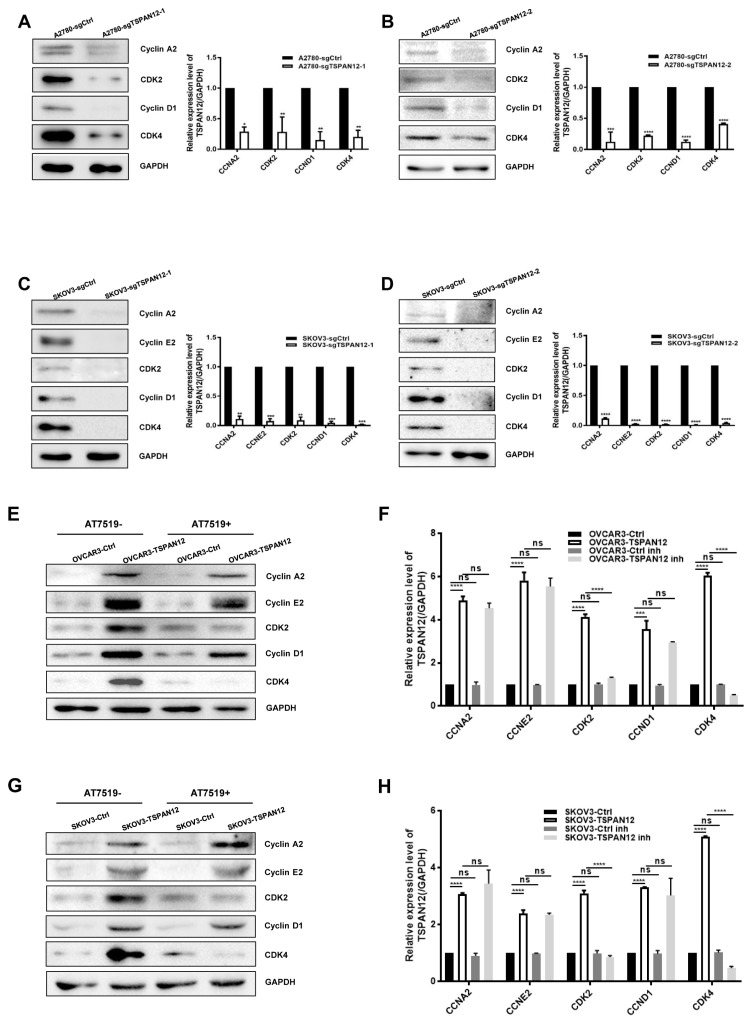
TSPAN12, a member of the tetraspanin family, has been highly connected with the pathogenesis of cancer. Its biological function, however, especially in ovarian cancer (OC), has not been well elucidated. In this study, The Cancer Genome Atlas (TCGA) dataset analysis revealed that upregulation of TSPAN12 gene expression was significantly correlated with patient survival, suggesting that TSPAN12 might be a potential prognostic marker for OC. Further exploration showed that TSPAN12 overexpression accelerated proliferation and colony formation of OVCAR3 and SKOV3 OC cells. Knockdown of TSPAN12 expression in A2780 and SKOV3 cells decreased both proliferation and colony formation. Western blot analysis showed that several cyclins and cyclin-dependent kinases (CDK) (e.g., Cyclin A2, Cyclin D1, Cyclin E2, CDK2, and CDK4) were significantly involved in the regulation of cell cycle downstream of TSPAN12. Moreover, TSPAN12 accelerated mitotic progression by controlling cell cycle. Thus, our data demonstrated that TSPAN12 could be a novel molecular target for the treatment of OC.
Keywords: TSPAN12; cell cycle; ovarian cancer; proliferation.
Conflict of interest statement
The authors have no potential conflicts of interest to disclose.
Figures
Similar articles
-
Cyclin Y regulates the proliferation, migration, and invasion of ovarian cancer cells via Wnt signaling pathway.Tumour Biol. 2016 Aug;37(8):10161-75. doi: 10.1007/s13277-016-4818-3. Epub 2016 Jan 29. Tumour Biol. 2016. PMID: 26831658
-
Effect of the WWOX gene on the regulation of the cell cycle and apoptosis in human ovarian cancer stem cells.Mol Med Rep. 2015 Aug;12(2):1783-8. doi: 10.3892/mmr.2015.3640. Epub 2015 Apr 17. Mol Med Rep. 2015. PMID: 25891642 Free PMC article.
-
Cyclin D1 degradation is sufficient to induce G1 cell cycle arrest despite constitutive expression of cyclin E2 in ovarian cancer cells.Cancer Res. 2009 Aug 15;69(16):6565-72. doi: 10.1158/0008-5472.CAN-09-0913. Epub 2009 Jul 28. Cancer Res. 2009. PMID: 19638577
-
VEGF111b, a C-terminal splice variant of VEGF-A and induced by mitomycin C, inhibits ovarian cancer growth.J Transl Med. 2015 May 20;13:164. doi: 10.1186/s12967-015-0522-0. J Transl Med. 2015. PMID: 25990504 Free PMC article.
-
[Molecular mechanisms controlling the cell cycle: fundamental aspects and implications for oncology].Cancer Radiother. 2001 Apr;5(2):109-29. doi: 10.1016/s1278-3218(01)00087-7. Cancer Radiother. 2001. PMID: 11355576 Review. French.
Cited by
-
SOX2-positive retinal stem cells are identified in adult human pars plicata by single-cell transcriptomic analyses.MedComm (2020). 2022 Dec 24;4(1):e198. doi: 10.1002/mco2.198. eCollection 2023 Feb. MedComm (2020). 2022. PMID: 36582303 Free PMC article.
-
Ring finger protein 152-dependent degradation of TSPAN12 suppresses hepatocellular carcinoma progression.Cancer Cell Int. 2021 Feb 18;21(1):122. doi: 10.1186/s12935-021-01806-1. Cancer Cell Int. 2021. PMID: 33602225 Free PMC article.
-
Flavokawain B Weakens Gastric Cancer Progression via the TGF-β1/SMAD4 Pathway and Attenuates M2 Macrophage Polarization.J Immunol Res. 2022 Jul 16;2022:4903333. doi: 10.1155/2022/4903333. eCollection 2022. J Immunol Res. 2022. PMID: 35879950 Free PMC article.
-
Tetraspanin 7 and its closest paralog tetraspanin 6: membrane organizers with key functions in brain development, viral infection, innate immunity, diabetes and cancer.Med Microbiol Immunol. 2020 Aug;209(4):427-436. doi: 10.1007/s00430-020-00681-3. Epub 2020 May 28. Med Microbiol Immunol. 2020. PMID: 32468130 Review.
-
The MexTAg collaborative cross: host genetics affects asbestos related disease latency, but has little influence once tumours develop.Front Toxicol. 2024 Apr 17;6:1373003. doi: 10.3389/ftox.2024.1373003. eCollection 2024. Front Toxicol. 2024. PMID: 38694815 Free PMC article.
References
MeSH terms
Substances
LinkOut - more resources
Full Text Sources
Medical
Molecular Biology Databases
Research Materials
