Review
. 2019 Dec;10(1):181-212.
doi: 10.1080/19491034.2019.1644592.

Probing the 3D architecture of the plant nucleus with microscopy approaches: challenges and solutions

Affiliations
Review

Probing the 3D architecture of the plant nucleus with microscopy approaches: challenges and solutions

Tao Dumur et al. Nucleus. 2019 Dec.

Erratum in

  • Correction.
    [No authors listed] [No authors listed] Nucleus. 2020 Dec;11(1):i. doi: 10.1080/19491034.2019.1669933. Epub 2019 Sep 18. Nucleus. 2020. PMID: 31532711 Free PMC article. No abstract available.

Abstract

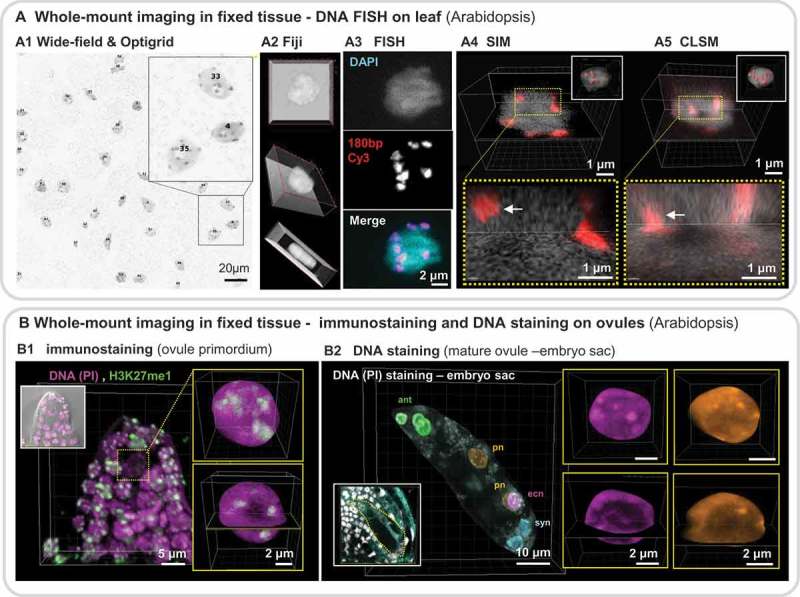
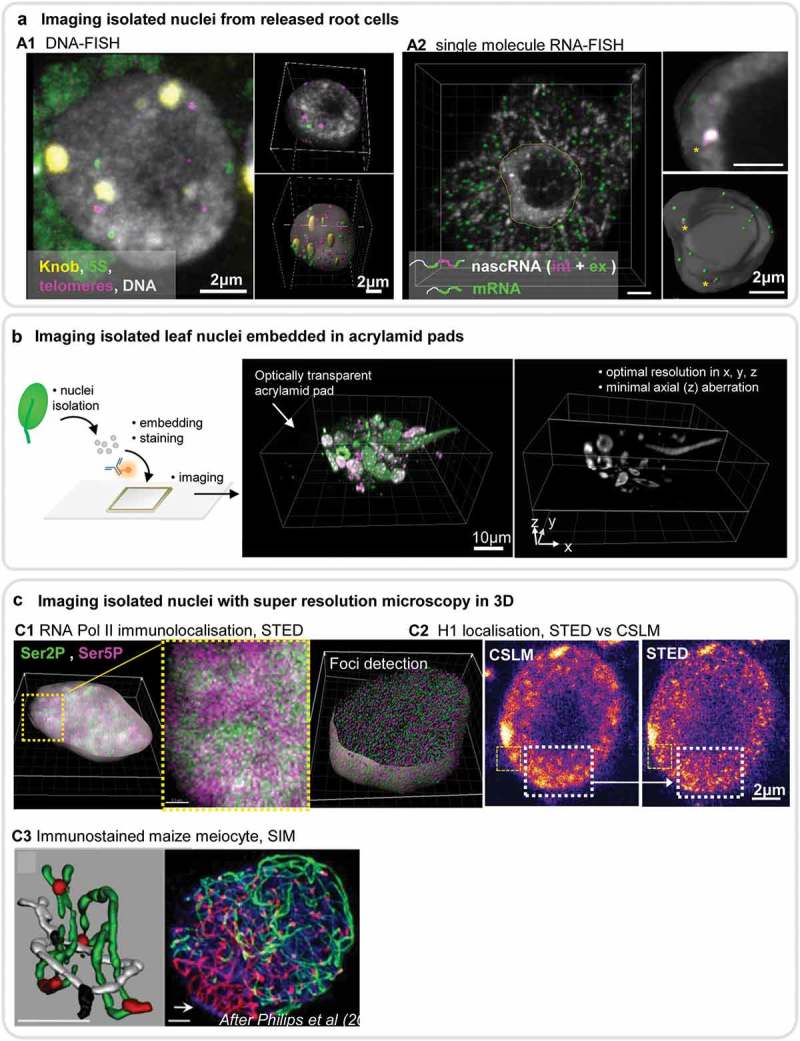
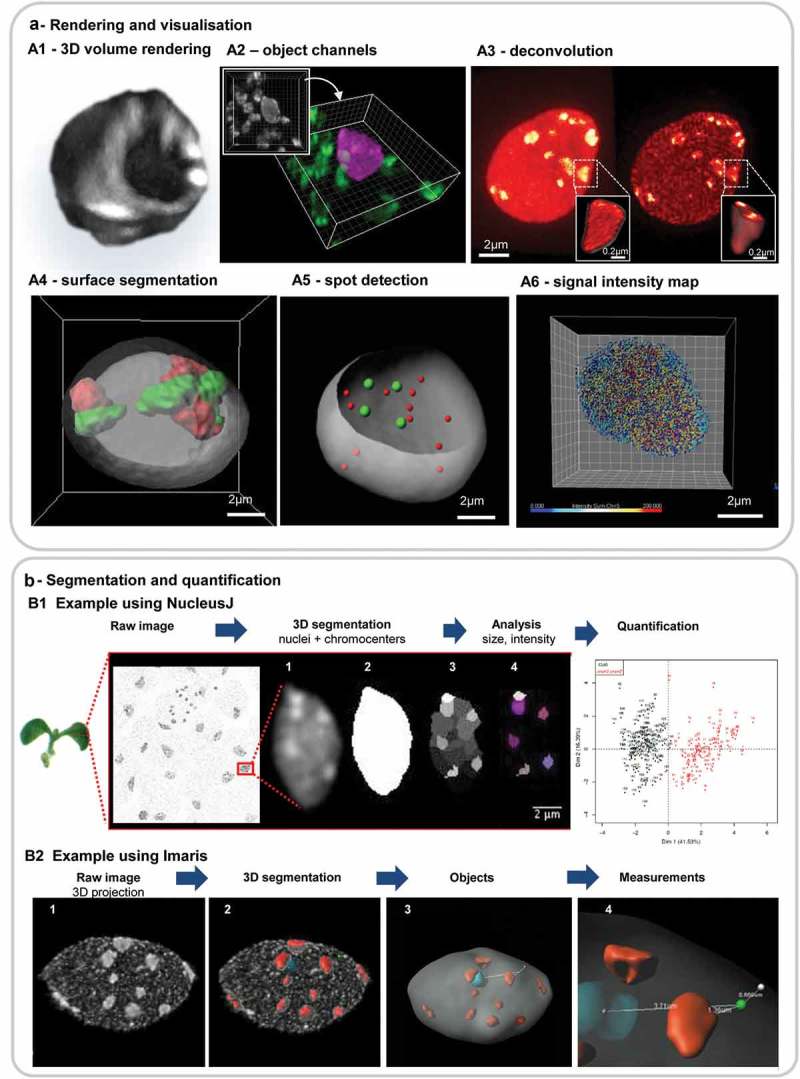
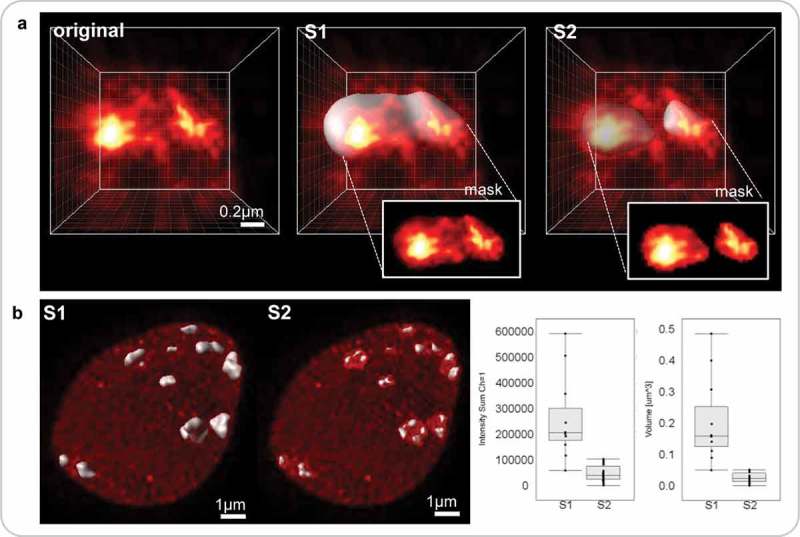
The eukaryotic cell nucleus is a central organelle whose architecture determines genome function at multiple levels. Deciphering nuclear organizing principles influencing cellular responses and identity is a timely challenge. Despite many similarities between plant and animal nuclei, plant nuclei present intriguing specificities. Complementary to molecular and biochemical approaches, 3D microscopy is indispensable for resolving nuclear architecture. However, novel solutions are required for capturing cell-specific, sub-nuclear and dynamic processes. We provide a pointer for utilising high-to-super-resolution microscopy and image processing to probe plant nuclear architecture in 3D at the best possible spatial and temporal resolution and at quantitative and cell-specific levels. High-end imaging and image-processing solutions allow the community now to transcend conventional practices and benefit from continuously improving approaches. These promise to deliver a comprehensive, 3D view of plant nuclear architecture and to capture spatial dynamics of the nuclear compartment in relation to cellular states and responses. Abbreviations: 3D and 4D: Three and Four dimensional; AI: Artificial Intelligence; ant: antipodal nuclei (ant); CLSM: Confocal Laser Scanning Microscopy; CTs: Chromosome Territories; DL: Deep Learning; DLIm: Dynamic Live Imaging; ecn: egg nucleus; FACS: Fluorescence-Activated Cell Sorting; FISH: Fluorescent In Situ Hybridization; FP: Fluorescent Proteins (GFP, RFP, CFP, YFP, mCherry); FRAP: Fluorescence Recovery After Photobleaching; GPU: Graphics Processing Unit; KEEs: KNOT Engaged Elements; INTACT: Isolation of Nuclei TAgged in specific Cell Types; LADs: Lamin-Associated Domains; ML: Machine Learning; NA: Numerical Aperture; NADs: Nucleolar Associated Domains; PALM: Photo-Activated Localization Microscopy; Pixel: Picture element; pn: polar nuclei; PSF: Point Spread Function; RHF: Relative Heterochromatin Fraction; SIM: Structured Illumination Microscopy; SLIm: Static Live Imaging; SMC: Spore Mother Cell; SNR: Signal to Noise Ratio; SRM: Super-Resolution Microscopy; STED: STimulated Emission Depletion; STORM: STochastic Optical Reconstruction Microscopy; syn: synergid nuclei; TADs: Topologically Associating Domains; Voxel: Volumetric pixel.

Keywords: Three-dimensional microscopy imaging; image processing and analysis; live imaging; nuclear organization; plant nucleus; tracking; whole-mount.


Figures

Figure 1.
Figure 1.
Imaging plant nuclei in live (fresh) whole-mount tissue. All images illustrate a nuclear staining in whole-mount with an overview of the tissue/organ (left) and close-up images (right panels) showing orthogonal sections or 3D rendering (powered by Imaris, Bitplane AG, CH). (a) Wide-field imaging (Leica DM6000) Fresh seedling root (Arabidopsis) stained in whole-mount with DAPI in 0.5xMS and 1% sucrose, imaged with an oil immersion objective (40x NA 1.3). Overview (max. projection (a1), detail of a single nucleus from the cortext zone (orthogonal sections, (a2), DAPI (grey) and H1.1-RFP (red), and detail of an epidermis nucleus (max.projection (a3), DAPI only. The image quality is suitable for quantification of the heterochromatin content. Image source CB. (b) Wide-field imaging (Leica DM6000) & Optigrid-based restoration. Fresh cotyledon (Arabidopsis) stained in whole mount with DAPI and imaged in oil-immersion objective (63x NA 1.4). Overview (max. projection (b1). grey, DAPI. The background fluorescence has been pseudocolored in cyan) and zoom on part of the image (insert). Detail of a single nucleus cropped from the large view (b2). Image source CT & SD. (c) Confocal imaging, CLSM (Zeiss LSM800). SUN2-GFP expressing root (Arabidopsis) counterstained with FM4-64 (magenta). Overview (blend volume rendering and trimming, (c1). Close up on a row of nuclei (c2) or a single nucleus (c3) showing 3D reconstructions of SUN2-GFP labeling in a heatmap color mode. 3D rendering allows to visualise SUN2-rich regions forming a belt in 3D (c2, right panel, segmented nuclear surface in grey, SNU2-GFP max intensity signals in heatmap color) and discrete domains in the nuclear membrane (c3, arrows. xy section-top and partial projection-bottom). Image source KG. (d) Confocal imaging, Spinning disk (Visitron Systems GmbH Visiscope). H2B-RFP expressing root (Arabidopsis). Overview (max.projection, D1, grey, H2B-RFP. Background fluorescence pseudocolored in cyan) and detail of a single nucleus after image trimming at the same magnification (D2, max projection – top, orthogonal slices – bottom). Image source TD. (e) Multiphoton imaging (Leica SP8 MP). H1.1 RFP, H1.2-GFP expressing roots (Arabidopsis) mounted in 0.5xMS and imaged in water-immersion objective (25x, NA 0.9). Overview (blend volume rendering – left, orthogonal slicers middle and right panels). The imaging depth enables imaging nuclei throughout the root organ. Image source CB. (f) Multiphoton imaging & Hyvolution-based restoration (Leica SP8 MP). Same sample as in E. A single nucleus from the cortex region has been re-imaged at higher magnification (63x NA 1.3) and using the Hyvolution module (SVI-based deconvolution on the fly). This enables analysing H1.1 and H1.2 distribution as punctuate foci in euchromatin and chromocenters, showing H1.2 islands distinct from H1.1 regions. Image source CB.
Figure 2.
Figure 2.
Imaging plant nuclei in whole-mount fixed tissue. Examples of imaging nuclei in 3D in whole-mount fixed tissues are shown for different nuclear fluorescent labeling: FISH, chromatin immunostaining, DNA staining. (a) Imaging nuclei in the leaf epidermis (Arabidopsis) at high resolution following DNA FISH. Overview of a leaf fragment, wide-field image stack of 6.5 µm2 (2048 x 2048 pixels) (a1) in transmission light. Nuclei are stained with DAPI, Close-up on subregions and individual nuclei. (a2) 3D projections using Fiji in a tripartite panel. (a3) Fluorescent In Situ Hybridization (FISH) decomposition into the individual DNA (DAPI) and FISH probe (180bp repeat oligo labeled with Cy3) and overlay (merge) – right panel. Comparison of image details obtained using structured illumination microscopy (SIM, Leica DM6000 & Optigrid, (a4) or confocal imaging (CLSM, Zeiss LSM800), (a5) of the same nucleus. The images show orthogonal slicers (top panel) and a close-up view (dotted yellow box, lower panel) showing the different resolution and image contrast, particularly at chromocenters (red). A 3D reconstruction with segmented nuclear surface (grey) and chromocenters (red) are shown as insets. Empowered by Imaris (Bitplane AG, CH). (b) Imaging nuclei in whole-mount ovules (Arabidopsis) at high resolution following immunostaining (b1) or DNA staining (b2). Ovule primordia (B1) or mature ovules (B2) were embedded in acrylamid, fixed, cleared, permeabilised, immunostained for a chromatin mark (H3K27me1, green, B1) and counterstained for DNA (PI, propidium iodide, magenta, B1) or stained for DNA only (PI, B2). Ovules were imaged by confocal microscopy (Leica SP2 and SP5, 63x Gly, NA 1.3) with 2–3-fold oversampling. The images were denoised but not deconvolved. b1 shows a max.projection (inset: overlay with the transmission DIC channel) and detail of the nucleus of the spore mother cell after 3D segmentation (yellow insets) as max.projection and with orthogonal slice views. This image quality allows for signal quantification and measurements of relative histone modification levels [91]. b2 shows a mature embryo sac before fusion of the polar nuclei (pn). The original image is shown in the inset (nuclei, grey. Reflection light, cyan). For this 3D representation, the embryo sac was manually segmented in 3D, as well as individual nuclei, to create 3D masks and corresponding channels identifying the polar nuclei (pn), egg cell nucleus (ecn), synergid nuclei (syn) and three antipodal nuclei (ant). Inerts on the right show max.projections and orthogonal sections of the ecn and one pn, showing high level of details in chromatin distribution.
Figure 3.
Figure 3.
Imaging isolated nuclei at high resolution in 3D. (a) Imaging of nuclei from released cells: tissue squashes (e.g. root) produces nuclei with little deformation suitable for DNA and RNA FISH. (b1) DNA FISH on maize root nuclei showing a max.projection (main, left panel) of all channels as indicated in the legend (All probes are oligonucleotides: 5S rDNA-FITC, Knob-Cy5, telomere-Cy3; DAPI counterstaining). Chloroplast autofluorescence also appears in the green channel. 3D reconstructions and segmentation of the nucleus and signals are shown on the right. Image source INDEPTH training school (2018). (b2) RNA FISH on Arabidopsis root cells using oligoprobes PP2A-Quasar570 (magenta): PP2A intronic probe (2 spots); PP2A-Quasar670 (green): PP2A exonic probe (>100 spots), allowing to distinguish the nascent (nasc) from the mature messenger (m) RNA. DAPI counterstaining (grey). The stars (*) indicate two intronic signals co-localising with the exonic signals. Overview and 3D reconstruction and segmentations as explained in B1. Nuclei were imaged using a wide-field Leica DM6000 & Optigrid-based restoration. Image source INDEPTH training school (2018). (b) Principle of nuclei embedding for high quality 3D imaging. Plant tissues (e.g. leaf) are used to isolate bulk nuclei before embedding in an acrylamide (or other matrix) pad on slide and subsequent staining steps (see text for references). Images on the right shows the perfect transparency of the embedding matrix and intact nuclei enabling optimal, high quality imaging even with conventional microscopy imaging (here, CLSM). H1 and H2A/H2B labeling (green, magenta, image on the left) and DNA staining (grey, image on the right). Image source CB. (c) Imaging isolated nuclei with super resolution microscopy in 3D becomes feasible with the preparations illustrated above. Dark-grown seedling cotyledon nuclei were isolated and embedded for immunostaining against RNA Pol II isoforms (C1) or H1 (C2). c1 shows the distribution of RNA Pol II isoforms (Ser2P, Ser5P) in a segmented nucleus (SiR dye DNA counterstaining, grey « shell ») and close up displaying clusters of the distinct isoforms as reported before [97]. The segmented image shows spot detection (RNA Pol II foci) enabling future analyses of density and intensity distributions in 3D. Images acquired with Leica SP8 STED microscope. Image source RR & CB. c2 shows a comparison of signal resolution in a single plane of H1 distribution imaged by CLSM or STED. Note the higher signal contrast in the dashed-line region in the STED image. Image source CB. c3 reproduces a published panel of SIM imaging of maize meiocytes showing ZYP1(red) and ASY1(green) immunolocalisation with DNA counterstaining (DAPI, blue) and a 3D reconstruction of an interlock (left). Image source [108].
Figure 4.
Figure 4.
Examples of 3D image processing steps useful for qualitative and quantitative analyses of the plant nucleus. (a) Image rendering and visualisation. Reconstruction and segmentation-based visualisation of 3D image data for improved information delivery. (a1) Volume rendering (blend mode) with orthogonal slicers, (a2) object-based channel creation: following segmentation, the nucleus was separated from the surrounding material as distinct channel (mask) and pseucolored differently than the secondary channel. (a3) Image restoration by deconvolution (Huygens, SVI), DNA-stained nucleus imaged by STED imaging (a4) segmentation of the nuclear surface and chromosome territories using the surface function of Imaris, (a5) segmentation of the nuclear surface and FISH signals [centromeres (green), telomeric (red)] using the spot function of Imaris, (a6) segmentation of immunosignals (anti-RNA Pol II CTD-Ser2P isoform) using the spot function of Imaris and colored according to signal intensity (heatmap scale). Source of images: A2, A3, A6: isolated cotyledon nuclei embedded in acrylamide stained for DNA (DAPI, A2; SiR-Hoechst dye [107], A3) or immunostained (RNA Pol II-ser2P, A6); endosperm nuclei [A4, A5) DNA and FISH staining as described in [64, 108]. Reconstructions powered by the Imaris software (Bitplane). (b) Image segmentation and quantification. Two examples are shown that are used to segment and analyse chromocenter distribution in complex images reporting on bulk nuclei using the ImageJ NucleusJ plugin (b1), and to segment individual nuclei using Imaris XTFISHInsideNucleus plugin (b2). b1 Image acquisition of a cotyledon epidermal layer following DAPI staining using a wide-field microscope (Leica DM6000). The complete image contains up to 20–100 nuclei. (1) Each nucleus is individualized and (2) then subjected to segmentation. Segmentation of the nucleus is based on Otsu’s thresholding method. (3) Chromocenters segmentation is based on the watershed algorithm applied here to 3D images. (4) Finally, the user manually determines the threshold to be applied in order to obtain a segmentation reflecting the initial image: in this image six chromocenters have been manually validated by the biologist. Image source CT & SD. b2 Nucleus segmentation in Imaris can be done either semi-automatically (using the segmentation wizard for the different channels or automatically. 1. Max.projection of a DAPI stained nucleus (isolated, embedded as in Figure 3(a)) imaged by CLSM and deconvolved (Huygens, SVI) (2) segmented image: chromocenters (red), nuclear surface (grey), nucleolus (cyan). A theoretical FISH signal (green dot) has been added for illustration purposes. (3) Object detection and image rendering of nuclear bodies, (4) illustrates the possibility to compute the distance of chosen (or all) objects relative to each other and to the nuclear periphery (where a white, intersecting dot is placed). Image source courtesy of M. Ashenafi, image processing CB.
Figure 5.
Figure 5.
Impact of different segmentation parameters on downstream analyses of nuclear features. Segmentation parameters influence the shape and boundary of the 3D objects created and will impact downstream analyses in delivering different results of distinct biological significance. Segmentation parameters which may be question-dependent, should thus be defined at the beginning of each batch processing. (a) image detail of a chromocenter from a DNA-stained nucleus imaged by STED and restored by deconvolution (Figure 4A3): original, no segmentation; S1and S2, Imaris-based surface segmentation using the following parameters: background subtraction, largest sphere diameter = 0.4 µm, surface details = 0.1 µm, manual threshold value 24–97 (S1) or 59–166 (S2), without (S1) or with (S2) ‘split touching object’ function (seed point = 0.26 µm). S1 identifies a large, yet heterogeneously staining CC domain while S2 captures individual subdomains in the CC as shown in the insets (channel masks created on each surface). (b) The results from S1 and S2 are shown at the nuclear scale. Both methods yield different results with distinct biological significance (because they capture different object type) regarding the distribution of fluorescence intensity sum and volume of CCs (left and right graphs, respectively). Graphs computed in ImarisVantage.
Figure 6.
Figure 6.
Live-tracking nuclei using the TARDIS pipeline. Growing, intact roots were mounted in physiological medium and imaged with a spinning disk microscope for 5 h. The field of view captured several nuclei, as shown in Figure 1(d). The TARDIS software allows for microscope stage repositioning and live nuclei tracking, facilitating downstream image processing aiming at capturing quantitative changes in nuclear organization. (a) Representative maximum intensity projection of three individual nuclei at indicated time points, scale bar = 10 µm. The last timepoint of trichoblast 1 correspond to 4 h 20 min. (b) Quantitative analysis of nuclear architecture: nuclear volume (left), chromocenter number (middle), and relative heterochromatin volume (RHV) measured from nuclei shown in (a) during the time-lapse experiment.

Similar articles

Cited by

References

    1. Meier I. LINCing the eukaryotic tree of life - towards a broad evolutionary comparison of nucleocytoplasmic bridging complexes. J Cell Sci. 2016;129(19):3523–3531. - PubMed
    1. van Driel R, Fransz P. Nuclear architecture and genome functioning in plants and animals: what can we learn from both? Exp Cell Res. 2004;296(1):86–90. - PubMed
    1. Thorpe SD, Charpentier M. Highlight on the dynamic organization of the nucleus. Nucleus. 2017;8(1):2–10. - PMC - PubMed
    1. Sotelo-Silveira M, Chavez Montes RA, Sotelo-Silveira JR, et al. Entering the next dimension: plant genomes in 3D. Trends Plant Sci. 2018;23(7):598–612. - PubMed
    1. Grob S, Grossniklaus U. Chromosome conformation capture-based studies reveal novel features of plant nuclear architecture. Curr Opin Plant Biol. 2017;36:149–157. - PubMed

Publication types