. 2019 Jul 26;16(156):20190230.
doi: 10.1098/rsif.2019.0230. Epub 2019 Jul 31.

Relating evolutionary selection and mutant clonal dynamics in normal epithelia

Affiliations

Relating evolutionary selection and mutant clonal dynamics in normal epithelia

Michael W J Hall et al. J R Soc Interface. .

Abstract

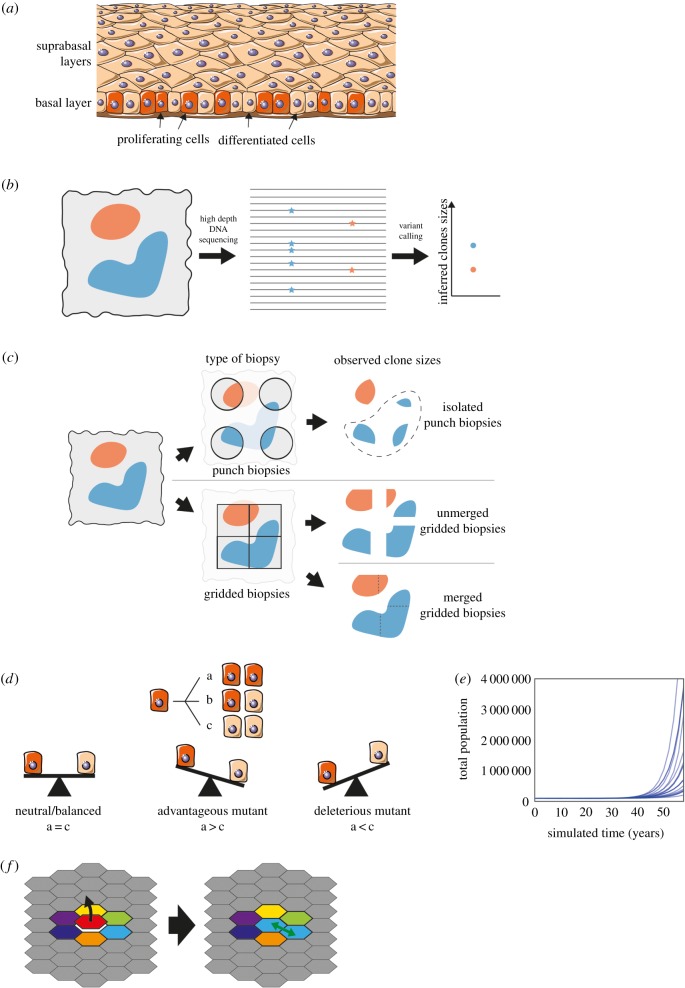
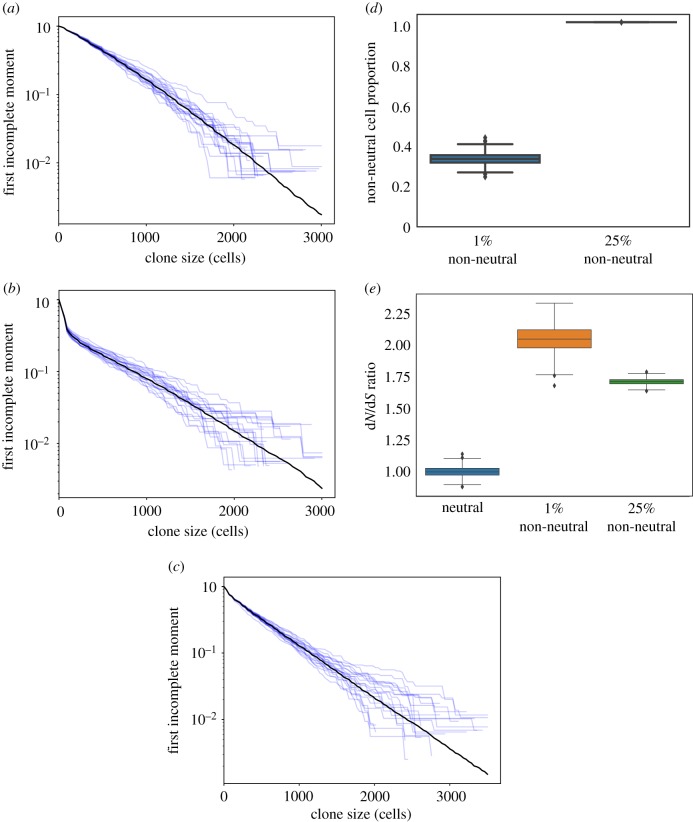
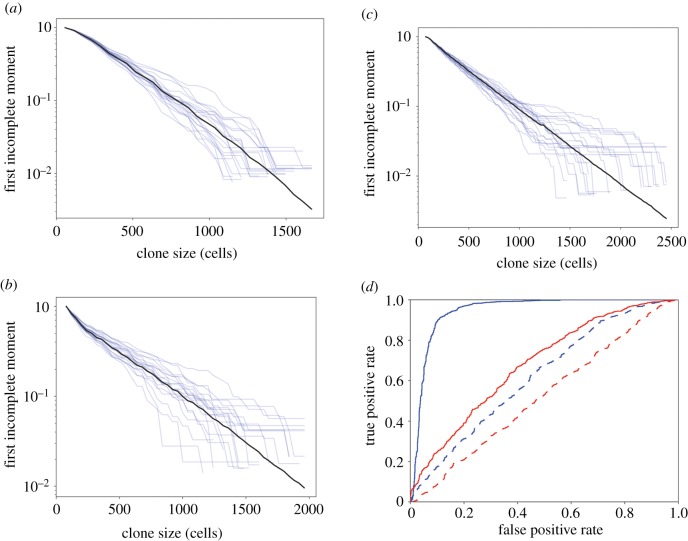
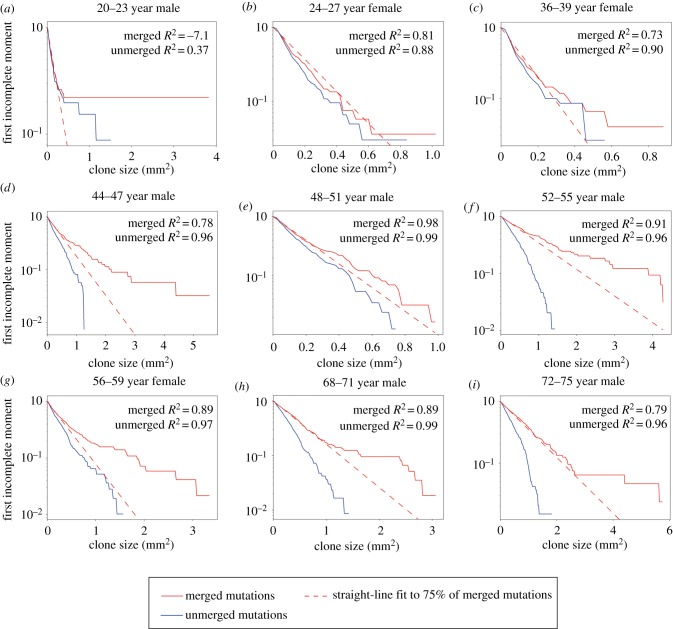
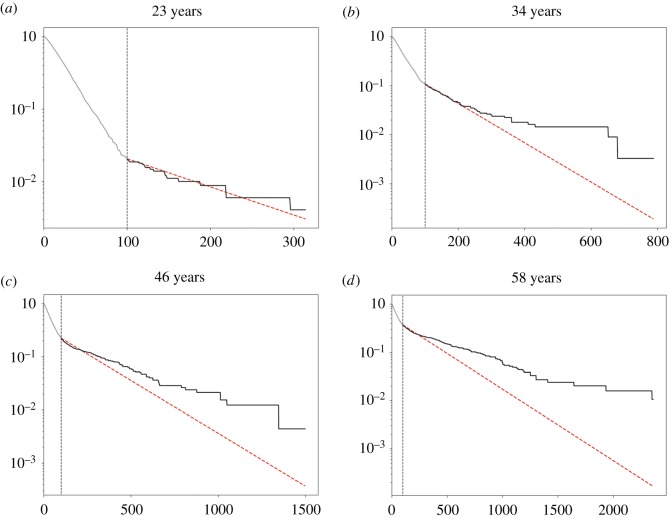
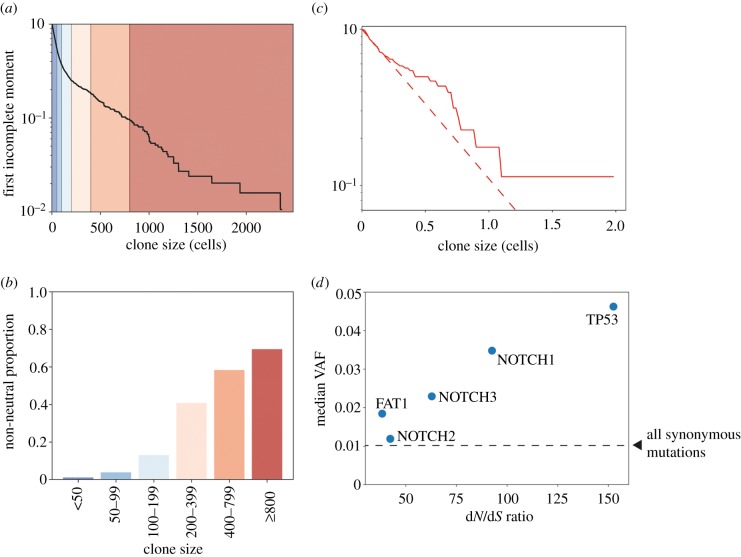
Cancer develops from mutated cells in normal tissues. Whether somatic mutations alter normal cell dynamics is key to understanding cancer risk and guiding interventions to reduce it. An analysis of the first incomplete moment of size distributions of clones carrying cancer-associated mutations in normal human eyelid skin gives a good fit with neutral drift, arguing mutations do not affect cell fate. However, this suggestion conflicts with genetic evidence in the same dataset that argues for strong positive selection of a subset of mutations. This implies cells carrying these mutations have a competitive advantage over normal cells, leading to large clonal expansions within the tissue. In the normal epithelium, clone growth is constrained by the limited size of the proliferating compartment and competition with surrounding cells. We show that if these factors are taken into account, the first incomplete moment of the clone size distribution is unable to exclude non-neutral behaviour. Furthermore, experimental factors can make a non-neutral clone size distribution appear neutral. We validate these principles with a new experimental dataset showing that when experiments are appropriately designed, the first incomplete moment can be a useful indicator of non-neutral competition. Finally, we discuss the complex relationship between mutant clone sizes and genetic selection.

Keywords: DNA sequencing; cancer; oesophagus; stem cells.


Conflict of interest statement

We declare we have no competing interests.

Figures

Figure 1.
Figure 1.
Data collection and cell dynamics. (a) Proliferation occurs in the basal layer of the epithelium. After differentiation, cells migrate through the suprabasal layers before being shed. Image from smart.servier.com, licensed under CC BY 3.0, edited from original. (b) DNA from a biopsy (left) containing mutant clones (red and blue) is sequenced and the VAF (proportion of reads containing the mutation, middle) used to infer clone sizes (right). (c) The method of taking biopsies can affect the observed mutant clone size distribution. Isolated punch biopsies (top) may not capture the entirety of a mutant clone; in the analysis in [11], clones that spanned multiple biopsies (shown in dashed area) were excluded. Ungapped gridded biopsies (bottom) enable the reconstruction of larger clone sizes. (d) The stochastic single progenitor model of cell dynamics. Each dividing cell (red) can produce two dividing cells (a), two non-dividing differentiated cells (brown) (c) or one of each type (b). In a homeostatic tissue or neutral clone, the probabilities of each symmetric division option are balanced (left). An advantageous mutation would increase the proportion of dividing cells produced (middle), and a deleterious mutation would increase the proportion of differentiated cells (right). Note that in the non-neutral case, the probabilities of each division type do not have to be fixed over time, but can depend on the cell context. (e) Simulation of the model shown in (d). If mutations introduce perpetual positive fate imbalances then the population will eventually explode. Total population of 20 simulations with mutations introducing only small fate imbalances drawn from NN (mean = 0.25%, std = 1.25%). (f) In the spatial Moran process, a differentiating cell (red) is replaced by the division of a neighbouring cell (light blue).
Figure 2.
Figure 2.
First incomplete moments of 2D simulations. (ac) First incomplete moments of 2D simulations (Methods). The average of 1000 simulations is shown in black, a selection of 20 individual simulations is shown in blue. (a) Neutral simulations. (b) Simulations where 1% of mutations are non-neutral. A deviation from the straight line is seen at clone sizes of approximately 100 cells. (c) Simulations where 25% of mutations are non-neutral. (d) Proportion of cells at the end of the simulations with a fitness altered by non-neutral mutations. In the 25% non-neutral simulations, by the end of the simulation, almost the entirety of the tissue has been colonized by non-neutral mutant clones. (e) dN/dS values from the simulations shown in (ac). To enable this calculation for the neutral simulations, a proportion of neutral mutations were labelled as non-neutral but did not affect cell fitness. (Online version in colour.)
Figure 3.
Figure 3.
First incomplete moments of 2D simulations with biopsy sequencing. (ac) The simulations from figure 2ac respectively, with the effects of biopsy and sequencing. (d) ROC curves using R2 of the log first incomplete moment of the clone size distribution as the classifying statistic. Red, simulated biopsy and sequencing; blue, full data randomly subsampled to match biopsy plus sequencing sample sizes. Solid, 1% non-neutral; dash, 25% non-neutral. Area under the curve (AUC) is a measure of how successful the classifier is at distinguishing the two groups. A perfect classifier will have an AUC of 1. A random guess will have an AUC of 0.5. AUCs: full data, 1% non-neutral, 0.94; biopsy plus sequencing, 1% non-neutral, 0.68; full data, 25% non-neutral, 0.62; biopsy plus sequencing, 25% non-neutral, 0.52.
Figure 4.
Figure 4.
Normal human oesophagus. (ai) First incomplete moments of the human oesophagus mutation data for the nine individuals in the study [5]. The clone sizes are either inferred from each 2 mm2 sample without merging (blue) or by using the gridded system to infer the size of mutations which span multiple samples using the methods of the original study [5] (red, solid). The extent of deviation from the straight line can be seen by comparing the data (solid) to the dashed red line, which shows a straight-line fit to the smallest 75% of clones in the merged case. Loss of heterozygosity (LOH) copy number changes were frequently found to co-occur with protein-altering NOTCH1 mutations [5] and to obtain conservative estimates of clone sizes, we assume this is the case for all protein-altering NOTCH1 mutations. All other mutations on chromosomes 1–22 were assumed to be heterozygous. R2 values can be negative because the line fitting is constrained to pass through the point (m, 1), where m was the smallest observed clone size. Ages given as a range for anonymization purposes.
Figure 5.
Figure 5.
First incomplete moment over time. (ad) Curves in the LFIM may only be visible after sufficient time has passed, allowing both fast- and slow-growing clones to reach large enough sizes to be detectable through sequencing. Examples of the first incomplete moment for a simulation of non-neutral competition are shown for four timepoints. One per cent of mutations are non-neutral with a fitness drawn from a normal distribution, NN (mean = 0.1, std = 0.1). The vertical dashed line shows the detection limit, arbitrarily set at 100 cells. The section of the first incomplete moment that would not be visible due to the detection limit is shown in grey to the left of the line; the visible section is shown in black. The red dashed line is a straight-line fit to the smallest 75% of visible mutant clones. (Online version in colour.)
Figure 6.
Figure 6.
Clone size and selection. (a,b) Proportion of non-neutral clones in different size ranges. (a) The first incomplete moment of the clone size distribution from a simulation with 1% non-neutral mutations. Coloured regions correspond to ranges of clone sizes described in b. (b) Proportion of non-neutral clones in each clone size interval. Colours correspond to the regions shaded in a. (c) First incomplete moments of the human oesophagus mutation data for one individual, aged 72–75 [5], including only synonymous mutations and mutations in genes that are non-expressed (Methods). The synonymous mutation T125T in TP53 was excluded as it has been found to affect splicing [12,26]. Clone sizes which extend across multiple samples are merged using the methods of the original study [5]. All mutations on chromosomes 1–22 were assumed to be heterozygous. The extent of deviation from the straight line can be seen by comparing the data (solid) to the dashed red line, which shows a straight-line fit to the smallest 75% of clones. (d) Median VAF for nonsense mutations in the five most significantly selected genes from the dN/dS analysis plotted against the dN/dS ratio for nonsense mutations. Combined results for all individuals in the study. The dashed line shows the median VAF of all synonymous mutations. Note that many of these synonymous mutations are likely to be passengers on non-neutral clonal expansions, and therefore, the line does not represent the median VAF of mutations that have grown solely under neutral drift. One-sided Mann–Whitney tests show that, aside from NOTCH2 (p = 0.06), nonsense mutant clones in the genes shown are significantly larger than synonymous mutant clones (p < 0.0001).

Similar articles

Cited by

  • Agent-based methods facilitate integrative science in cancer.
    West J, Robertson-Tessi M, Anderson ARA. West J, et al. Trends Cell Biol. 2023 Apr;33(4):300-311. doi: 10.1016/j.tcb.2022.10.006. Epub 2022 Nov 17. Trends Cell Biol. 2023. PMID: 36404257 Free PMC article. Review.
  • Selection of Oncogenic Mutant Clones in Normal Human Skin Varies with Body Site.
    Fowler JC, King C, Bryant C, Hall MWJ, Sood R, Ong SH, Earp E, Fernandez-Antoran D, Koeppel J, Dentro SC, Shorthouse D, Durrani A, Fife K, Rytina E, Milne D, Roshan A, Mahububani K, Saeb-Parsy K, Hall BA, Gerstung M, Jones PH. Fowler JC, et al. Cancer Discov. 2021 Feb;11(2):340-361. doi: 10.1158/2159-8290.CD-20-1092. Epub 2020 Oct 21. Cancer Discov. 2021. PMID: 33087317 Free PMC article.
  • Outcompeting p53-Mutant Cells in the Normal Esophagus by Redox Manipulation.
    Fernandez-Antoran D, Piedrafita G, Murai K, Ong SH, Herms A, Frezza C, Jones PH. Fernandez-Antoran D, et al. Cell Stem Cell. 2019 Sep 5;25(3):329-341.e6. doi: 10.1016/j.stem.2019.06.011. Epub 2019 Jul 18. Cell Stem Cell. 2019. PMID: 31327664 Free PMC article.
  • Lineage tracing in human tissues.
    Gabbutt C, Wright NA, Baker AM, Shibata D, Graham TA. Gabbutt C, et al. J Pathol. 2022 Jul;257(4):501-512. doi: 10.1002/path.5911. Epub 2022 May 5. J Pathol. 2022. PMID: 35415852 Free PMC article. Review.
  • Homeostasis limits keratinocyte evolution.
    Schenck RO, Kim E, Bravo RR, West J, Leedham S, Shibata D, Anderson ARA. Schenck RO, et al. Proc Natl Acad Sci U S A. 2022 Aug 30;119(35):e2006487119. doi: 10.1073/pnas.2006487119. Epub 2022 Aug 23. Proc Natl Acad Sci U S A. 2022. PMID: 35998218 Free PMC article.

References

    1. Forbes SA, et al. 2017. COSMIC: somatic cancer genetics at high-resolution. Nucleic Acids Res. 45(D1), D777–D783. (10.1093/nar/gkw1121) - DOI - PMC - PubMed
    1. The Cancer Genome Atlas Research N, Kim J, et al. 2017. Integrated genomic characterization of oesophageal carcinoma. Nature 541, 169 (10.1038/nature20805) - DOI - PMC - PubMed
    1. Pickering CR, et al. 2014. Mutational landscape of aggressive cutaneous squamous cell carcinoma. Clin. Cancer Res. 20, 6582 (10.1158/1078-0432.CCR-14-1768) - DOI - PMC - PubMed
    1. Martincorena I, et al. 2015. High burden and pervasive positive selection of somatic mutations in normal human skin. Science 348, 880–886. (10.1126/science.aaa6806) - DOI - PMC - PubMed
    1. Martincorena I, et al. 2018. Somatic mutant clones colonize the human esophagus with age. Science 362, 911–917. (10.1126/science.aau3879) - DOI - PMC - PubMed

Publication types

LinkOut - more resources