

Mechanistic interpretation of non-coding variants for discovering transcriptional regulators of drug response
- PMID: 31362726
- PMCID: PMC6664756
- DOI: 10.1186/s12915-019-0679-8
Mechanistic interpretation of non-coding variants for discovering transcriptional regulators of drug response
Abstract
Background: Identification of functional non-coding variants and their mechanistic interpretation is a major challenge of modern genomics, especially for precision medicine. Transcription factor (TF) binding profiles and epigenomic landscapes in reference samples allow functional annotation of the genome, but do not provide ready answers regarding the effects of non-coding variants on phenotypes. A promising computational approach is to build models that predict TF-DNA binding from sequence, and use such models to score a variant's impact on TF binding strength. Here, we asked if this mechanistic approach to variant interpretation can be combined with information on genotype-phenotype associations to discover transcription factors regulating phenotypic variation among individuals.
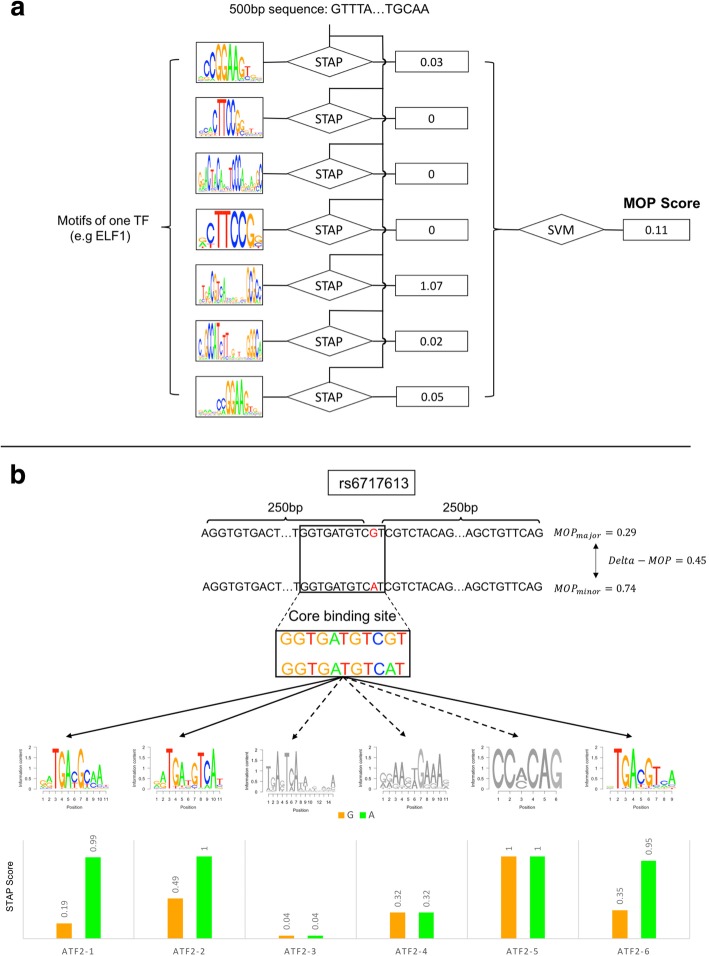
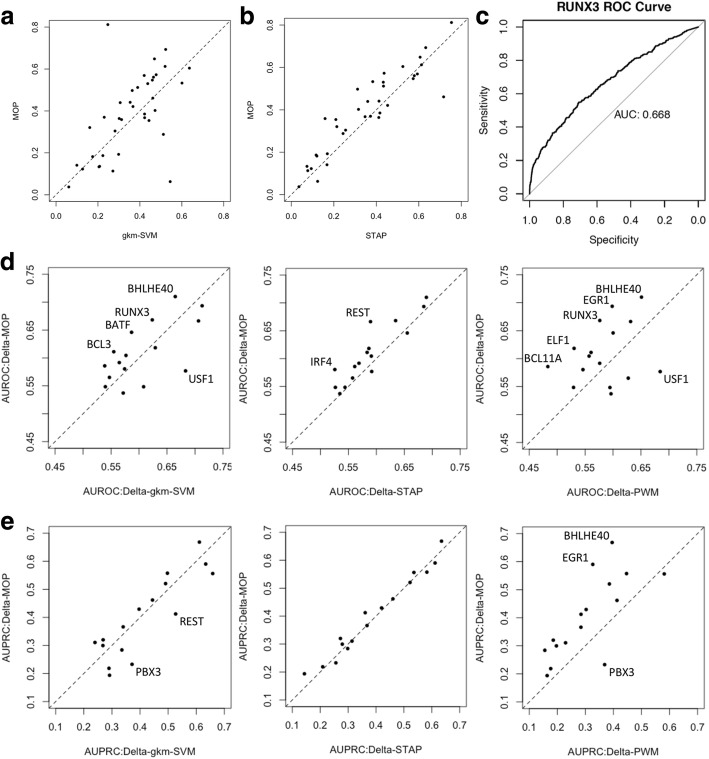
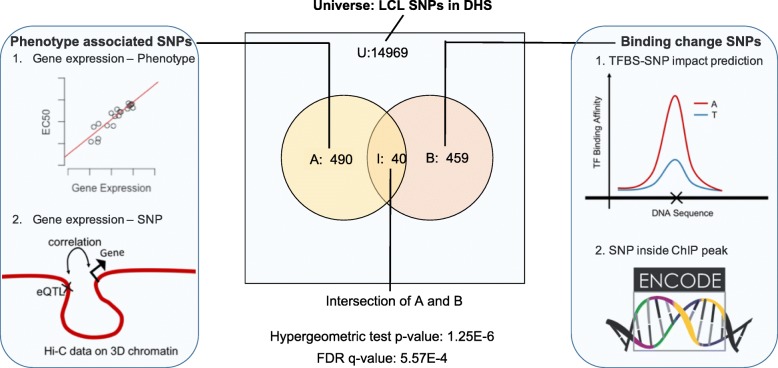
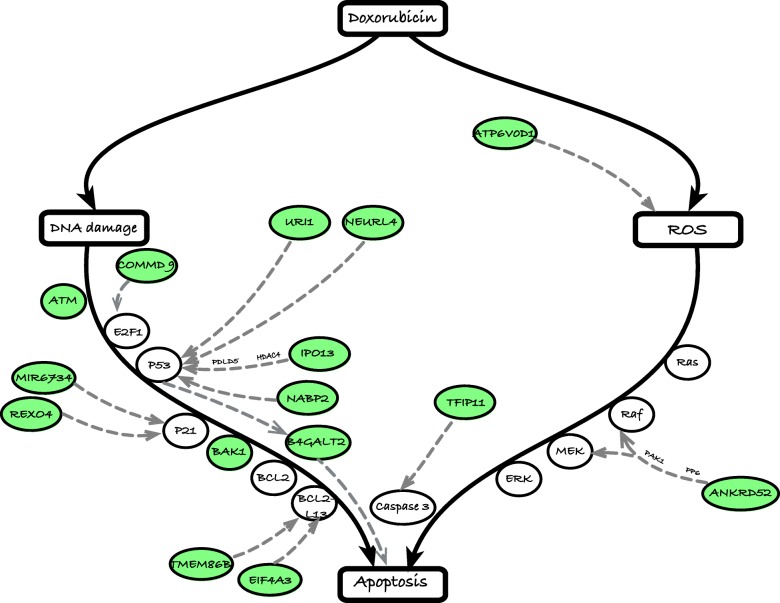
Results: We developed a statistical approach that integrates phenotype, genotype, gene expression, TF ChIP-seq, and Hi-C chromatin interaction data to answer this question. Using drug sensitivity of lymphoblastoid cell lines as the phenotype of interest, we tested if non-coding variants statistically linked to the phenotype are enriched for strong predicted impact on DNA binding strength of a TF and thus identified TFs regulating individual differences in the phenotype. Our approach relies on a new method for predicting variant impact on TF-DNA binding that uses a combination of biophysical modeling and machine learning. We report statistical and literature-based support for many of the TFs discovered here as regulators of drug response variation. We show that the use of mechanistically driven variant impact predictors can identify TF-drug associations that would otherwise be missed. We examined in depth one reported association-that of the transcription factor ELF1 with the drug doxorubicin-and identified several genes that may mediate this regulatory relationship.
Conclusion: Our work represents initial steps in utilizing predictions of variant impact on TF binding sites for discovery of regulatory mechanisms underlying phenotypic variation. Future advances on this topic will be greatly beneficial to the reconstruction of phenotype-associated gene regulatory networks.
Conflict of interest statement
The authors declare that they have no competing interests.
Figures
Similar articles
-
Principled multi-omic analysis reveals gene regulatory mechanisms of phenotype variation.Genome Res. 2018 Aug;28(8):1207-1216. doi: 10.1101/gr.227066.117. Epub 2018 Jun 13. Genome Res. 2018. PMID: 29898900 Free PMC article.
-
Transcription factor-binding k-mer analysis clarifies the cell type dependency of binding specificities and cis-regulatory SNPs in humans.BMC Genomics. 2023 Oct 7;24(1):597. doi: 10.1186/s12864-023-09692-9. BMC Genomics. 2023. PMID: 37805453 Free PMC article.
-
Identification of breast cancer associated variants that modulate transcription factor binding.PLoS Genet. 2017 Sep 28;13(9):e1006761. doi: 10.1371/journal.pgen.1006761. eCollection 2017 Sep. PLoS Genet. 2017. PMID: 28957321 Free PMC article.
-
Genomic resources for dissecting the role of non-protein coding variation in gene-environment interactions.Toxicology. 2020 Aug;441:152505. doi: 10.1016/j.tox.2020.152505. Epub 2020 May 22. Toxicology. 2020. PMID: 32450112 Free PMC article. Review.
-
Integrating molecular networks with genetic variant interpretation for precision medicine.Wiley Interdiscip Rev Syst Biol Med. 2019 May;11(3):e1443. doi: 10.1002/wsbm.1443. Epub 2018 Dec 12. Wiley Interdiscip Rev Syst Biol Med. 2019. PMID: 30548534 Free PMC article. Review.
Cited by
-
VarSAn: associating pathways with a set of genomic variants using network analysis.Nucleic Acids Res. 2021 Sep 7;49(15):8471-8487. doi: 10.1093/nar/gkab624. Nucleic Acids Res. 2021. PMID: 34313777 Free PMC article.
-
Mechanistic analysis of enhancer sequences in the estrogen receptor transcriptional program.Commun Biol. 2024 Jun 11;7(1):719. doi: 10.1038/s42003-024-06400-5. Commun Biol. 2024. PMID: 38862711 Free PMC article.
-
Integrative genomics analysis of various omics data and networks identify risk genes and variants vulnerable to childhood-onset asthma.BMC Med Genomics. 2020 Aug 31;13(1):123. doi: 10.1186/s12920-020-00768-z. BMC Med Genomics. 2020. PMID: 32867763 Free PMC article.
-
Thermodynamics-based modeling reveals regulatory effects of indirect transcription factor-DNA binding.iScience. 2022 Mar 24;25(5):104152. doi: 10.1016/j.isci.2022.104152. eCollection 2022 May 20. iScience. 2022. PMID: 35465052 Free PMC article.
-
Gene-Wise Burden of Coding Variants Correlates to Noncoding Pharmacogenetic Risk Variants.Int J Mol Sci. 2020 Apr 27;21(9):3091. doi: 10.3390/ijms21093091. Int J Mol Sci. 2020. PMID: 32349395 Free PMC article.
References
-
- Qian Q, Wang Y, Zhou R, Yang L, Faraone SV. Family-based and case-control association studies of DRD4 and DAT1 polymorphisms in Chinese attention deficit hyperactivity disorder patients suggest long repeats contribute to genetic risk for the disorder. Am J Med Genet B Neuropsychiatr Genet. 2004;128B(1):84–89. - PubMed
Publication types
MeSH terms
Substances
Grants and funding
LinkOut - more resources
Full Text Sources
Other Literature Sources
Miscellaneous
