. 2019 Jul 30;12(1):113.
doi: 10.1186/s12920-019-0560-1.

Analysis of genetic networks regulating refractive eye development in collaborative cross progenitor strain mice reveals new genes and pathways underlying human myopia

Affiliations

Analysis of genetic networks regulating refractive eye development in collaborative cross progenitor strain mice reveals new genes and pathways underlying human myopia

Tatiana V Tkatchenko et al. BMC Med Genomics. .

Abstract

Background: Population studies suggest that genetic factors play an important role in refractive error development; however, the precise role of genetic background and the composition of the signaling pathways underlying refractive eye development remain poorly understood.

Methods: Here, we analyzed normal refractive development and susceptibility to form-deprivation myopia in the eight progenitor mouse strains of the Collaborative Cross (CC). We used RNA-seq to analyze gene expression in the retinae of these mice and reconstruct genetic networks and signaling pathways underlying refractive eye development. We also utilized genome-wide gene-based association analysis to identify mouse genes and pathways associated with myopia in humans.

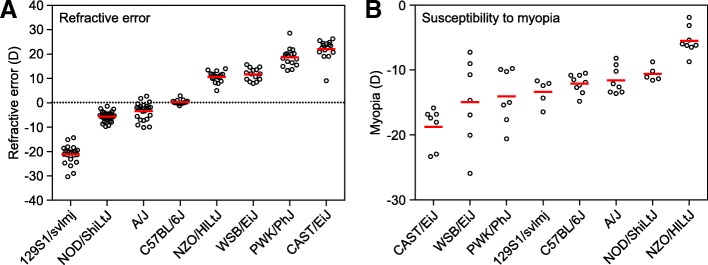
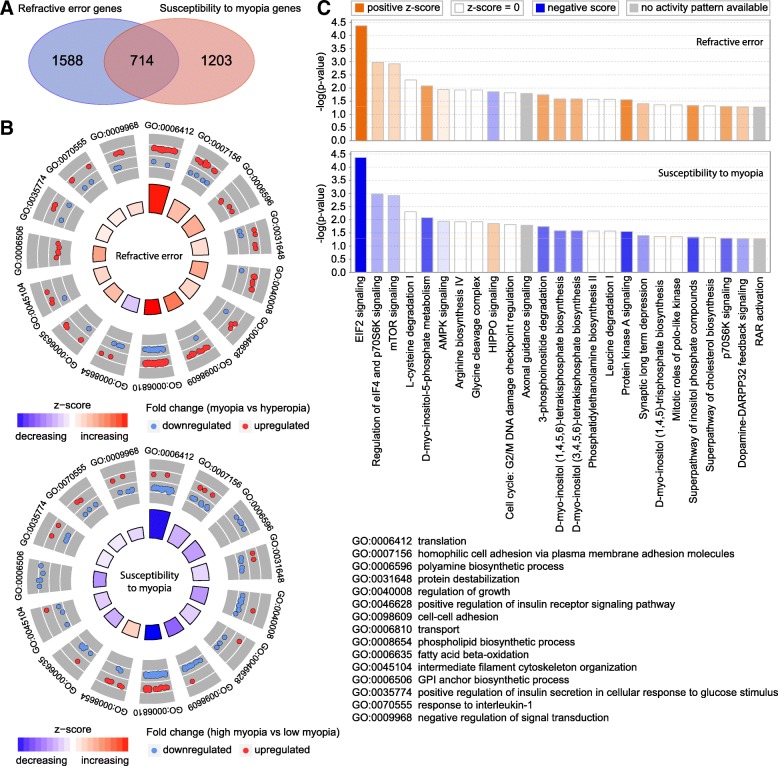
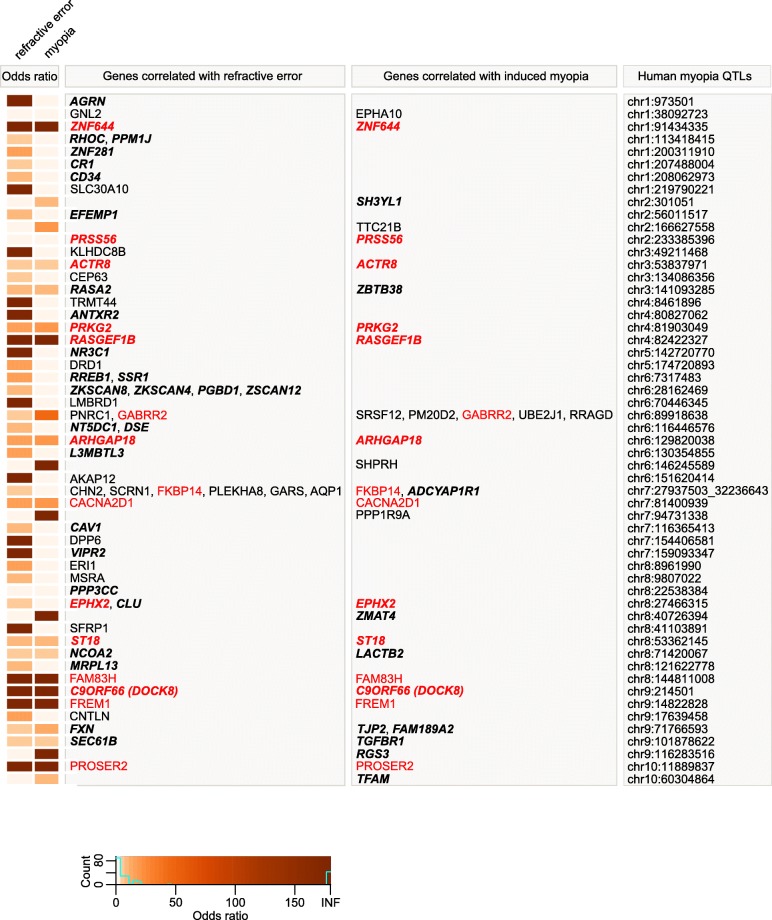
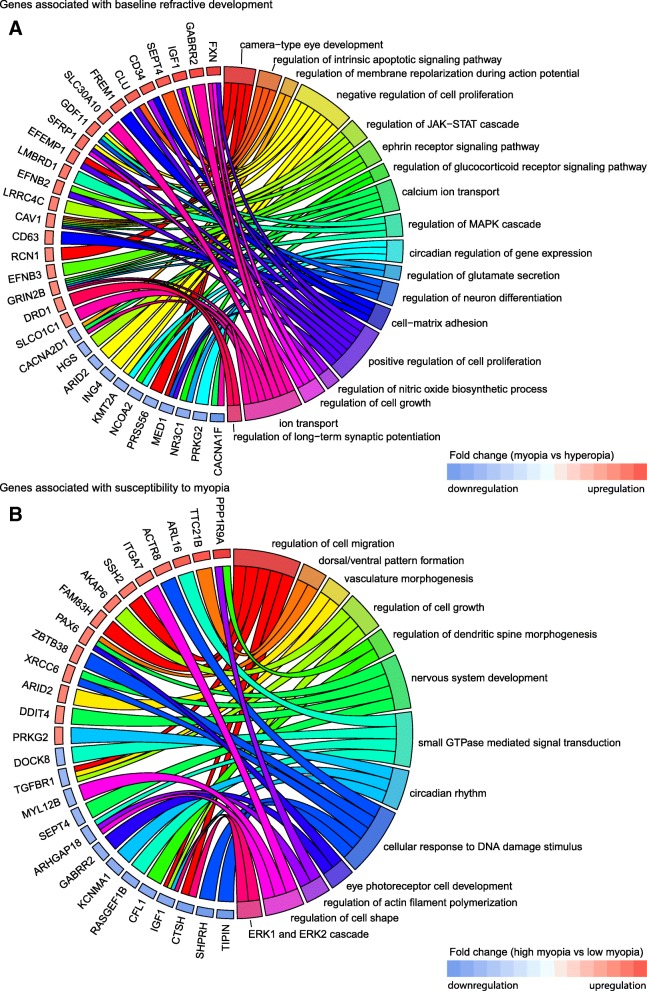
Results: Genetic background strongly influenced both baseline refractive development and susceptibility to environmentally-induced myopia. Baseline refractive errors ranged from - 21.2 diopters (D) in 129S1/svlmj mice to + 22.0 D in CAST/EiJ mice and represented a continuous distribution typical of a quantitative genetic trait. The extent of induced form-deprivation myopia ranged from - 5.6 D in NZO/HILtJ mice to - 20.0 D in CAST/EiJ mice and also followed a continuous distribution. Whole-genome (RNA-seq) gene expression profiling in retinae from CC progenitor strains identified genes whose expression level correlated with either baseline refractive error or susceptibility to myopia. Expression levels of 2,302 genes correlated with the baseline refractive state of the eye, whereas 1,917 genes correlated with susceptibility to induced myopia. Genome-wide gene-based association analysis in the CREAM and UK Biobank human cohorts revealed that 985 of the above genes were associated with myopia in humans, including 847 genes which were implicated in the development of human myopia for the first time. Although the gene sets controlling baseline refractive development and those regulating susceptibility to myopia overlapped, these two processes appeared to be controlled by largely distinct sets of genes.

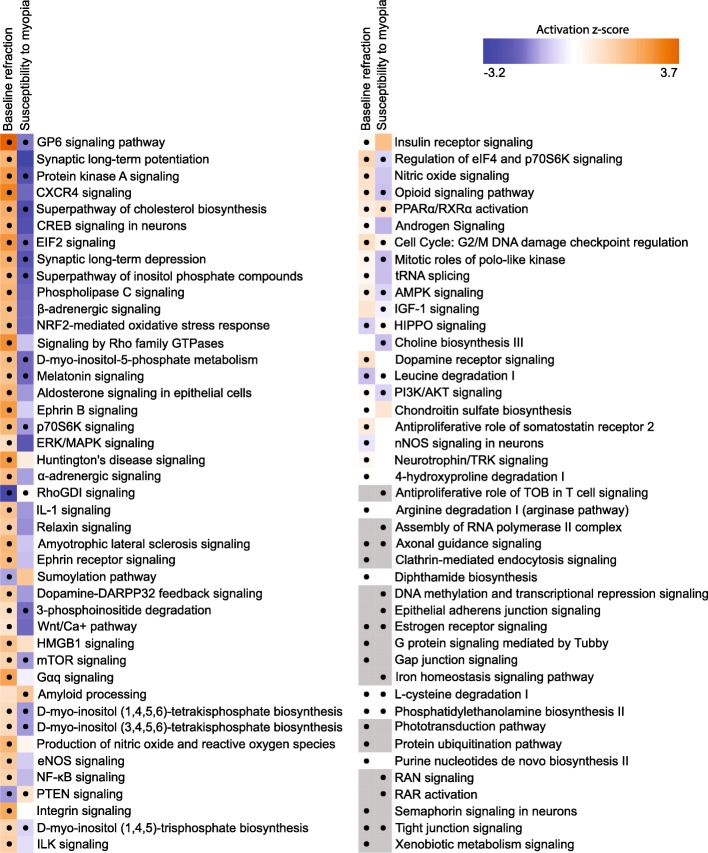
Conclusions: Comparison with data for other animal models of myopia revealed that the genes identified in this study comprise a well-defined set of retinal signaling pathways, which are highly conserved across different vertebrate species. These results identify major signaling pathways involved in refractive eye development and provide attractive targets for the development of anti-myopia drugs.

Keywords: Evolutionary conservation of pathways; Gene-based genome-wide association analysis; Genetic networks; Genetic variation; Myopia; RNA-seq; Refractive eye development; Signaling pathways.


Conflict of interest statement

AVT is a named inventor on two US patent applications related to the development of a pharmacogenomics pipeline for anti-myopia drug development. The remaining authors declare that they have no competing interests.

Figures

Fig. 1
Fig. 1
Genetic background modulates refractive eye development and susceptibility to myopia in mice. a Refractive error is inherited as a quantitative trait in the founder strains of Collaborative Cross. Baseline refractive errors at P40 range from highly myopic to highly hyperopic depending on the genetic background in different strains. Horizontal red lines show mean refractive errors for each strain, while each dot corresponds to mean refractive errors of individual animals. b Susceptibility to form-deprivation myopia is inherited as a quantitative trait in the founder strains of Collaborative Cross. The extent of myopia induced by 21 days of visual form deprivation in different strains ranged from − 5.5 ± 2.1 D in NZO/HlLtJ mice to − 18.7 ± 3.1 D in CAST/EiJ mice. Horizontal red lines identify means of induced myopia for each strain, while each dot represents a mean interocular difference between the deprived eye and control contralateral eye for individual animals
Fig. 2
Fig. 2
Baseline refractive eye development in mice is regulated by a large number of genes via multiple retinal signaling pathways. a Expression of 2,302 retinal genes correlates with baseline refractive error in mice. Hierarchical clustering results show that genes, whose expression correlates with refractive error in the founder strains of Collaborative Cross, are organized in two clusters, i.e., one (top) cluster exhibiting increased expression in the highly hyperopic mice, and the second (bottom) cluster showing increased expression in the myopic mice. b Top fifteen biological processes affected by the genes whose expression correlates with the baseline refractive errors in the founder strains of Collaborative Cross. Outer circle shows gene ontology IDs for the biological processes; second circle shows up- or down-regulated genes in the myopic mice versus hyperopic mice; inner circle shows activation or suppression of the corresponding biological processes, while the size of the sector corresponds to statistical significance (larger sectors correspond to smaller P-values). c Top twenty-five canonical pathways affected by the genes whose expression correlates with the baseline refractive errors in the founder strains of Collaborative Cross. Horizontal yellow line indicates P = 0.05. Z-score shows activation or suppression of the corresponding pathways
Fig. 3
Fig. 3
Susceptibility to myopia in mice is regulated by a large number of genes via multiple retinal signaling pathways. a Expression of 1,917 retinal genes correlates with susceptibility to form deprivation myopia in mice. Hierarchical clustering results show that genes, whose expression correlates with susceptibility to myopia in the founder strains of Collaborative Cross, are organized in two clusters, i.e., one (top) cluster exhibiting increased expression in mice with high susceptibility to myopia, and the second (bottom) cluster showing increased expression in mice with low susceptibility to myopia. b Top fifteen biological processes affected by the genes whose expression correlates with susceptibility to myopia in the founder strains of Collaborative Cross. Outer circle shows gene ontology IDs for the biological processes; second circle shows up- or down-regulated genes in mice with high susceptibility to myopia versus mice with low susceptibility to myopia; inner circle shows activation or suppression of the corresponding biological processes, while the size of the sector corresponds to statistical significance (larger sectors correspond to smaller P-values). c Top twenty-five canonical pathways affected by the genes whose expression correlates with susceptibility to myopia in the founder strains of Collaborative Cross. Horizontal yellow line indicates P = 0.05. Z-score shows activation or suppression of the corresponding pathways
Fig. 4
Fig. 4
Baseline refractive eye development and susceptibility to myopia in mice are regulated via overlapping pathways. a Venn diagram showing substantial overlap between genes underlying baseline refractive eye development and genes regulating susceptibility to myopia in Collaborative Cross progenitor strain mice. b Top fifteen biological processes affected by the 714 genes associated with both baseline refractive eye development (top panel) and susceptibility to myopia in mice (bottom panel). Outer circle shows gene ontology IDs for the biological processes; second circle shows up- or down-regulated genes in the myopic mice versus hyperopic mice (top panel), or in mice with high susceptibility to form-deprivation myopia versus mice with low susceptibility to myopia (bottom panel); inner circle shows activation or suppression of the corresponding biological processes, while the size of the sector corresponds to statistical significance (larger sectors correspond to smaller P-values). c Top twenty-five canonical pathways affected by the 714 genes involved in the regulation of both baseline refractive eye development (top panel) and susceptibility to myopia (bottom panel) in the founder strains of Collaborative Cross. Horizontal yellow line indicates P = 0.05. Z-score shows activation or suppression of the corresponding pathways
Fig. 5
Fig. 5
Summary of signaling pathways involved in regulation of baseline refractive eye development and susceptibility to myopia. Heatmap showing all statistically significant canonical pathways affected by the genes involved in baseline refractive development and the genes influencing susceptibility to myopia. Z-score shows activation or suppression of the corresponding pathways. The dots show statistical significance (P < 0.05)
Fig. 6
Fig. 6
Genes localized within human myopia QTLs show functional overlap with genes underlying baseline refractive eye development and susceptibility to myopia in mice. 750 candidate genes localized within 279 human myopia QTLs exhibit statistically significant overlap with both genes involved in baseline refractive eye development and genes regulating susceptibility to myopia in Collaborative Cross progenitor strain mice
Fig. 7
Fig. 7
Genes underlying baseline refractive eye development and susceptibility to myopia in mice are localized in human QTLs associated with myopia (part 1). Heatmap depicting genes and odds ratios for the overlaps between 109 human myopia QTLs and genes whose expression correlates with either baseline refractive errors, susceptibility to form deprivation myopia, or both in mice. Colors indicate odds ratios. Bold italic identifies genes found to be associated with refractive error in UK Biobank, CREAM, or both human samples by the gene-based genome-wide association analysis. Red identifies genes exhibiting correlation with both baseline refractive development and susceptibility to myopia in mice
Fig. 8
Fig. 8
Genes underlying baseline refractive eye development and susceptibility to myopia in mice are localized in human QTLs associated with myopia (part 2). Heatmap depicting genes and odds ratios for the overlaps between 109 human myopia QTLs and genes whose expression correlates with either baseline refractive errors, susceptibility to form deprivation myopia, or both in mice. Colors indicate odds ratios. Bold italic identifies genes found to be associated with refractive error in UK Biobank, CREAM, or both human samples by the gene-based genome-wide association analysis. Red identifies genes exhibiting correlation with both baseline refractive development and susceptibility to myopia in mice
Fig. 9
Fig. 9
Top biological processes associated with genes linked to refractive eye development in mice and localized in known human myopia QTLs. a Chord diagram showing key genes (left semicircle) and top biological processes (right semicircle) associated with genes correlated with baseline refractive development in mice and localized in known human QTLs linked to myopia. b Chord diagram showing key genes (left semicircle) and top biological processes (right semicircle) for genes correlated with susceptibility to myopia in mice and localized in known human QTLs linked to myopia. Colored bars underneath gene names show up- or down-regulation of corresponding genes in either myopic mice versus hyperopic mice (A), or mice with high susceptibility to myopia versus mice with low susceptibility to myopia (B)
Fig. 10
Fig. 10
Summary of key biological processes and pathways affected by genes underlying refractive eye development and found to be linked to myopia in UK Biobank and CREAM human cohorts. a Hierarchical clustering diagram showing top 30 biological processes affected by genes underlying baseline refractive eye development in humans. Outer circle shows hierarchical clusters of biological processes (identified by different colors) linked to baseline refractive development; inner circle shows clusters of the corresponding genes up- or down-regulated in myopic mice versus hyperopic mice. b Top twenty-five canonical pathways affected by the genes underlying baseline refractive eye development in humans. Horizontal yellow line indicates P = 0.05. Z-score shows activation or suppression of the corresponding pathways
Fig. 11
Fig. 11
Summary of key biological processes and pathways affected by genes regulating susceptibility to myopia and found to be linked to myopia in UK Biobank and CREAM human cohorts. a Hierarchical clustering diagram showing top 30 biological processes affected by genes regulating susceptibility to myopia in humans. Outer circle shows hierarchical clusters of biological processes (identified by different colors) underlying regulation of susceptibility to myopia; inner circle shows clusters of the corresponding genes up- or down-regulated in mice with high susceptibility to myopia versus mice with low susceptibility to myopia. b Top twenty-five canonical pathways affected by the genes regulating susceptibility to myopia in humans. Horizontal yellow line indicates P = 0.05. Z-score shows activation or suppression of the corresponding pathways

Similar articles

Cited by

References

    1. Pararajasegaram R. VISION 2020-the right to sight: from strategies to action. Am J Ophthalmol. 1999;128(3):359–360. doi: 10.1016/S0002-9394(99)00251-2. - DOI - PubMed
    1. Kempen JH, Mitchell P, Lee KE, Tielsch JM, Broman AT, Taylor HR, et al. The prevalence of refractive errors among adults in the United States, Western Europe, and Australia. Arch Ophthalmol. 2004;122(4):495–505. doi: 10.1001/archopht.122.4.495. - DOI - PubMed
    1. Javitt JC, Chiang YP. The socioeconomic aspects of laser refractive surgery. Arch Ophthalmol. 1994;112(12):1526–1530. doi: 10.1001/archopht.1994.01090240032022. - DOI - PubMed
    1. Vitale S, Sperduto RD, Ferris FL., 3rd Increased prevalence of myopia in the United States between 1971-1972 and 1999-2004. Arch Ophthalmol. 2009;127(12):1632–1639. doi: 10.1001/archophthalmol.2009.303. - DOI - PubMed
    1. Holden BA, Fricke TR, Wilson DA, Jong M, Naidoo KS, Sankaridurg P, et al. Global prevalence of myopia and high myopia and temporal trends from 2000 through 2050. Ophthalmology. 2016;123(5):1036–1042. doi: 10.1016/j.ophtha.2016.01.006. - DOI - PubMed

Publication types